

Construction and evaluation of a diagnostic model for metabolic dysfunction-associated steatotic liver disease based on advanced glycation end products and their receptors
- PMID: 40224638
- PMCID: PMC11985537
- DOI: 10.3389/fmed.2025.1539708
Construction and evaluation of a diagnostic model for metabolic dysfunction-associated steatotic liver disease based on advanced glycation end products and their receptors
Abstract
Background: Effective biomarkers for the diagnosis of metabolic dysfunction-associated steatotic liver disease (MASLD) remain limited. This study aims to evaluate the potential of advanced glycation end products (AGEs) and their endogenous secretory receptor (esRAGE) as non-invasive biomarkers for diagnosing MASLD, to explore differences between obese and non-obese MASLD patients, and to develop a novel diagnostic model based on these biomarkers.
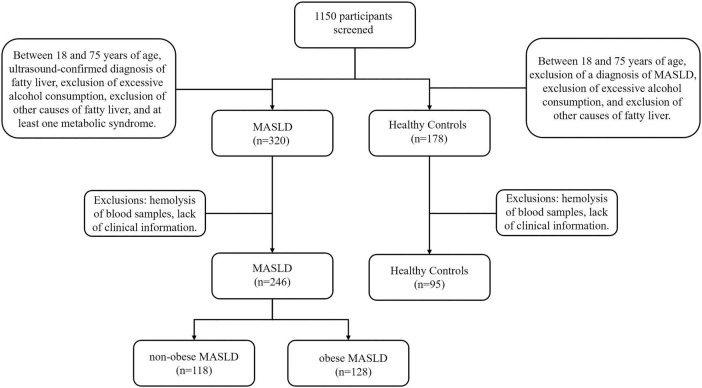
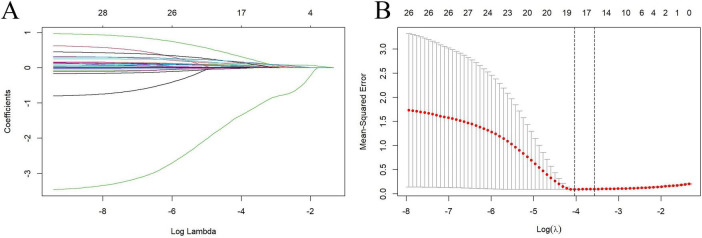
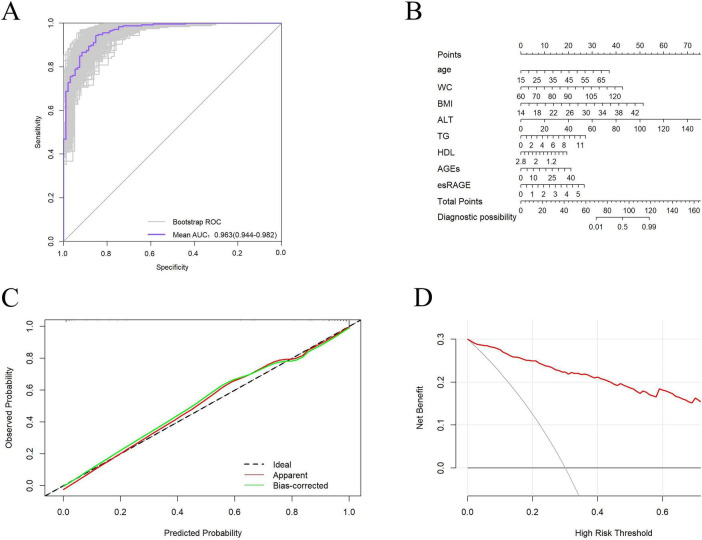
Methods: This study enrolled 341 participants, including 246 MASLD patients (118 non-obese, 128 obese) and 95 healthy controls. Serum AGEs and esRAGE levels were measured by ELISA. Key predictors were identified using the Lasso algorithm, and a diagnostic model was developed with logistic regression and visualized as nomograms. Diagnostic accuracy and utility were evaluated through the area under the curve (AUC), bootstrap validation, calibration curves, and decision curve analysis (DCA).
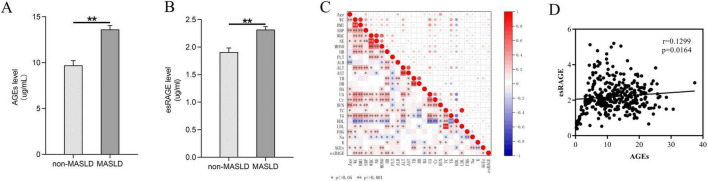
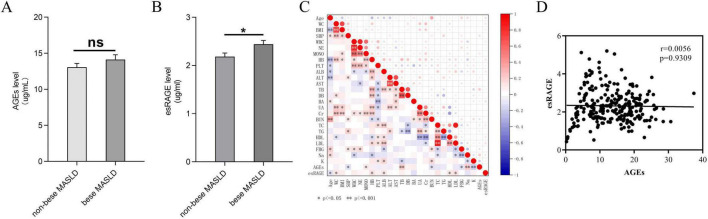
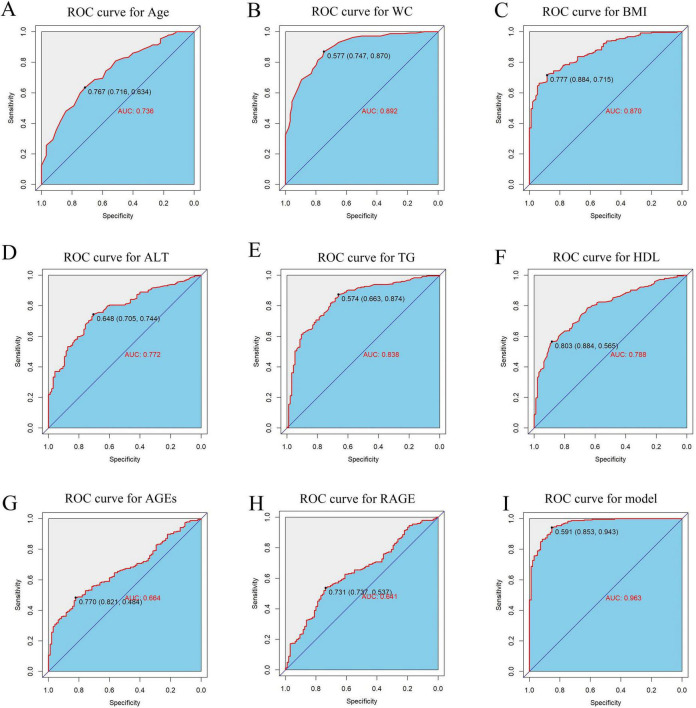
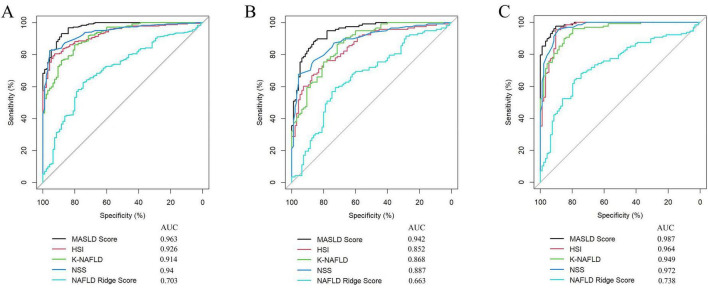
Results: Serum AGEs and esRAGE levels were significantly higher in MASLD patients compared to controls. Moreover, obese MASLD patients had higher esRAGE levels than non-obese ones, but no significant difference in AGEs levels was found. A diagnostic model incorporating age, WC, BMI, ALT, TG, HDL, AGEs, and esRAGE achieved an AUC of 0.963, with 94.3% sensitivity and 85.3% specificity. The AUC for bootstrap internal validation was 0.963 (95% CI: 0.944-0.982). Calibration curves showed strong predictive accuracy, and DCA demonstrated high net clinical benefit.
Conclusion: Serum AGEs and esRAGE serve as non-invasive biomarkers for distinguishing MASLD patients. We developed and validated diagnostic models for MASLD, offering valuable tools to identify at-risk populations and improve prevention and treatment strategies.
Keywords: MASLD; advanced glycation end products; diagnostic model; esRAGE; non-obese.
Copyright © 2025 Cao, Xiao, Jiang and Fu.
Conflict of interest statement
The authors declare that the research was conducted in the absence of any commercial or financial relationships that could be construed as a potential conflict of interest.
Figures
Similar articles
-
Modulation of soluble receptor for advanced glycation end products isoforms and advanced glycation end products in long-living individuals.Biomark Med. 2021 Aug;15(11):785-796. doi: 10.2217/bmm-2020-0856. Epub 2021 Jul 8. Biomark Med. 2021. PMID: 34236256
-
Metabolic and Hepatic Profiles of Non-Obese and Obese Metabolic Dysfunction-Associated Steatotic Liver Disease in Adolescents: The Role of FibroScan Parameters,Fibroblast Growth Factor-21, and Cytokeratin-18.Turk J Gastroenterol. 2025 Feb 3;36(3):152-161. doi: 10.5152/tjg.2025.24760. Turk J Gastroenterol. 2025. PMID: 39910885 Free PMC article.
-
AGEs/sRAGE, a novel risk factor in the pathogenesis of end-stage renal disease.Mol Cell Biochem. 2016 Dec;423(1-2):105-114. doi: 10.1007/s11010-016-2829-4. Epub 2016 Oct 6. Mol Cell Biochem. 2016. PMID: 27714575 Clinical Trial.
-
Non-invasive Scores and Serum Biomarkers for Fatty Liver in the Era of Metabolic Dysfunction-associated Steatotic Liver Disease (MASLD): A Comprehensive Review From NAFLD to MAFLD and MASLD.Curr Obes Rep. 2024 Sep;13(3):510-531. doi: 10.1007/s13679-024-00574-z. Epub 2024 May 29. Curr Obes Rep. 2024. PMID: 38809396 Free PMC article. Review.
-
Endogenous secretory receptor for advanced glycation end-products and cardiovascular disease in end-stage renal disease.J Ren Nutr. 2008 Jan;18(1):76-82. doi: 10.1053/j.jrn.2007.10.016. J Ren Nutr. 2008. PMID: 18089449 Review.
References
LinkOut - more resources
Full Text Sources
Miscellaneous