

Identification of the Molecular Subtype and Prognostic Characteristics of Breast Cancer Based on Tumor-Infiltrating Regulatory T Cells
- PMID: 40224950
- PMCID: PMC11991805
- DOI: 10.1155/tbj/6913291
Identification of the Molecular Subtype and Prognostic Characteristics of Breast Cancer Based on Tumor-Infiltrating Regulatory T Cells
Abstract
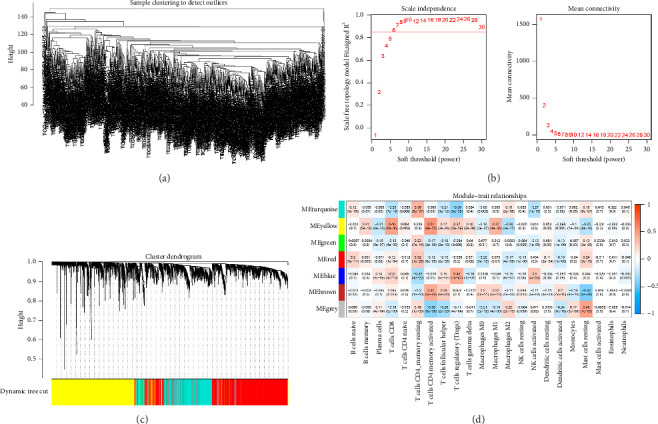
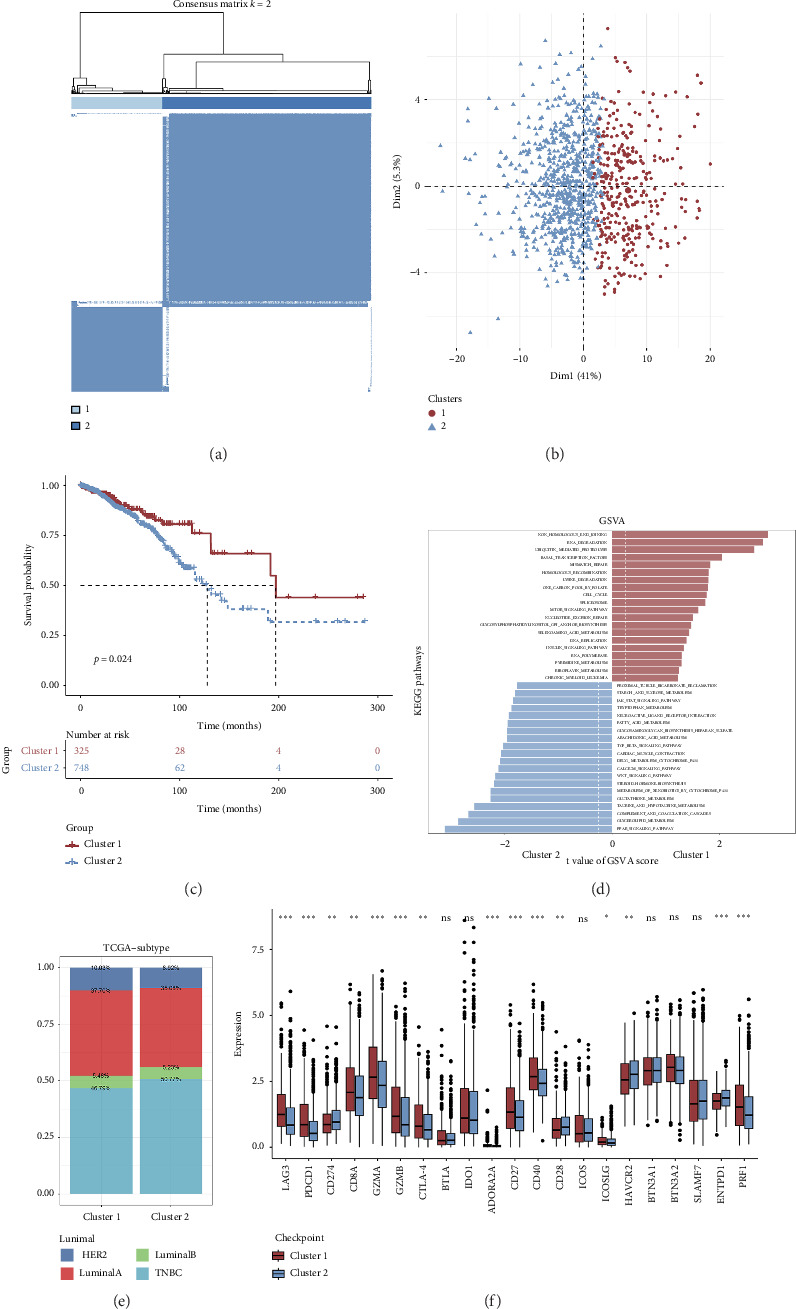
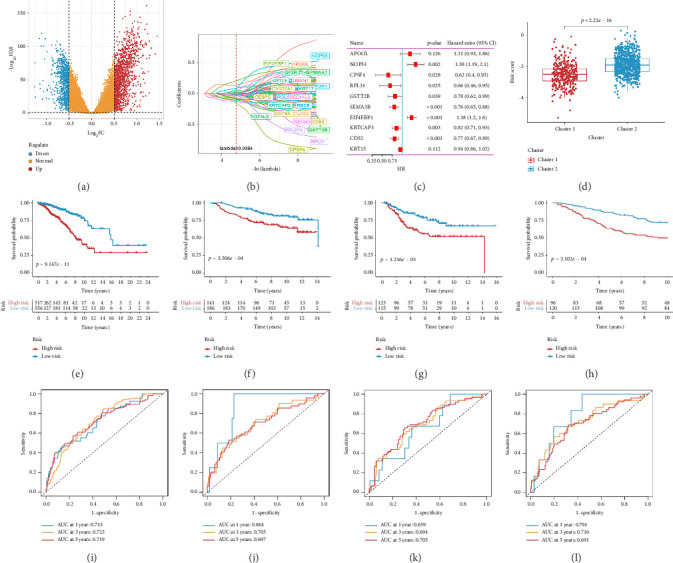
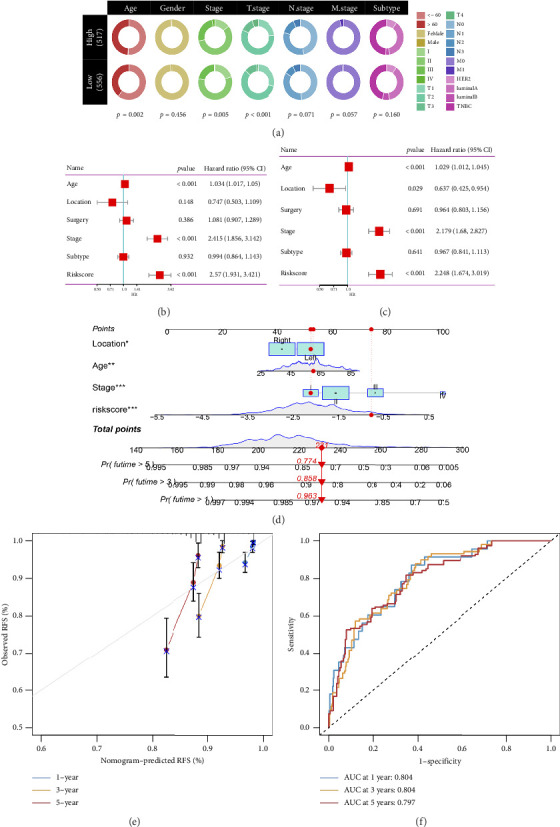
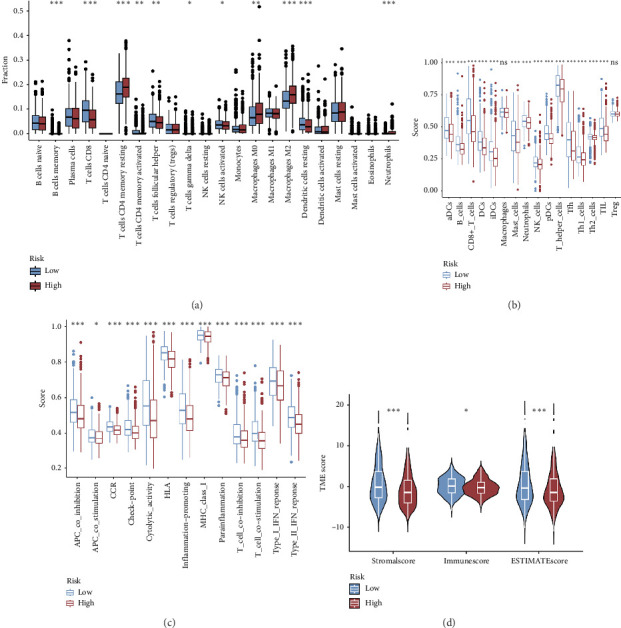
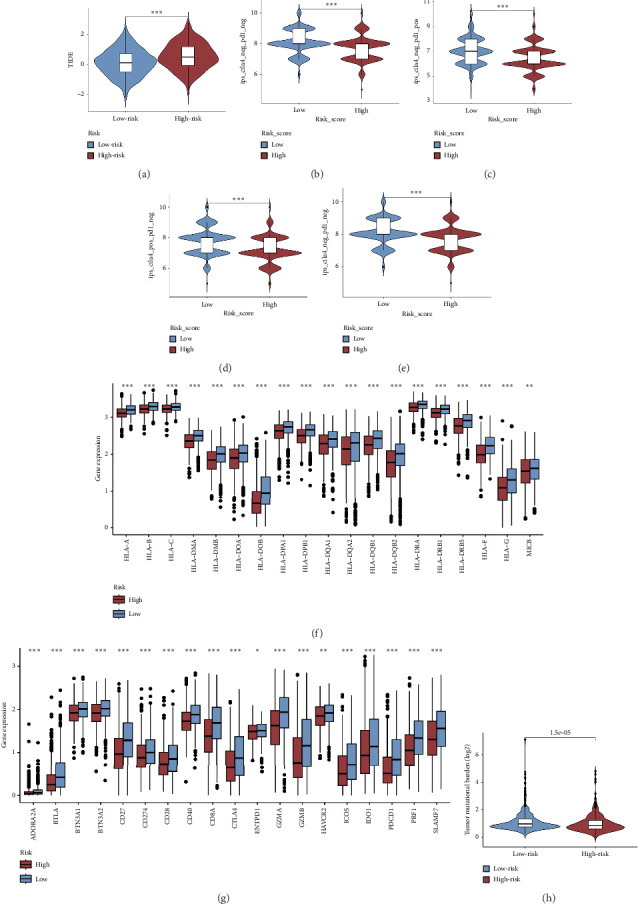
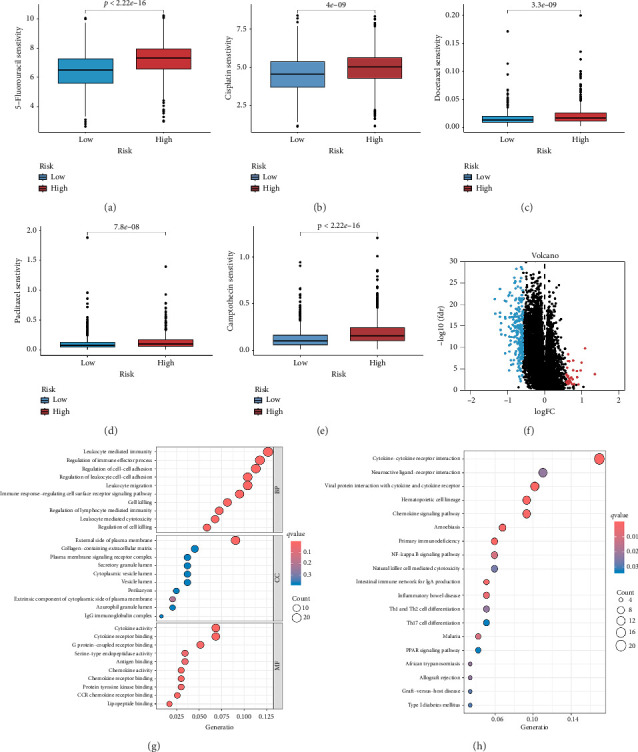
Background: T regulatory cells (Tregs) are essential for preserving immune tolerance. They are present in large numbers in many tumors, hindering potentially beneficial antitumor responses. However, their predictive significance for breast cancer (BC) remains ambiguous. This study aimed to explore genes associated with Tregs and develop a prognostic signature associated with Tregs. Methods: The gene expression and clinical data on BC were obtained from The Cancer Genome Atlas (TCGA) and Gene Expression Omnibus (GEO) databases. The integration of CIBERSORT and weighted correlation network analysis (WGCNA) algorithms was utilized to identify modules associated with Tregs. The consensus cluster algorithm was utilized to create molecular subtypes determined by genes associated with Tregs. Then, a prognostic signature associated with Tregs was constructed and its relationship to tumor immunity and the prognosis was evaluated. Results: The blue module genes exhibited the most significant correlation with Tregs, and 1080 genes related to Tregs were acquired. A total of 93 genes from the TCGA dataset were found to have a significant impact on patient prognosis. Samples from BC were categorized into two clusters by consensus cluster analysis. The overall survival, immune checkpoint genes, molecular subtype, and biological behaviors varied significantly between these two subtypes. A 10-gene signature developed from differentially expressed genes between two subtypes demonstrated consistent prognostic accuracy in both TCGA and GEO datasets. It functioned as a standalone prognostic marker for individuals with BC. In addition, patients with low risk are more inclined to exhibit increased immune cell infiltration, TME score, and tumor mutation burden (TMB). Meanwhile, Individuals classified within the low-risk group showed better responses to immunotherapies compared to their counterparts in the high-risk group. Conclusions: The prognostic model derived from Tregs-related genes could aid in assessing the prognosis, guiding personalized treatment, and potentially enhancing the clinical outcomes for patients with BC.
Keywords: breast cancer; immunotherapy; prognostic model; regulatory T cells; tumor microenvironment.
Copyright © 2025 Jianying Ma et al. The Breast Journal published by John Wiley & Sons Ltd.
Conflict of interest statement
The authors declare no conflicts of interest.
Figures
Similar articles
-
Development and Clinical Validation of Novel 8-Gene Prognostic Signature Associated With the Proportion of Regulatory T Cells by Weighted Gene Co-Expression Network Analysis in Uterine Corpus Endometrial Carcinoma.Front Immunol. 2021 Dec 14;12:788431. doi: 10.3389/fimmu.2021.788431. eCollection 2021. Front Immunol. 2021. PMID: 34970268 Free PMC article.
-
PANoptosis-related molecular clustering and prognostic signature associated with the immune landscape and therapy response in breast cancer.Medicine (Baltimore). 2024 Sep 13;103(37):e39511. doi: 10.1097/MD.0000000000039511. Medicine (Baltimore). 2024. PMID: 39287311 Free PMC article.
-
Comprehensive single-cell and bulk transcriptomic analyses to develop an NK cell-derived gene signature for prognostic assessment and precision medicine in breast cancer.Front Immunol. 2024 Oct 23;15:1460607. doi: 10.3389/fimmu.2024.1460607. eCollection 2024. Front Immunol. 2024. PMID: 39507529 Free PMC article.
-
The expression of CCL17 and potential prognostic value on tumor immunity in thyroid carcinoma based on bioinformatics analysis.Sci Rep. 2024 Dec 30;14(1):31580. doi: 10.1038/s41598-024-75750-1. Sci Rep. 2024. PMID: 39738081 Free PMC article.
-
Tumor-infiltrating immune cells state-implications for various breast cancer subtypes.Front Immunol. 2025 May 14;16:1550003. doi: 10.3389/fimmu.2025.1550003. eCollection 2025. Front Immunol. 2025. PMID: 40438111 Free PMC article. Review.
References
-
- Harbeck N., Penault-Llorca F., Cortes J., et al. Breast Cancer. Nature Reviews Disease Primers . 2019;5(1):p. 66. - PubMed
-
- Ferlay J., Colombet M., Soerjomataram I., et al. Cancer Statistics for the Year 2020: An Overview. International Journal of Cancer . 2021 - PubMed
-
- Sung H., Ferlay J., Siegel R. L., et al. Global Cancer Statistics 2020: GLOBOCAN Estimates of Incidence and Mortality Worldwide for 36 Cancers in 185 Countries. CA: A Cancer Journal for Clinicians . 2021;71(3):209–249. - PubMed
-
- Perou C. M., Sørlie T., Eisen M. B., et al. Molecular Portraits of Human Breast Tumours. Nature . 2000;406(6797):747–752. - PubMed
MeSH terms
Substances
LinkOut - more resources
Full Text Sources
Medical
