. 2025 Mar 30;14(3):1531-1566.
doi: 10.21037/tcr-24-1027. Epub 2025 Mar 27.

Targeting PAR-2-driven inflammatory pathways in colorectal cancer: mechanistic insights from atorvastatin and rosuvastatin treatment in cell line models

Affiliations

Targeting PAR-2-driven inflammatory pathways in colorectal cancer: mechanistic insights from atorvastatin and rosuvastatin treatment in cell line models

Rajashree Patnaik et al. Transl Cancer Res. .

Abstract

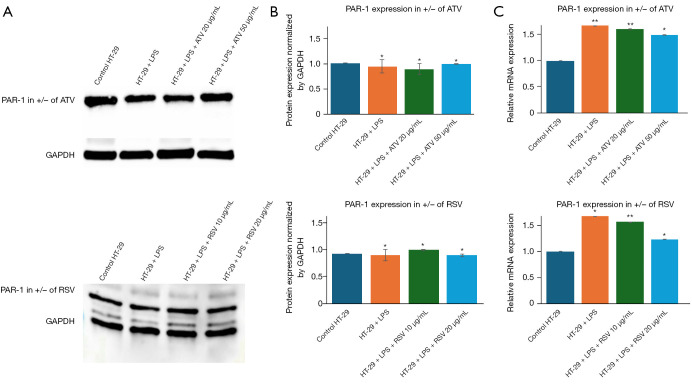
Background: Colorectal cancer (CRC) is a growing health concern globally and in regions such as the United Arab Emirates, where risk factors like obesity and hyperlipidaemia are prevalent. Chronic inflammation, driven by pathways involving protease-activated receptor 2 (PAR-2), plays a pivotal role in CRC progression, creating a tumour-promoting microenvironment. The overexpression of PAR-2 has been associated with increased tumour aggressiveness and drug resistance. While previous studies have focused on broad inflammatory modulation, this study explores the selective targeting of PAR-2 by atorvastatin (ATV) and rosuvastatin (RSV), highlighting their specificity by assessing minimal impact on PAR-1 expression, which serves as a control.

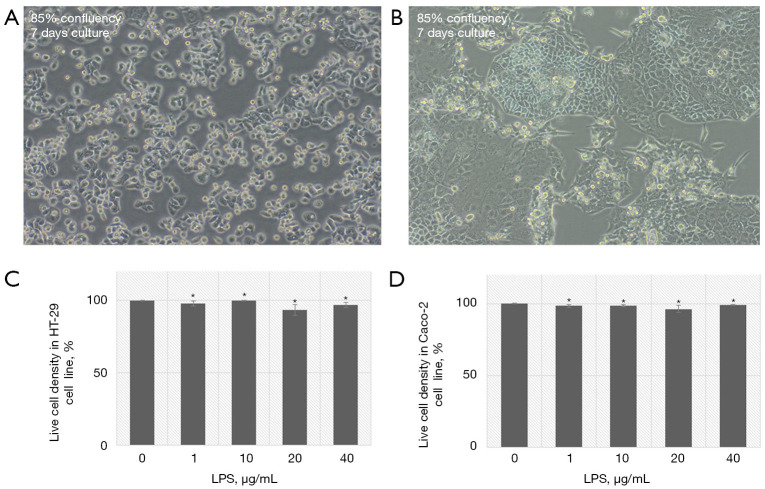
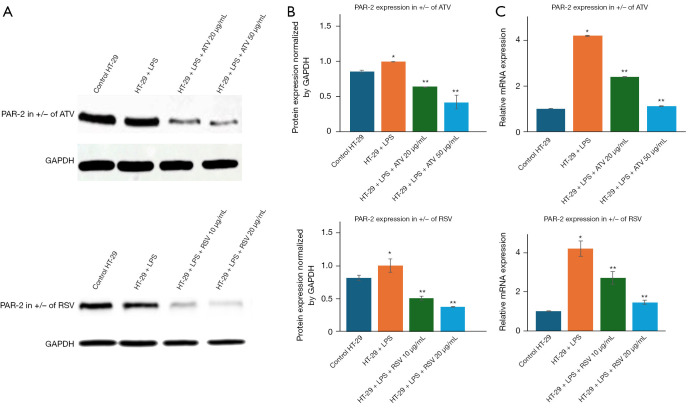
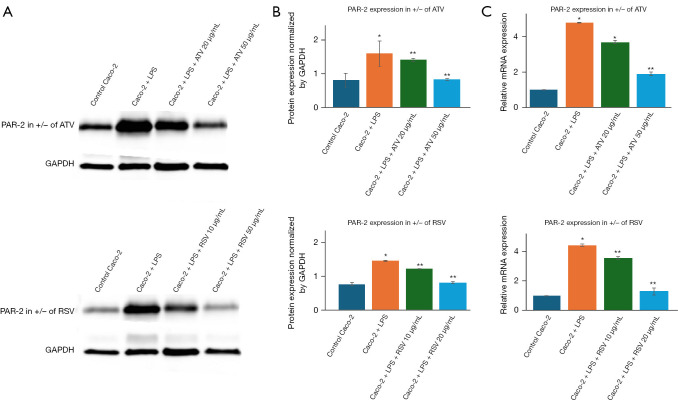
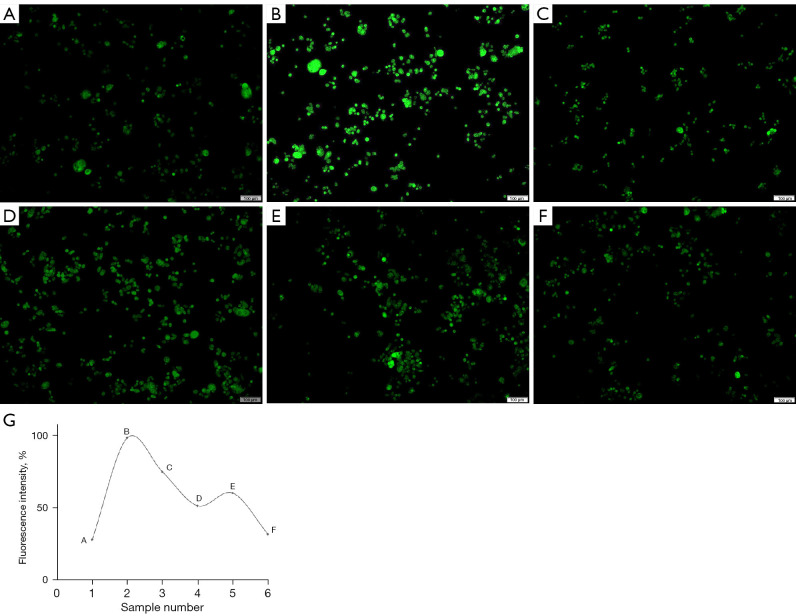
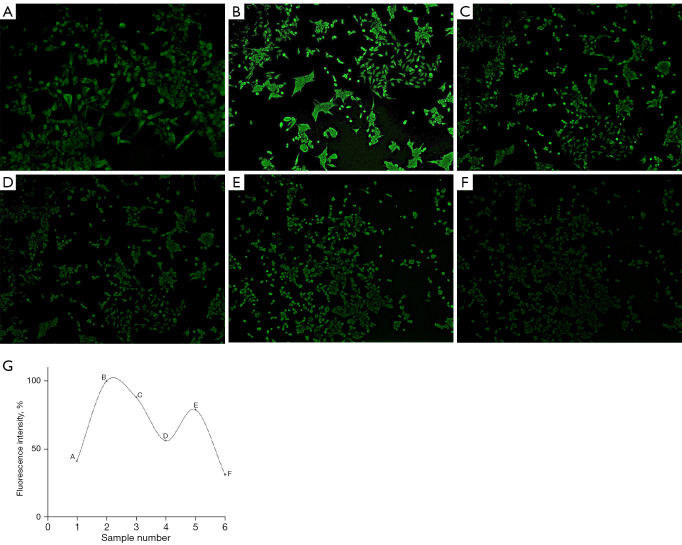
Methods: HT-29 and Caco-2 CRC cell lines were employed to investigate the anti-inflammatory effects of ATV and RSV. Inflammation was induced with lipopolysaccharide (LPS), followed by treatment with varying concentrations of ATV and RSV. Western blotting and real-time polymerase chain reaction for quantification (qPCR) were performed to quantify PAR-2 and TNF-α at both the protein and mRNA levels. Enzyme linked immunosorbent assay (ELISA) was used to measure the secretion of TNF-α. Calcium signalling, which plays a crucial role in inflammation, was analysed using Fluo-4 AM dye, with fluorescence imaging capturing the effects of statin treatment on intracellular calcium influx.

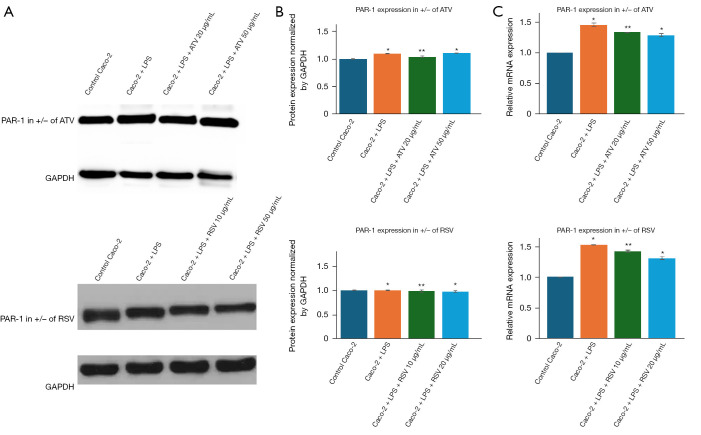
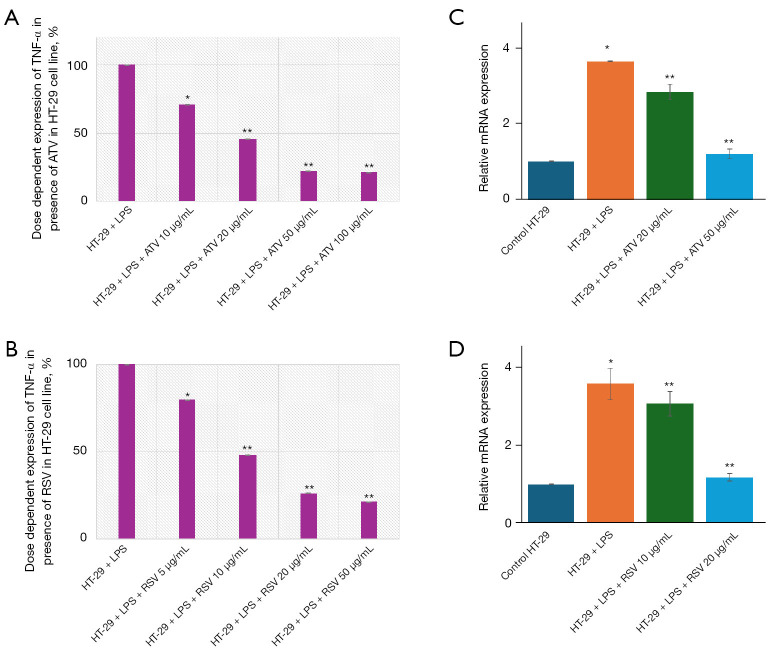
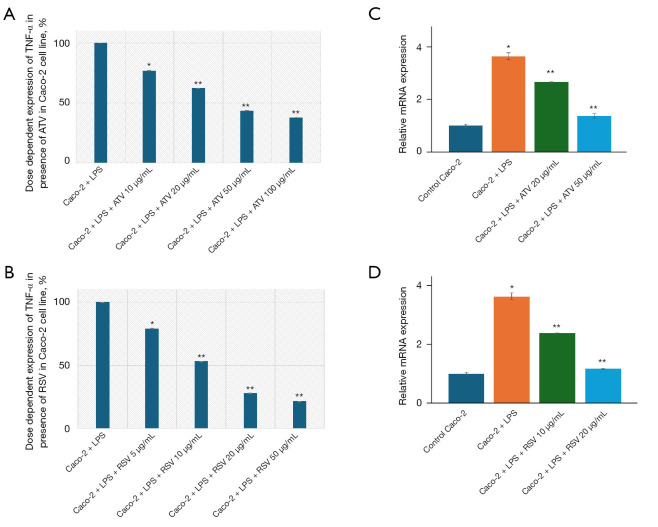
Results: LPS treatment significantly upregulated PAR-2 and TNF-α expression in both cell lines, validating the inflammatory model. Co-treatment with ATV or RSV reduced PAR-2 and TNF-α expression in a dose-dependent manner. The higher concentrations of ATV (50 µg/mL) and RSV (20 µg/mL) produced the most significant reduction in these inflammatory markers at both the protein and mRNA levels. Importantly, the treatment did not substantially alter PAR-1 expression, underlining the specificity of ATV and RSV in modulating PAR-2-mediated pathways. Additionally, statin treatment attenuated LPS-induced calcium influx, with fluorescence intensity decreasing markedly at higher concentrations of both statins.

Conclusions: This study provides novel insights into the selective targeting of PAR-2 by ATV and RSV, distinguishing their effects from PAR-1. The reduction in PAR-2 expression and TNF-α secretion, along with the suppression of calcium signalling, underscores the potential of these statins as targeted anti-inflammatory agents in CRC. The findings highlight the therapeutic value of ATV and RSV in modulating inflammation through PAR-2-specific pathways, which may contribute to reduced cancer progression. These results pave the way for further preclinical and clinical evaluations to explore statins as adjunctive therapies in the management of CRC.

Keywords: Protease-activated receptor 2 (PAR-2); calcium signalling; colorectal cancer (CRC); inflammation; statins.


Conflict of interest statement

Conflicts of Interest: All authors have completed the ICMJE uniform disclosure form (available at https://tcr.amegroups.com/article/view/10.21037/tcr-24-1027/coif). The authors have no conflicts of interest to declare.

Figures

Figure 1
Figure 1
Morphological assessment and viability of HT-29 and Caco-2 cells after 7 days of culture. (A,B) Representative phase-contrast images of HT-29 (A) and Caco-2 (B) cells at 85% confluency after 7 days of culture in standard growth conditions. Both cell lines were observed at 20× magnification by using a phase contrast microscope. The cell lines show distinct morphological characteristics, with HT-29 cells displaying a rounded shape, while Caco-2 cells exhibit a more elongated, epithelial-like morphology with areas of tight junction formation. These images confirm healthy, confluent monolayers suitable for subsequent experimental treatments. (C,D) Quantification of cell viability assessed using the MTT assay after treatment with increasing concentrations of a test compound (1, 10, 20, and 40 µg/mL) for 24 hours. (C) HT-29 cells show a mild, non-significant reduction in viability at all concentrations, with viability remaining above 90%. (D) Caco-2 cells maintain a similar trend, with cell viability remaining high (>90%) across all treatment concentrations, indicating that the compound does not exert cytotoxic effects on these cell lines under the tested conditions. *, statistically significant differences compared to the untreated control (0 µg/mL) at P<0.05. These results suggest that both HT-29 and Caco-2 cells exhibit robust viability, validating their suitability for further mechanistic studies. LPS, lipopolysaccharide; MTT, 3-(4,5-Dimethylthiazol-2-yl)-2,5- diphenyltetrazolium bromide.
Figure 2
Figure 2
Modulation of PAR-2 expression by ATV and RSV in HT-29 cells. (A) Western blot analysis showing PAR-2 protein expression in HT-29 cells under different treatment conditions. Cells were treated with LPS alone or with ATV at 20 and 50 µg/mL (top panel) and RSV at 10 and 20 µg/mL (bottom panel). LPS treatment markedly increased PAR-2 expression compared to the control. Both ATV and RSV reduced PAR-2 levels in a concentration-dependent manner, indicating statin-mediated inhibition of LPS-induced PAR-2 upregulation. GAPDH was used as a loading control to ensure consistent protein loading. (B) Densitometric quantification of PAR-2 protein levels normalized to GAPDH. Top panel (ATV): LPS significantly increased PAR-2 expression compared to the control (*, P<0.05). ATV at both 20 and 50 µg/mL significantly decreased PAR-2 expression (**, P<0.01), with the higher concentration showing a more pronounced effect. Bottom panel (RSV): LPS increased PAR-2 expression compared to the control (*, P<0.05). RSV treatment at 10 and 20 µg/mL significantly reduced PAR-2 expression (**, P<0.01), with the highest reduction observed at 20 µg/mL. (C) Relative PAR-2 mRNA expression in HT-29 cells, measured by qPCR, presented for both ATV and RSV treatments. Top panel (ATV): LPS treatment led to a significant increase in PAR-2 mRNA expression compared to the control (*, P<0.05). Treatment with ATV at 20 and 50 µg/mL significantly decreased PAR-2 mRNA levels (**, P<0.01), showing a dose-dependent effect. Bottom panel (RSV): similarly, LPS increased PAR-2 mRNA expression compared to the control (*, P<0.05). RSV at both 10 and 20 µg/mL significantly reduced PAR-2 mRNA expression (**, P<0.01), with a stronger effect at 20 µg/mL. ATV, atorvastatin; LPS, lipopolysaccharide; qPCR, real-time polymerase chain reaction for quantification; RSV, rosuvastatin.
Figure 3
Figure 3
Modulation of PAR-2 expression by ATV and RSV in Caco-2 cells. (A) Western blot analysis showing the expression of PAR-2 and GAPDH in Caco-2 cells under different treatment conditions. Cells were treated with LPS alone or in combination with ATV at 20 and 50 µg/mL (top panel) and RSV at 10 and 20 µg/mL (bottom panel). LPS treatment significantly increased PAR-2 protein expression compared to the control. Co-treatment with ATV and RSV resulted in a dose-dependent reduction in PAR-2 levels, with the greatest reductions observed at 50 µg/mL ATV and 20 µg/mL RSV. GAPDH was used as a loading control to ensure equal protein quantification. (B) Densitometric quantification of the Western blot bands, normalized to GAPDH expression. Top panel (ATV): LPS treatment significantly increased PAR-2 expression (P<0.05) compared to the control. ATV treatment at 20 and 50 µg/mL significantly reduced PAR-2 protein levels (P<0.01) in a concentration-dependent manner. Bottom panel (RSV): similarly, LPS treatment increased PAR-2 expression (P<0.05). RSV treatment at 10 and 20 µg/mL resulted in a significant reduction in PAR-2 expression (P<0.01), with the most pronounced effect at 20 µg/mL. (C) Relative mRNA expression of PAR-2 in Caco-2 cells measured by qPCR. Top panel (ATV): LPS treatment significantly upregulated PAR-2 mRNA levels (P<0.05) compared to the control, while ATV at both 20 and 50 µg/mL significantly reduced mRNA expression (P<0.01) in a dose-dependent manner. Bottom panel (RSV): LPS treatment also increased PAR-2 mRNA levels (P<0.05) compared to the control. RSV at 10 and 20 µg/mL significantly downregulated PAR-2 mRNA expression (P<0.01), with the greatest reduction observed at 20 µg/mL. Student’s t-test was performed on each experimental dataset, *, P<0.05; **, P<0.01. ATV, atorvastatin; LPS, lipopolysaccharide; qPCR, real-time polymerase chain reaction for quantification; RSV, rosuvastatin.
Figure 4
Figure 4
Modulation of PAR-1 expression by ATV and RSV in HT-29 cells. (A) Western blot analysis showing the expression of PAR-1 and GAPDH in HT-29 cells under different treatment conditions. Cells were treated with LPS alone or in combination with ATV at 20 and 50 µg/mL (top panel) and RSV at 10 and 20 µg/mL (bottom panel). LPS treatment led to a slight increase in PAR-1 expression compared to the control. However, co-treatment with ATV or RSV resulted in only minor changes in PAR-1 levels, indicating that statins have negligible effects on PAR-1 expression. GAPDH was used as a loading control to ensure equal protein quantification. (B) Densitometric quantification of the Western blot bands, normalized to GAPDH expression. Top panel (ATV): LPS treatment slightly increased PAR-1 expression compared to the control. Treatment with ATV at 20 and 50 µg/mL resulted in minimal, non-significant changes in PAR-1 levels. Bottom panel (RSV): like ATV, RSV at 10 and 20 µg/mL showed only minor effects on PAR-1 expression, with no statistically significant differences compared to LPS treatment alone. (C) Relative mRNA expression of PAR-1 in HT-29 cells measured by RT-PCR. Top panel (ATV): LPS treatment caused a slight increase in PAR-1 mRNA levels compared to the control. Co-treatment with ATV at 20 and 50 µg/mL showed minor, non-significant reductions in mRNA expression. Bottom panel (RSV): LPS treatment also increased PAR-1 mRNA levels compared to the control. RSV treatment at 10 and 20 µg/mL resulted in only slight reductions in mRNA expression, with no significant differences observed. Student’s t-test was performed on each experimental dataset, *, P<0.05; **, P<0.01. ATV, atorvastatin; LPS, lipopolysaccharide; RSV, rosuvastatin; qPCR, real-time polymerase chain reaction for quantification.
Figure 5
Figure 5
Modulation of PAR-1 expression by ATV and RSV in Caco-2 cells. (A) Western blot analysis showing PAR-1 protein expression in Caco-2 cells under different treatment conditions. Cells were treated with LPS alone or in combination with ATV at 20 and 50 µg/mL (top panel) and RSV at 10 and 20 µg/mL (bottom panel). LPS treatment slightly increased PAR-1 expression compared to the control. However, co-treatment with ATV or RSV produced only minor changes in PAR-1 levels, indicating that statins have minimal effects on PAR-1 expression. GAPDH was used as a loading control to ensure consistent protein loading and quantification. (B) Densitometric quantification of the Western blot bands, normalized to GAPDH expression. Top panel (ATV): LPS treatment caused a slight increase in PAR-1 expression (P<0.05) compared to the control. Treatment with ATV at 20 and 50 µg/mL resulted in minor, non-significant changes in PAR-1 levels. Bottom panel (RSV): Like ATV, RSV treatment at 10 and 20 µg/mL showed minimal effects on PAR-1 expression, with no significant changes compared to the LPS-treated group. (C) Relative PAR-1 mRNA expression in Caco-2 cells measured by qPCR. Top panel (ATV): LPS treatment led to a small increase in PAR-1 mRNA expression (P<0.05) compared to the control. Treatment with ATV at both concentrations caused only minor reductions in mRNA levels, which were not statistically significant. Bottom panel (RSV): LPS also increased PAR-1 mRNA expression slightly compared to the control. RSV treatment at 10 and 20 µg/mL resulted in minimal changes in mRNA expression, with no statistically significant differences compared to the LPS group. Student’s t-test was performed on each experimental dataset, *, P<0.05; **, P<0.01. ATV, atorvastatin; LPS, lipopolysaccharide; RSV, rosuvastatin; RT-PCR, reverse transcription time polymerase chain reaction.
Figure 6
Figure 6
Dose-dependent modulation of TNF-α secretion and mRNA expression by ATV and RSV in HT-29 cells. (A) TNF-α secretion measured by ELISA in HT-29 cells treated with LPS alone or in combination with ATV at concentrations of 10, 20, 50, and 100 µg/mL. LPS treatment alone resulted in a significant increase in TNF-α secretion. Co-treatment with ATV produced a dose-dependent reduction in TNF-α secretion, with significant suppression observed at 20 µg/mL and higher concentrations (P<0.01). (B) TNF-α secretion measured by ELISA following treatment with LPS and RSV at 5, 10, 20, and 50 µg/mL. RSV treatment resulted in a dose-dependent reduction in TNF-α secretion, with significant decreases starting from 10 µg/mL (P<0.01) and maximum suppression observed at 50 µg/mL RSV. (C) Relative mRNA expression of TNF-α measured by RT-PCR in HT-29 cells treated with LPS and ATV. LPS treatment significantly increased TNF-α mRNA expression compared to the control (P<0.05). Co-treatment with ATV at 20 and 50 µg/mL resulted in significant reductions in TNF-α mRNA levels (P<0.01), confirming the dose-dependent inhibitory effect of ATV. (D) TNF-α mRNA expression in HT-29 cells treated with LPS and RSV, measured by RT-PCR. LPS treatment elevated TNF-α mRNA expression (P<0.05). RSV treatment at 10 and 20 µg/mL significantly reduced TNF-α mRNA expression (P<0.01), demonstrating the dose-dependent effect of RSV on TNF-α transcription. Student’s t-test was performed on each experimental dataset, *, P<0.05; **, P<0.01. ATV, atorvastatin; ELISA, enzyme linked immunosorbent assay; LPS, lipopolysaccharide; RSV, rosuvastatin; RT-PCR, reverse transcription time polymerase chain reaction.
Figure 7
Figure 7
Dose-dependent modulation of TNF-α secretion and mRNA expression by ATV and RSV in Caco-2 cells. (A) TNF-α secretion measured by ELISA in Caco-2 cells treated with LPS alone or co-treated with ATV at concentrations of 10, 20, 50, and 100 µg/mL. LPS treatment resulted in a significant increase in TNF-α secretion compared to the control. Co-treatment with ATV caused a dose-dependent reduction in TNF-α secretion, with significant reductions observed at 20 µg/mL and above (P<0.01). The highest suppression was observed at 100 µg/mL ATV. (B) TNF-α secretion measured by ELISA in Caco-2 cells following treatment with LPS and RSV at 5, 10, 20, and 50 µg/mL. LPS stimulation led to a marked increase in TNF-α secretion. RSV treatment produced a dose-dependent reduction in TNF-α secretion, with statistically significant reductions starting from 10 µg/mL (P<0.01). The greatest suppression was observed at 50 µg/mL RSV. (C) Relative mRNA expression of TNF-α measured by RT-PCR in Caco-2 cells treated with LPS and ATV. LPS treatment significantly increased TNF-α mRNA levels compared to the control (P<0.05). Co-treatment with ATV at 20 and 50 µg/mL led to a dose-dependent reduction in TNF-α mRNA expression, with significant suppression observed at both concentrations (P<0.01). (D) TNF-α mRNA expression measured by RT-PCR in Caco-2 cells treated with LPS and RSV. LPS treatment significantly elevated TNF-α mRNA levels compared to the control (P<0.05). RSV treatment at 10 and 20 µg/mL produced a dose-dependent decrease in TNF-α mRNA expression, with the highest reduction observed at 20 µg/mL (P<0.01). Student’s t-test was performed on each experimental dataset, *, P<0.05; **, P<0.01. ATV, atorvastatin; ELISA, enzyme linked immunosorbent assay; LPS, lipopolysaccharide; RSV, rosuvastatin; RT-PCR, reverse transcription time polymerase chain reaction.
Figure 8
Figure 8
Effect of ATV and RSV on calcium fluorescence intensity in HT-29 cells. (A-F) Fluorescence microscopy images at 20× magnification of HT-29 cells stained with Fluo-4 AM, depicting calcium fluorescence under different treatment conditions. (A) Control HT-29 cells showing minimal baseline fluorescence. (B) HT-29 cells treated with LPS, displaying enhanced fluorescence intensity, indicative of increased intracellular calcium levels. (C) Cells treated with LPS + ATV (20 µg/mL), showing a reduction in fluorescence compared to LPS treatment alone. (D) Cells treated with LPS + ATV (50 µg/mL), exhibiting further suppression of fluorescence, indicating a dose-dependent reduction in calcium influx. (E) HT-29 cells treated with LPS + RSV (10 µg/mL), with fluorescence intensity slightly reduced compared to LPS alone. (F) Cells treated with LPS + RSV (20 µg/mL), displaying the lowest fluorescence among RSV-treated groups, demonstrating a dose-dependent inhibitory effect on calcium signalling. (G) Quantified fluorescence intensity of HT-29 cells across treatment conditions (A-F); the highest fluorescence is observed with LPS treatment alone, reflecting elevated calcium levels; co-treatment with ATV or RSV reduces fluorescence in a dose-dependent manner, with the most substantial suppression seen at 50 µg/mL ATV and 20 µg/mL RSV. ATV, atorvastatin; LPS, lipopolysaccharide; RSV, rosuvastatin.
Figure 9
Figure 9
Effect of ATV and RSV on calcium fluorescence intensity in Caco-2 cells. (A-F) Fluorescence microscopy images of Caco-2 cells at 20× magnification stained with Fluo-4 AM, representing calcium fluorescence under different treatment conditions. (A) Control Caco-2 cells showing low baseline fluorescence. (B) Cells treated with LPS, exhibiting a substantial increase in fluorescence intensity, indicating elevated intracellular calcium levels. (C) Cells treated with LPS + ATV (20 µg/mL), showing a reduction in fluorescence compared to LPS alone. (D) Cells treated with LPS + ATV (50 µg/mL), with further suppression of fluorescence, demonstrating a dose-dependent effect. (E) Cells treated with LPS + RSV (10 µg/mL), showing moderate reduction in fluorescence. (F) Cells treated with LPS + RSV (20 µg/mL), displaying the lowest fluorescence intensity among RSV-treated groups, indicating the most significant reduction in calcium influx. (G) Quantification of fluorescence intensity across the treatment groups from Panels A to F; the highest fluorescence intensity was observed in LPS-treated cells, indicating elevated calcium signalling; co-treatment with ATV or RSV resulted in a dose-dependent decrease in fluorescence intensity, with the most notable reductions at 50 µg/mL ATV and 20 µg/mL RSV. ATV, atorvastatin; LPS, lipopolysaccharide; RSV, rosuvastatin.
Figure 10
Figure 10
This figure illustrates the proposed mechanistic pathways by which ATV and RSV selectively inhibit PAR-2 signaling in CRC cells, without affecting PAR-1. The inhibition of PAR-2 by ATV and RSV disrupts multiple downstream signaling cascades associated with inflammation, tumor progression, and metastasis. The pathways investigated in this study are represented as follows: (I) PAR-2 specificity: both ATV and RSV specifically target PAR-2, as indicated by the red blocks on the PAR-2 receptor, while sparing PAR-1, which remains unaffected (top left of the figure). This specificity underscores the selective effect of statins on pro-inflammatory pathways without impacting vascular functions typically mediated by PAR-1. (II) Calcium-dependent inflammatory signaling: activation of PAR-2 leads to calcium (Ca2+)-dependent pro-inflammatory signaling, resulting in the upregulation of TNF-α and activation of the NF-κB pathway, both of which are key drivers of inflammation in CRC (shown on the left side). (III) LRP-6 and Wnt/β-catenin pathway: PAR-2 activation recruits LRP-6 and interacts with Axin, leading to the accumulation of stabilized β-catenin, which translocates to the nucleus and activates proto-oncogenes, promoting cell proliferation and tumor progression. Statin-mediated inhibition of PAR-2 disrupts this pathway, preventing β-catenin stabilization and subsequent oncogenic signaling (center). (IV) Inhibition of PI3K/Akt and MAPK pathways: PAR-2 signaling enhances the PI3K/Akt and MAPK pathways, which are involved in cell survival, EMT (epithelial-mesenchymal transition), cancer stem cell maintenance, and metastasis. ATV and RSV suppress these pathways by targeting PAR-2, thereby reducing CRC cell survival, chemoresistance, and metastatic potential (center and right side). (V) Anti-Inflammatory and non-PAR-2-mediated effects: statins also exhibit anti-inflammatory effects that are independent of PAR-2, including the inhibition of the NLRP3 (NOD-, LRR- and Pyrin Domain-Containing Protein 3) inflammasome, PLA2 activity, and mitochondrial dysregulation. These effects provide additional anti-inflammatory benefits that support CRC treatment (top right). (VI) Role of ERK and TGF-β pathway: Statin treatment inhibits PAR-2-mediated ERK and TGF-β signaling, which are implicated in metastasis, tumor initiation, and chemoresistance, further reducing the aggressive behavior of CRC cells. Molecules and pathways directly investigated in this study are marked with specific symbols for clarity. Signaling pathways are indicated with color-coded arrows to distinguish between two main signaling axes observed in PAR-2-mediated pathways. Overall, this figure integrates the molecular effects of statins on PAR-2 signaling and its downstream pathways, emphasizing the therapeutic potential of ATV and RSV in attenuating PAR-2-mediated inflammatory and tumorigenic processes in colorectal cancer. ATV, atorvastatin; CRC, colorectal cancer; RSV, rosuvastatin.

Similar articles

Cited by

References

    1. Sung H, Ferlay J, Siegel RL, et al. Global Cancer Statistics 2020: GLOBOCAN Estimates of Incidence and Mortality Worldwide for 36 Cancers in 185 Countries. CA Cancer J Clin 2021;71:209-49. 10.3322/caac.21660 - DOI - PubMed
    1. Naidoo N, Bajwa G, Duvuru R, et al. Thanatogenomic Investigation of the Hydroxymethylome and Mitochondrial Genome of Cadaveric Cardiomyocytes: Proposal for a Proof-of-Concept Study. JMIR Res Protoc 2020;9:e17241. 10.2196/17241 - DOI - PMC - PubMed
    1. Al Abdouli L, Dalmook H, Akram Abdo M, et al. Colorectal Cancer Risk Awareness and Screening Uptake among Adults in the United Arab Emirates. Asian Pac J Cancer Prev 2018;19:2343-9. 10.22034/APJCP.2018.19.8.2343 - DOI - PMC - PubMed
    1. Alsaad LN, Sreedharan J. Practice of colorectal cancer screening in the United Arab Emirates and factors associated - a cross-sectional study. BMC Public Health 2023;23:2015. 10.1186/s12889-023-16951-7 - DOI - PMC - PubMed
    1. Mamdouh H, Hussain HY, Ibrahim GM, et al. Prevalence and associated risk factors of overweight and obesity among adult population in Dubai: a population-based cross-sectional survey in Dubai, the United Arab Emirates. BMJ Open 2023;13:e062053. 10.1136/bmjopen-2022-062053 - DOI - PMC - PubMed

LinkOut - more resources