. 2025 Mar 30;14(3):1857-1873.
doi: 10.21037/tcr-24-1506. Epub 2025 Mar 19.

Analysis and assessment of ferroptosis-related gene signatures and prognostic risk models in skin cutaneous melanoma

Affiliations

Analysis and assessment of ferroptosis-related gene signatures and prognostic risk models in skin cutaneous melanoma

Jianchao Ma et al. Transl Cancer Res. .

Abstract

Background: The occurrence and development of skin cutaneous melanoma (SKCM) are significantly influenced by ferroptosis, a sort of regulated cell death characterized by iron deposition and lipid peroxidation. Although positive strides have been achieved in the present management of SKCM, it is still unknown exactly how ferroptosis occurs in this condition. We aimed to determine the role of prognostically relevant ferroptosis-related genes (PR-FRGs) in SKCM development and prognosis.

Methods: The training group was created using combined transcriptomic RNA data acquired from The Cancer Genome Atlas (TCGA) and Genotype-Tissue Expression (GTEx) databases. The dataset GSE19234 was acquired from the Gene Expression Omnibus (GEO) database as a validation group. Differentially expressed ferroptosis-related genes (DE-FRGs) were obtained from the training group, of which 103 showed up-regulation and 77 showed down-regulation. Then, 12 PR-FRGs were identified by the protein-protein interaction (PPI) network and Cox regression analysis, and prognostic risk models and nomograms were constructed. The risk model was validated using a validation group, and the prognostic value of the risk model was analyzed. Finally, immunohistochemical data were obtained from the Human Protein Atlas (HPA) website to validate the PR-FRGs.

Results: Twelve PR-FRGs were identified. A prognostic risk model was built using PR-FRGs, and patients in the training and validation groups were classified as high or low risk based on the risk model. The outcomes demonstrated that the prognosis was better for the low-risk group. Prognostic value analysis showed that the prognostic risk model could accurately predict the patients' overall survival (OS), was superior to clinical traits such as age, gender, and tumor stage in predicting ability, and could be used as an independent predictor. Meanwhile, the nomogram constructed based on PR-FRGs can effectively predict the prognosis of SKCM patients. Finally, PR-FRGs were validated in the HPA database.

Conclusions: Ferroptosis affects the prognosis of SKCM patients. Prognostic risk model and nomogram constructed based on 12 PR-FRGs demonstrated significant advantages in predicting the prognosis of SKCM patients. This will help in the identification and prognostic prediction of SKCM and in the discovery of new individualized treatment modalities.

Keywords: Skin cutaneous melanoma (SKCM); ferroptosis; nomogram; prognostic model; prognostic value.


Conflict of interest statement

Conflicts of Interest: All authors have completed the ICMJE uniform disclosure form (available at https://tcr.amegroups.com/article/view/10.21037/tcr-24-1506/coif). The authors have no conflicts of interest to declare.

Figures

Figure 1
Figure 1
Flow chart of this study. FRGs, ferroptosis-related genes; GO, Gene Ontology; GTEx, Genotype-Tissue Expression; KEGG, Kyoto Encyclopedia of Genes and Genomes; PPI, protein-protein interaction; ROC, receiver operating characteristic; SKCM, skin cutaneous melanoma; TCGA, The Cancer Genome Atlas.
Figure 2
Figure 2
DE-FRGs in SKCM tissue and normal skin tissue. (A) Heat map. N refers to normal skin tissues, and T refers to SKCM tissue. (B) Volcano map (red represents high expression, green means low expression and black represents no difference in expression). DE-FRGs, differentially expressed ferroptosis-related genes; FC, fold change; SKCM, skin cutaneous melanoma.
Figure 3
Figure 3
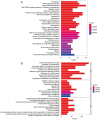
Enrichment analysis of DE-FRGs. (A) KEGG. (B) GO. BP, biological process; CC, cellular component; DE-FRGs, differentially expressed ferroptosis-related genes; GO, Gene Ontology; KEGG, Kyoto Encyclopedia of Genes and Genomes; MF, molecular function.
Figure 4
Figure 4
Interaction network of DE-FRGs. (A) PPI network. (B) Visualization circle diagram of the PPI network. Red represents up-regulated genes, and green represents down-regulated genes. Blue line segments represent genes with interaction relationships. DE-FRGs, differentially expressed ferroptosis-related genes; PPI, protein-protein interaction.
Figure 5
Figure 5
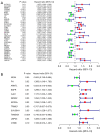
Screening of PR-FRGs and the construction of the risk model. (A) PR-FRGs were obtained by univariate Cox regression analysis. (B) PR-FRGs for constructing risk model obtained by multiple Cox regression analysis. CI, confidence interval; PR-FRGs, prognostically relevant ferroptosis-related genes.
Figure 6
Figure 6
Validation of the risk model in the training group. (A) Plot of risk scores. (B) Scatterplot of survival status. (C) Heat map of PR-FRGs distribution in the high and low-risk groups. (D) Kaplan-Meier curves for high and low-risk groups. (E) ROC curves for assessing risk model accuracy. (F) The ROC curve was used to evaluate the overall survival of SKCM patients at 1, 3, and 5 years. AUC, area under the ROC curve; PR-FRGs, prognostically relevant ferroptosis-related genes; ROC, receiver operating characteristic; SKCM, skin cutaneous melanoma.
Figure 7
Figure 7
Validation of the risk model in the validation group. (A) Plot of risk scores. (B) Scatterplot of survival status. (C) Heat map of PR-FRGs distribution in the high and low-risk groups. (D) Kaplan-Meier curves for high and low-risk groups. (E) ROC curves for assessing risk model accuracy. (F) The ROC curve was used to evaluate the overall survival of SKCM patients at 1, 3, and 5 years. AUC, area under the ROC curve; PR-FRGs, prognostically relevant ferroptosis-related genes; ROC, receiver operating characteristic; SKCM, skin cutaneous melanoma.
Figure 8
Figure 8
Correlation analysis of clinical traits. (A) Analysis of univariate Cox regression for clinical traits in the training group. (B) Analysis of multiple Cox regression for clinical traits in the training group. (C) Analysis of univariate Cox regression for clinical traits in the validation group. (D) Analysis of multiple Cox regression for clinical traits in the validation group. (E) ROC curves for clinical traits in the training group. (F) ROC curves for clinical traits in the validation group. AUC, area under the ROC curve; ROC, receiver operating characteristic.
Figure 9
Figure 9
Plotting of nomogram and calibration curves. (A) Nomogram was established to predict the 1-, 3- and 5-year OS of SKCM patients based on PR-FRGs expression and total score. (B) Calibration curve. OS, overall survival; PR-FRGs, prognostically relevant ferroptosis-related genes; SKCM, skin cutaneous melanoma.
Figure 10
Figure 10
Analysis of PR-FRGs expression. (A) The mRNA expression of PR-FRGs. (B) Representative immunohistochemistry images of FH, EGFR, GJA1, SESN2, KIF20A, TRIM21, TMSB4X, USP35, and CYBB in both normal skin tissue and skin cancer tissue sourced from the Human Protein Atlas database (https://www.proteinatlas.org/). Image credit goes to the Human Protein Atlas. The links to the individual normal and tumor tissues of each protein are provided for FH (https://www.proteinatlas.org/ENSG00000091483-FH/tissue/skin#img; https://www.proteinatlas.org/ENSG00000091483-FH/cancer/skin+cancer#img), EGFR (https://www.proteinatlas.org/ENSG00000146648-EGFR/tissue/skin#img; https://www.proteinatlas.org/ENSG00000146648-EGFR/cancer/skin+cancer#img), GJA1 (https://www.proteinatlas.org/ENSG00000152661-GJA1/tissue/skin#img; https://www.proteinatlas.org/ENSG00000152661-GJA1/cancer/skin+cancer#img), SESN2 (https://www.proteinatlas.org/ENSG00000130766-SESN2/tissue/skin#img; https://www.proteinatlas.org/ENSG00000130766-SESN2/cancer/skin+cancer#img), KIF20A (https://www.proteinatlas.org/ENSG00000112984-KIF20A/tissue/skin#img; https://www.proteinatlas.org/ENSG00000112984-KIF20A/cancer/skin+cancer#img), TRIM21 (https://www.proteinatlas.org/ENSG00000132109-TRIM21/tissue/skin#img; https://www.proteinatlas.org/ENSG00000132109-TRIM21/cancer/skin+cancer#img), TMSB4X (https://www.proteinatlas.org/ENSG00000205542-TMSB4X/tissue/skin#img; https://www.proteinatlas.org/ENSG00000205542-TMSB4X/cancer/skin+cancer#img), USP35 (https://www.proteinatlas.org/ENSG00000118369-USP35/tissue/skin#img; https://www.proteinatlas.org/ENSG00000118369-USP35/cancer/skin+cancer#img), and CYBB (https://www.proteinatlas.org/ENSG00000165168-CYBB/tissue/skin#img; https://www.proteinatlas.org/ENSG00000165168-CYBB/cancer/skin+cancer#img), respectively. Scale bar, 100 µm. PR-FRGs, prognostically relevant ferroptosis-related genes.

Similar articles

References

    1. Saginala K, Barsouk A, Aluru JS, et al. Epidemiology of Melanoma. Med Sci (Basel) 2021;9:63. 10.3390/medsci9040063 - DOI - PMC - PubMed
    1. Long GV, Swetter SM, Menzies AM, et al. Cutaneous melanoma. Lancet 2023;402:485-502. 10.1016/S0140-6736(23)00821-8 - DOI - PubMed
    1. Kim HJ, Kim YH. Molecular Frontiers in Melanoma: Pathogenesis, Diagnosis, and Therapeutic Advances. Int J Mol Sci 2024;25:2984. - PMC - PubMed
    1. Carlino MS, Larkin J, Long GV. Immune checkpoint inhibitors in melanoma. Lancet 2021;398:1002-14. 10.1016/S0140-6736(21)01206-X - DOI - PubMed
    1. Dimitrova M, Weber J. Melanoma-Modern Treatment for Metastatic Melanoma. Cancer J 2024;30:79-83. 10.1097/PPO.0000000000000707 - DOI - PubMed

LinkOut - more resources