Survival analysis of gastric malignancy patients: identifying key prognostic factors
- PMID: 40224985
- PMCID: PMC11985175
- DOI: 10.21037/tcr-24-1285
Survival analysis of gastric malignancy patients: identifying key prognostic factors
Abstract
Background: Gastric malignancies are common worldwide, with a high incidence rate and mortality. Relevant studies are needed to further demonstrate the harmfulness of gastric malignancies to promote awareness of its prevention. The aim of the study was to analyze the clinicopathological features and prognosis of gastric malignancies.
Methods: The Surveillance, Epidemiology, and End Results (SEER) database was used to obtain the clinical data of 122,793 patients diagnosed with gastric malignancies from 2000 to 2019. Along with performing univariate and multivariate analyses, the associated survival rates of each variable were analyzed using SPSS software. Columnar line graph prediction models were developed and validated using R software.
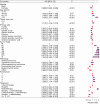
Results: In total, 122,793 gastric malignancy patients were included in this study, including 74,303 males (60.5%) and 48,490 females (39.5%). The predominant age group among patients was 60-74 years, comprising a total of 45,603 individuals (37.1%). The follow-up time was 0-239 months, the median follow-up time was 11.7 months, and 91,869 patients (74.8%) died. Gastric adenocarcinoma was the main pathological type, accounting for 96,259 patients (82.7%). The main disease site was the cardia of the stomach, accounting for 34,019 patients (34.0%); most (109,706; 89.3%) patients lived in cities. Univariate and multivariate analyses showed that gender, age, tumor size, tumor location, American Joint Committee on Cancer (AJCC) stage, pathological type, rural/urban, and treatment were independent risk factors for prognosis (P<0.001). The Concordance index (C-index) of the nomogram prognostic model was 0.763±0.002, and the areas under the receiver operating characteristic (ROC) curve (AUC) of the 1-, 3-, and 5-year survival rates were 0.76, 0.79, and 0.79, respectively. The calibration curve showed that the predicted survival rate of the nomogram was in good agreement with the observed survival rate.
Conclusions: The prognosis for tumors located in the greater curvature of the stomach is relatively favorable. The level of care available in a patient's city is directly correlated with their prognosis. Notably, the outcomes for gastric stromal tumors (GSTs) and gastric neuroendocrine neoplasms (G-NENs) are significantly more favorable compared to other pathological types. Patients who meet surgical criteria should undergo surgery as early as possible to enhance survival duration.
Keywords: Gastric malignancies; gastric neuroendocrine neoplasms (G-NENs); greater curvature; prognosis; survival.
Copyright © 2025 AME Publishing Company. All rights reserved.
Conflict of interest statement
Conflicts of Interest: All authors have completed the ICMJE uniform disclosure form (available at https://tcr.amegroups.com/article/view/10.21037/tcr-24-1285/coif). The authors have no conflicts of interest to declare.
Figures


Similar articles
-
[Establishment and validation of a nomogram to predict overall survival of patients with gastric neuroendocrine neoplasms].Zhonghua Wei Chang Wai Ke Za Zhi. 2021 Oct 25;24(10):883-888. doi: 10.3760/cma.j.cn.441530-20210716-00283. Zhonghua Wei Chang Wai Ke Za Zhi. 2021. PMID: 34674463 Chinese.
-
[Risk factors and nomogram construction for predicting long-term survival in hepatoid adenocarcinoma of the stomach].Zhonghua Wei Chang Wai Ke Za Zhi. 2025 Feb 25;28(2):157-168. doi: 10.3760/cma.j.cn441530-20240910-00312. Zhonghua Wei Chang Wai Ke Za Zhi. 2025. PMID: 39971567 Chinese.
-
Development of a Nomogram-Based Online Calculator for Predicting Cancer-Specific Survival in Patients With Digestive Tract Mixed Neuroendocrine-Non-Neuroendocrine Neoplasms (MiNENs): An Analysis of the SEER Database.Cancer Rep (Hoboken). 2025 Feb;8(2):e70156. doi: 10.1002/cnr2.70156. Cancer Rep (Hoboken). 2025. PMID: 39972644 Free PMC article.
-
[Prognostic value of a predictive model comprising preoperative inflammatory response and nutritional indexes in patients with gastric cancer].Zhonghua Wei Chang Wai Ke Za Zhi. 2023 Jul 25;26(7):680-688. doi: 10.3760/cma.j.cn441530-20221018-00415. Zhonghua Wei Chang Wai Ke Za Zhi. 2023. PMID: 37583026 Chinese.
-
Development and validation of a nomogram for predicting cancer-specific survival in small-bowel adenocarcinoma patients using the SEER database.World J Surg Oncol. 2024 Jun 7;22(1):151. doi: 10.1186/s12957-024-03438-x. World J Surg Oncol. 2024. PMID: 38849854 Free PMC article.
References
LinkOut - more resources
Full Text Sources
