. 2025 Mar 6:2025:8871619.
doi: 10.1155/anrp/8871619. eCollection 2025.

Thromboelastography Reference Values for Third-Trimester Healthy Obstetric Patients in Northern Mexico

Affiliations

Thromboelastography Reference Values for Third-Trimester Healthy Obstetric Patients in Northern Mexico

S Alvarado-Ramos et al. Anesthesiol Res Pract. .

Abstract

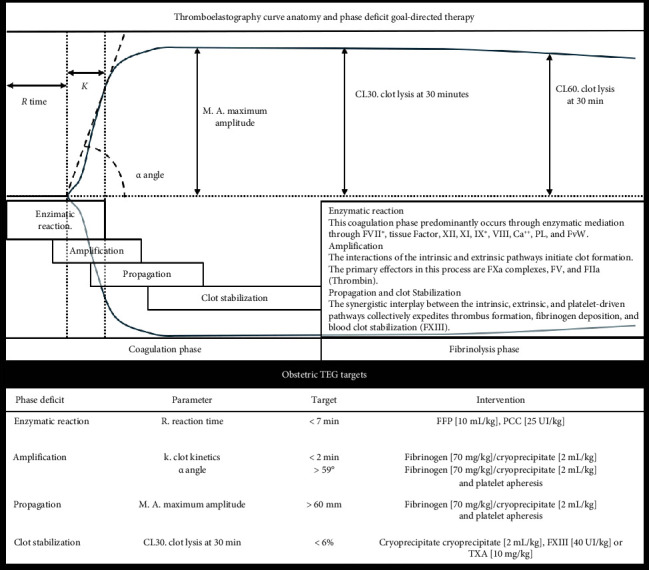
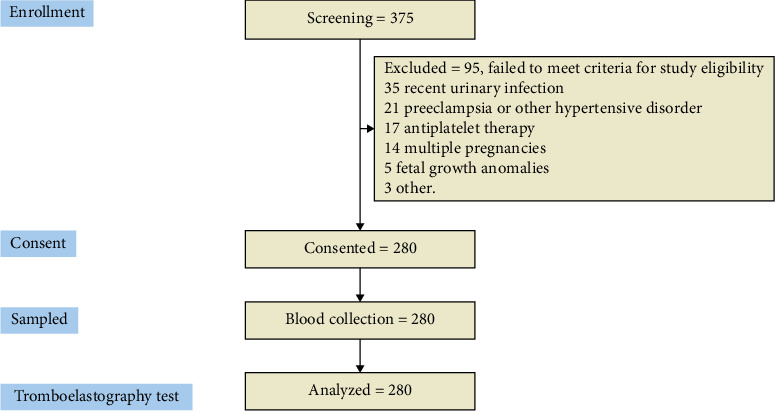
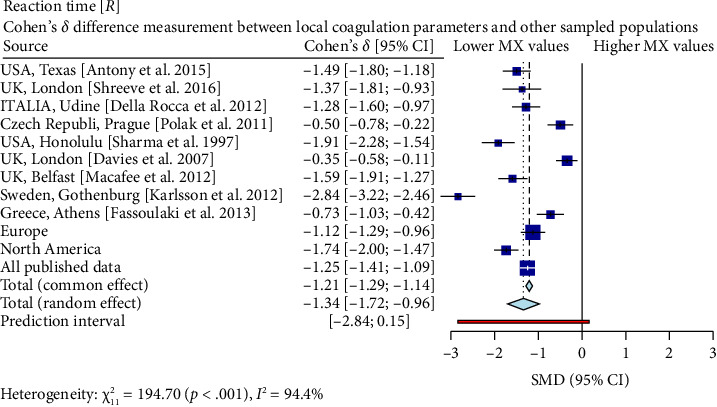
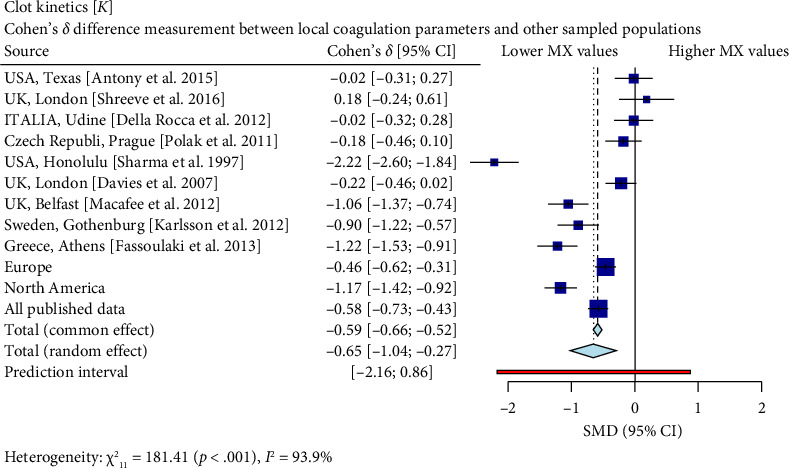
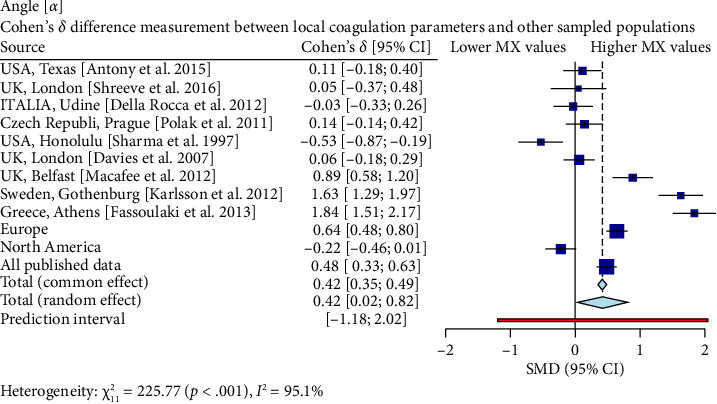
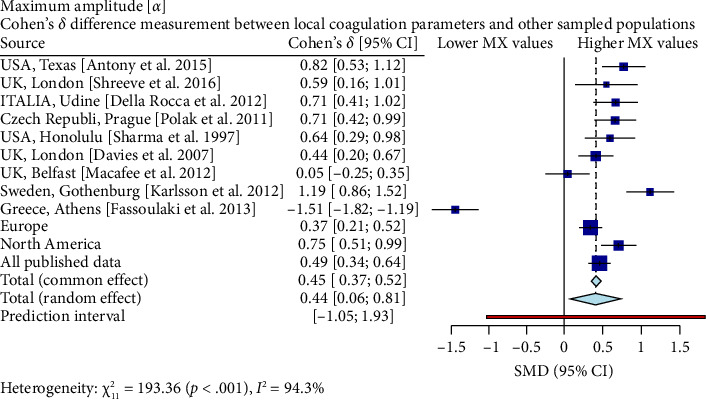
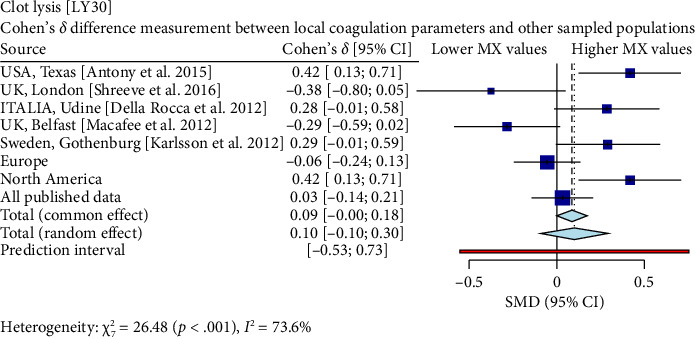
Objective: This prospective, descriptive, cross-sectional study aimed to establish kaolin-based thromboelastography reference values for previously known healthy third-trimester pregnancy patients. Methods: The study included 280 patients aged 18-38 years who were admitted to labor or scheduled for elective c-sections. Blood specimens collected via IV catheters were immediately mixed with reagents, placed in coagulation cups, and subjected to 60 min of testing at 37°C using a Haemonetics TEG 5000 system. The Hoffman regression method calculated the reference values; furthermore, effect size determination was done using Cohen's δ for comparison of data from other sources. Results: Patients had a median age of 26 (IQR 22-31), and their thromboelastography profile exhibited reference values for: R time (1-7 min), clot kinetics (1-2), angle (59°-82°), maximum amplitude (60-86 mm), and clot lysis at both 30 min (0%-6%) and 60 min (0%-8%). Results revealed significant differences in various thromboelastography parameters when comparing local patient cohorts against published reports, mainly European and North American counterparts. Shorter reaction times, enhanced clot kinetics, larger angles, and higher maximum amplitude, curve amplitude at 30 min, and amplitude at 60 min indicated distinct coagulation profiles and behaviors in the northeastern region of Mexico. Conclusion: Reference values for the Northern region of Mexico have been calculated and are characterized by a shorter clot reaction time, faster clot dynamics, higher angle values, overall greater curve amplitude, and no differences in enzymatic lysis activity compared to samples from other geographic regions.

Keywords: coagulation; goal-directed therapy; obstetric hemorrhage; reference values; thromboelastography; viscoelastic analysis.


Conflict of interest statement

The authors declare no conflicts of interest.

Figures

Figure 1
Figure 1
The following figure illustrates the primary sections of the thromboelastography (TEG) curve alongside their associations with the stages of the blood coagulation cascade and the predominant coagulation factors involved at each stage. A closer examination reveals that the initial phases are mediated by enzymatic activity (reaction time, R), followed by a latent period characterized by limited thrombin generation, moderate fibrinogen deposition, and restricted platelet activation (kinetik time, k). The clot formation features an accelerated rate of fibrinogen and platelet deposition (α angle), which coincides with enhanced platelet activation and increased enzymatic activity generated from Factor Xa complexes via the intrinsic pathway. Ultimately, clot mechanical properties stabilize because of the depletion of substrates necessary for clot formation and diminished enzymatic activity 1–3. Integrating TEG into our clinical workflow facilitates rapid decision-making within 15 min concerning the status of each phase of blood coagulation. Moreover, we integrate obstetric parameters from our study's dataset, correlating them with their respective phases. In addition, therapeutic goals and recommended hemoderivative products are carefully annotated on the accompanying visual element for each section. FFP, fresh frozen plasma; PCC, prothrombin complex concentrate; FXIII, factor XIII; TXA, tranexamic acid. (1). Shaydakov M.E., Sigmon D.F., Blebea J. Thromboelastography; 2024. https://www.ncbi.nlm.nih.gov/pubmed/23543966. (2). Hoffman M., Monroe D.M.. A cell-based model of hemostasis. Thromb Haemost. 2001; 85 (6): 958–965. doi:10.1055/s-0037-1615947. (3). Jeong Y.H., Kevin B., Ahn J.H., et al. Viscoelastic properties of clot formation and their clinical impact in East Asian versus Caucasian patients with stable coronary artery disease: a COMPARE-RACE analysis. J Thromb Thrombolysis. 2021; 51 (2):454–465. doi:10.1007/s11239-020-02240-2.
Figure 2
Figure 2
STROBE flowchart. STROBE, strengthening the reporting of observational studies in epidemiology.
Figure 3
Figure 3
This diagram displays Cohen's d different measurements of coagulation reaction times between our regional sample and several international ones. Negative coefficients indicate a substantial difference between the Mexican sample and the respective study group, with the Mexican coagulation parameters exhibiting faster reaction times (except for the UK-London study by Davies, Fernando, and Hallworth). When grouping data geographically, European studies collectively present a moderate difference (δ = −1.12, p < 0.001), signifying quicker Mexican coagulation reactions. North American investigations, excluding Hawaii, yield a considerable mean Cohen's d score (δ = −1.77, p < 0.001), further supporting this trend. Finally, considering all available published data, the overall Cohen's d is −1.34, confirming faster coagulation reactions in Mexico than previously reported global findings.
Figure 4
Figure 4
When comparing our findings with those reported in Texas, there was no significant difference between the two populations (δ = −0.024). However, marked disparities were observed when contrasting our samples with other geographical areas like the United Kingdom-London (δ = 0.22), Sweden (δ = −0.9), Greece (δ = −0.1.22), aggregated data from Europe (δ = −0.46), North America (δ = −1.17), and all published data (δ = −0.58). It is essential to highlight that the comparison against Sharma et al.'s sample from Honolulu yielded particularly striking results, with a noticeably significant Cohen's δ value of −2.22. Accordingly, these findings highlight variations among different geographical locations, which may have implications for diagnostic and therapeutic strategies in managing hemostatic abnormalities during pregnancy. It should be noted, however, that most of these comparisons show small or medium effects sizes according to Cohen's classification scheme, thus indicating only moderate deviation between groups.
Figure 5
Figure 5
A total of 10 datasets from different geographical locations, including North America and Europe, were included in our analysis. The results indicated that there was no significant difference in the TEG curve angle of the aperture between third-trimester Mexican women and their counterparts in Texas (the United States) (δ = 0.11), Czech Republic (δ = 0.1T), or Northern America as a whole (δ = −0.22). However, compared to samples from Italy [20], London (the United Kingdom) [19, 23], or other European samples (δ = 0.64), Mexican women had significantly higher values, with large and substantial effect sizes, respectively. These findings suggest that the TEG curve angle of aperture in Mexican third-trimester pregnant women is considerably higher than previously reported in many other populations, potentially indicating differences in coagulation patterns between these groups.
Figure 6
Figure 6
The Cohen's d effect sizes revealed that there was a significantly higher TEG maximum curve aperture between Mexican third-trimester women and those from the United States, Texas (δ = 0.82); Italy, Udine (δ = 0.71); Czech Republic, Prague (δ = 0.71); the United States, Honolulu (δ = 0.64); the United Kingdom, London (δ = 0.44); North America as a whole (δ = 0.75); and all published global data pooled together (δ = 0.46). The most prominent effects of these comparisons were noted in the contrasts involving Mexico and Sweden (δ = 1.19) and Mexico and Greece (δ = −1.51). Conversely, no substantial difference occurred in the case of the comparison between Mexico and Northern Ireland-Belfast (δ = 0.05).
Figure 7
Figure 7
Only one site displayed a moderate effect size, which corresponds to the the United States, Texas, sample by Antony et al. (δ = 0.42). In contrast, a small effect size was observed at three sites: Italy; the United Kingdom, London; and Sweden, Gothenburg, where the clot lysis times among these European and Scandinavian samples slightly differed but remained comparable to the Mexican population. Two additional sites showed minor effect sizes: The United Kingdom, Belfast, sample provided by Macafee et al. had a negative value (δ = −0.29), implying moderately shorter clot lysis periods in Mexican participants, whereas the combined European dataset yielded negligible difference (δ = −0.06). Lastly, the entire collection of published data demonstrated minimal dissimilarity when assessed against the Mexican sample (δ = 0.032).

Similar articles

References

    1. Katz D., Beilin Y. Management of Post-Partum Hemorrhage and the Role of the Obstetric Anesthesiologist. Journal of Maternal-Fetal and Neonatal Medicine . 2021;34(9):1487–1493. doi: 10.1080/14767058.2019.1638360. - DOI - PubMed
    1. Lumbreras-Marquez M. I., Villela-Franyutti D., Reale S. C., Farber M. K. Coagulation Management in Obstetric Anesthesia. Current Anesthesiology Reports . 2022;12(2):266–276. doi: 10.1007/s40140-022-00517-1. - DOI
    1. Serraino G. F., Murphy G. J. Routine Use of Viscoelastic Blood Tests for Diagnosis and Treatment of Coagulopathic Bleeding in Cardiac Surgery: Updated Systematic Review and Meta-Analysis. British Journal of Anaesthesia . 2017;118(6):823–833. doi: 10.1093/bja/aex100. - DOI - PubMed
    1. Kaufmann C. R., Dwyer K. M., Crews J. D., Dols S. J., Trask A. L. Usefulness of Thrombelastography in Assessment of Trauma Patient Coagulation. The Journal of Trauma, Injury, Infection, and Critical Care . 1997;42(4):716–722. doi: 10.1097/00005373-199704000-00023. - DOI - PubMed
    1. Whiting D., DiNardo J. A., Whiting D., Dinardo J. A. TEG and ROTEM: Technology and Clinical Applications. American Journal of Hematology . 2014;89(2):228–232. doi: 10.1002/ajh.23599. - DOI - PubMed

LinkOut - more resources