. 2025;18(4):330-336.
doi: 10.1038/s41561-025-01666-8. Epub 2025 Apr 4.

Soil moisture gradients strengthen mesoscale convective systems by increasing wind shear

Affiliations

Soil moisture gradients strengthen mesoscale convective systems by increasing wind shear

Emma J Barton et al. Nat Geosci. 2025.

Abstract

Mesoscale convective systems are a class of storm linked to extensive flooding and other destructive hazards in many regions globally. In West Africa, soil moisture impacts provide a valuable source of predictability for mature storm hazards, but little is known about mature storm sensitivity to soil moisture in other climatic regions. Here we use a storm track dataset, satellite observations and reanalysis fields to investigate the response of mature storms to soil moisture in seven global storm hotspots-West Africa, India, South America, South Africa, Australia and the United States Great Plains. We demonstrate that mesoscale soil moisture gradients (~500 km) can enhance storms by driving increased vertical wind shear conditions, a crucial ingredient for storm organization, through the strengthening of atmospheric temperature gradients. This is evidenced by a 10-30% increase in precipitation feature size and rainfall for the largest storms on days with favourable soil moisture gradients compared with unfavourable gradients. Global simulations confirm that soil moisture gradients influence wind shear. The results demonstrate the importance of soil moisture feedbacks for accurate forecasting of mesoscale convective systems and future projections of extreme events under climate change.

Keywords: Atmospheric dynamics; Natural hazards.


Conflict of interest statement

Competing interestsThe authors declare no competing interests.

Figures

Fig. 1
Fig. 1. Global overview of mesoscale convective systems and pre-storm environment.
a, Distribution of wet season MCS cases (colours) and season mean 650-hPa driving winds (black arrows). Wet season denotes May–September and November–March for the Northern and Southern Hemispheres, respectively. Red boxes highlight the study regions. Red arrows indicate the dominant zonal storm propagation direction. b,c, Scatter plots of regional mean pre-MCS conditions. Crosses represent MCS day conditions; circles denote climatology (clim.). Dashed gradient lines represent individual region linear regressions with correlation coefficients provided in the legends (* and ** indicate significance at the 95% and 99% levels, respectively). b, Poleward 925-hPa atmospheric Tgrad versus zonal shear. c, Poleward SMgrad versus zonal shear. Zonal shear is calculated between levels 650 hPa and 100 m. How the observed (ERA5) zonal shear relates to theoretical thermal wind is presented in Supplementary Fig. 6.
Fig. 2
Fig. 2. Impact of zonal shear environment on wet season MCS characteristics (largest precipitation feature, PF1) across all regions.
a, Line plot of mean normalized PF1 area in regular zonal shear bins (low to high). b, Line plots of 95th percentile normalized PF1 raintot in regular zonal shear bins (low to high) for low (red), intermediate (yellow) and high (blue) TCW. c, Line plot of mean raintot per unit area (PUA) (mm km2 h−1 per km2) in regular zonal shear bins (low to high). Data in ac are presented as mean values ± 95th percentile confidence intervals (n = 7 regions). Variables in a,b are normalized for each region by expressing the value as a fraction of the largest value for that region (Methods). Absolute values for each region (including shear ranges and TCW subsets) are presented in Supplementary Fig. 7. Data points in b have been plotted with an x-axis offset to aid visualization of error bars. Zonal shear is calculated between levels 650 hPa and 100 m.
Fig. 3
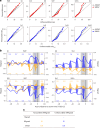
Fig. 3. Differences between the wet-season MCS characteristic (PF1) distributions and temporal evolution of atmospheric and surface variables for favourable and unfavourable soil moisture gradient anomalies in four regions.
a, Quantile–quantile (Q–Q) plots comparing 5th to 95th (in steps of 5) percentile values of PF1 area × 103 (km2) (i–iv) and total rainfall (m km2 h−1) (raintot, v–viii) for favourable and unfavourable SMAgrad subsets defined using SMAP (coloured) or ASCAT (grey). Differences in the favourable and unfavourable distributions are indicated by deviation from the 1:1 line (black). Absolute and percentage differences in the percentile values for SMAP are shown in Supplementary Fig. 8. Favourable refers to SMAgrad that enhances shear in the direction of MCS propagation. b, Subset mean diurnal cycles of poleward sensible HAgrad W m−2, bars) and poleward atmospheric TAgrad anomalies (K) for favourable (blue) and unfavourable (orange) SMAgrad subsets (SMAP). Annotations quantify the subset mean daily average 650 hPa–100 m zonal shear anomaly (shearA) (m s−1), where positive values indicate an enhancement of shear in the direction of MCS propagation. Grey shading highlights storm day. c, Legend for b. Hgrad anomalies (vertical bars), Tgrad anomalies (soild lines) and shear anomalies (number annotations) for the favourable and unfavourable SMAgrad subsets (SMAP) are represented by blue and orange colours, respectively. The spatial and temporal distributions of cases in the favourable and unfavourable SMAgrad subsets for each region are presented in Supplementary Fig. 13.
Fig. 4
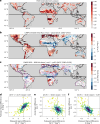
Fig. 4. Shear sensitivity to SM gradients (SMgrad) globally.
a, Maximum r2 for inter-annual monthly correlations (r) between meridional SMgrad and zonal wind shear (ERA5, 1980–2020). Only pixels with significant (P < 0.05) shear correlation with SMgrad and Hgrad are shown. b,c, Average future differences (ΔFUT, 2080–2100) for five CMIP6 LS3MIP models between experiments using prescribed future climatological SM (rmLC) and prescribed historical climatological SM (pdLC) for the resulting H flux (W m−2) (b) and wind shear (m s−1) (c). Oceans and pixels where no model shows agreement between signs of H flux and temperature changes are grey. Stippling in b indicates pixels where H flux and temperature changes agree in sign for all CMIP6 models, that is, where flux and temperature changes are consistent. Purple contours show absolute H change (4–8 W m−2 lines) from b, for comparison. df, Scatter plots illustrating the ΔFUT relationships for Hgrad differences (W m−2 deg−1) with the co-located poleward Tgrad differences (d), Hgrad (W m−2 deg−1) differences versus zonal wind shear (m s−1) differences (e) and Tgrad differences versus zonal wind shear differences versus Hgrad (W m−2 deg−1) (e) and Tgrad differences versus zonal wind shear differences (f) in MCS hotspot regions (dotted rectangles in ac) for the five CMIP6 models. Only land pixels where signs of H and temperature changes agree are included. The data in af were calculated within extended rainy seasons for the respective hemisphere (North/South split).

References

    1. Zipser, E. J., Cecil, D. J., Liu, C., Nesbitt, S. W. & Yorty, D. P. Where are the most intense thunderstorms on Earth? Bull. Amer. Meteor. Soc.87, 1057–1072 (2006).
    1. Schumacher, R. S. & Rasmussen, K. L. The formation, character and changing nature of mesoscale convective systems. Nat. Rev. Earth Environ.1, 300–314 (2020).
    1. Roca, R. & Fiolleau, T. Extreme precipitation in the tropics is closely associated with long-lived convective systems. Commun. Earth Environ.1, 18 (2020).
    1. Laing, A. G. & Fritsch, J. M. The large-scale environments of the global populations of mesoscale convective complexes. Mon. Weather Rev.128, 2756–2776 (2000).
    1. Chen, X., Leung, L. R., Feng, Z. & Yang, Q. Environmental controls on MCS lifetime rainfall over tropical oceans. Geophys. Res. Lett.50, e2023GL103267 (2023).

LinkOut - more resources