. 2024 Dec 9;10(3):877-891.
doi: 10.1016/j.ekir.2024.12.006. eCollection 2025 Mar.

Trio Exome Sequencing in VACTERL Association

Affiliations

Trio Exome Sequencing in VACTERL Association

Jasmina Ćomić et al. Kidney Int Rep. .

Abstract

Introduction: Currently, there is only limited data on monogenic causes of vertebral defects, anorectal malformations, cardiac defects, esophageal atresia or tracheoesophageal fistula, renal malformations, and limb defects (VACTERL) association. The aim of this study was to extend the spectrum of disease-causing variants in known genes, to determine the diagnostic yield of monogenic causes, and to identify candidate genes and rare variants by applying comprehensive genetic testing or rare variant burden.

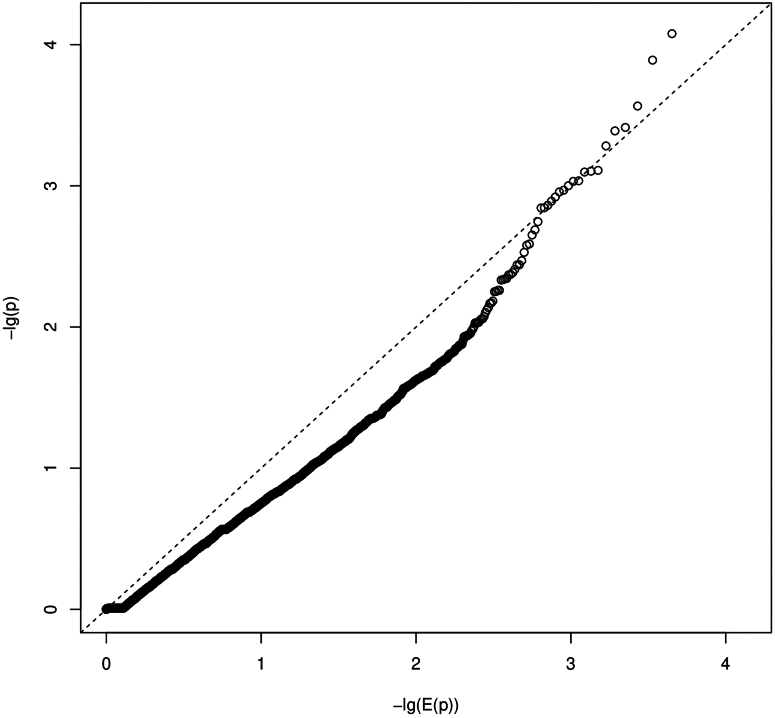
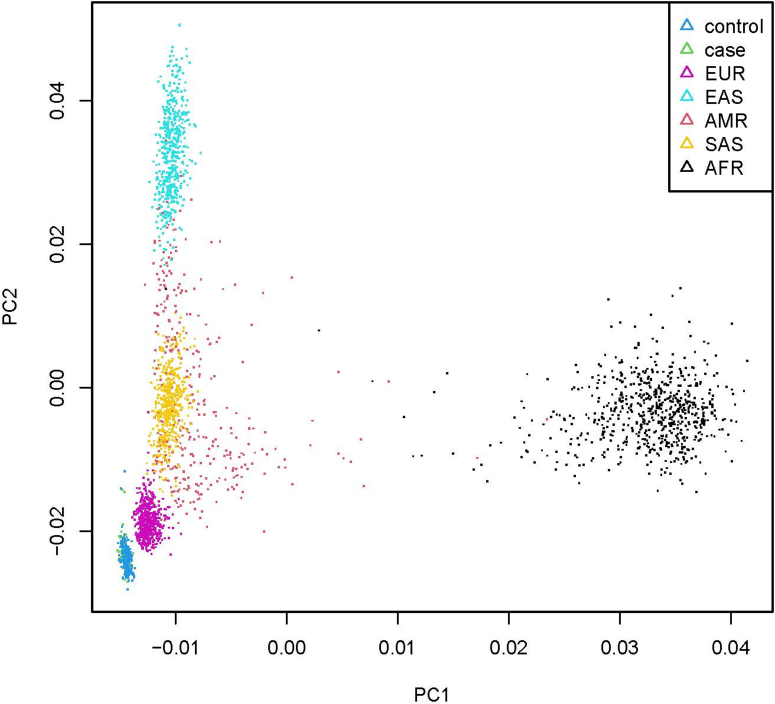
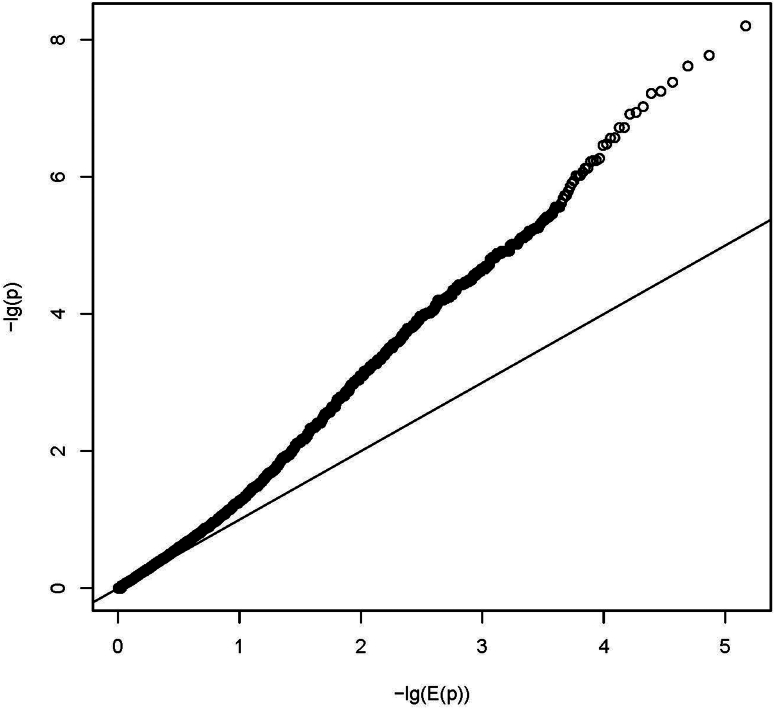
Methods: The total cohort comprised 101 affected individuals and their parents. Trio exome sequencing was only performed in 96 individuals and their parents because of DNA quality reasons and case-control gene and pathway burden tests were calculated and evaluated by quantile-quantile plots, principal component analysis plots and family-based association test (FBAT).

Results: In 5 of 96 individuals, disease-causing variants in known genes or loci were identified to be associated with the following 4 disorders: Kabuki syndrome, Sotos syndrome, MELAS syndrome, and deletion syndrome encompassing TWIST1. In 91 individuals, no disease-causing variants were found. FBAT showed 14 significant variants, 2 significant genes (LOC645752 and ZNF417), and 8 significant pathways.

Conclusion: This study shows that most individuals with VACTERL association do not have known discrete genetic syndromes, implying that pathomechanisms or variants not identifiable by exome sequencing may exist requiring further investigation.

Keywords: VACTERL association; VACTERL-like phenotype; ZNF417; burden test; exome sequencing; mitochondriopathy.


Figures

None
Graphical abstract
Figure 1
Figure 1
Flow chart of the study cohort. This figure was created with the free web-based tool SankeyMATIC (http://sankeymatic.com/build/). VACTERL/VATER, (V) vertebral defects, (A) anorectal malformations (ARM), (C) cardiac defect, (TE) tracheoesophageal fistula with or without esophageal atresia, (R) renal malformations, (L) limb defects.
Figure 2
Figure 2
Distribution of 98 non-synonymous de novo variants in 97 different genes.
Figure 3
Figure 3
Quantile-quantile plot (QQ-plot) for gene burden. The plot shows the distribution of the sorted P-values from data analysis against the expected uniform distribution. −lg(E(P)): expected −log10P-values; −lg(P): observed −log10P-values.
Figure 4
Figure 4
Quantile-quantile plot (QQ-plot) for pathway burden. The plot shows the distribution of the sorted P-values from data analysis against the expected uniform distribution. −lg(E(P)): expected −log10P-values; −lg(P): observed −log10P-values.
Figure 5
Figure 5
PCA plot of VACTERL individuals and control individuals compared with the 1000 genomes sample.There is a single cluster for combined cases and controls, which maps close to the EUR cluster of 1000 genomes samples. PCA, principal component analysis.
Figure 6
Figure 6
Quantile-quantile plot (QQ-plot) for gene burden on FBAT analysis. The plot shows the distribution of the sorted P-values from data analysis against the expected uniform distribution. −lg(E(P)): expected −log10P-values; −lg(P): observed −log10P-values.
Figure 7
Figure 7
Quantile-quantile plot (QQ-plot) for pathway burden on FBAT analysis. The plot shows the distribution of the sorted P-values from data analysis against the expected uniform distribution. −lg(E(P)): expected −log10P-values; −lg(P): observed −log10P-values.
Figure 8
Figure 8
Quantile-quantile plot (QQ-plot) summary on FBAT analysis. The plot shows the distribution of the sorted P-values from data analysis against the expected uniform distribution. −lg(E(P)): expected −log10P-values; −lg(P): observed −log10P-values.

References

    1. Solomon B.D. The etiology of VACTERL association: current knowledge and hypotheses. Am J Med Genet C. 2018;178:440–446. doi: 10.1002/ajmg.c.31664. - DOI - PubMed
    1. Solomon B.D. VACTERL /VATER Association. Orphanet J Rare Dis. 2011;6:56. doi: 10.1186/1750-1172-6-56. - DOI - PMC - PubMed
    1. Kolvenbach C.M., van der Ven A.T., Kause F., et al. Exome survey of individuals affected by VATER/VACTERL with renal phenotypes identifies phenocopies and novel candidate genes. Am J Med Genet A. 2021;185:3784–3792. doi: 10.1002/ajmg.a.62447. - DOI - PMC - PubMed
    1. van de Putte R., de Walle H.E.K., van Hooijdonk K.J.M., et al. Maternal risk associated with the VACTERL association: A case-control study. Birth Defects Res. 2020;112:1495–1504. doi: 10.1002/bdr2.1773. - DOI - PMC - PubMed
    1. Kim P.C., Mo R., Hui Cc C. Murine models of VACTERL syndrome: role of sonic hedgehog signaling pathway. J Pediatr Surg. 2001;36:381–384. doi: 10.1053/jpsu.2001.20722. - DOI - PubMed

LinkOut - more resources