Review
. 2025 Mar 24;15(10):4734-4762.
doi: 10.7150/thno.107025. eCollection 2025.

Nanocatalytic system releases overloaded zinc ions and ROS to induce Znproptosis and interrupt cell cycle through inhibiting Akt/mTOR pathway

Affiliations
Review

Nanocatalytic system releases overloaded zinc ions and ROS to induce Znproptosis and interrupt cell cycle through inhibiting Akt/mTOR pathway

Zi-Yue Xi et al. Theranostics. .

Abstract

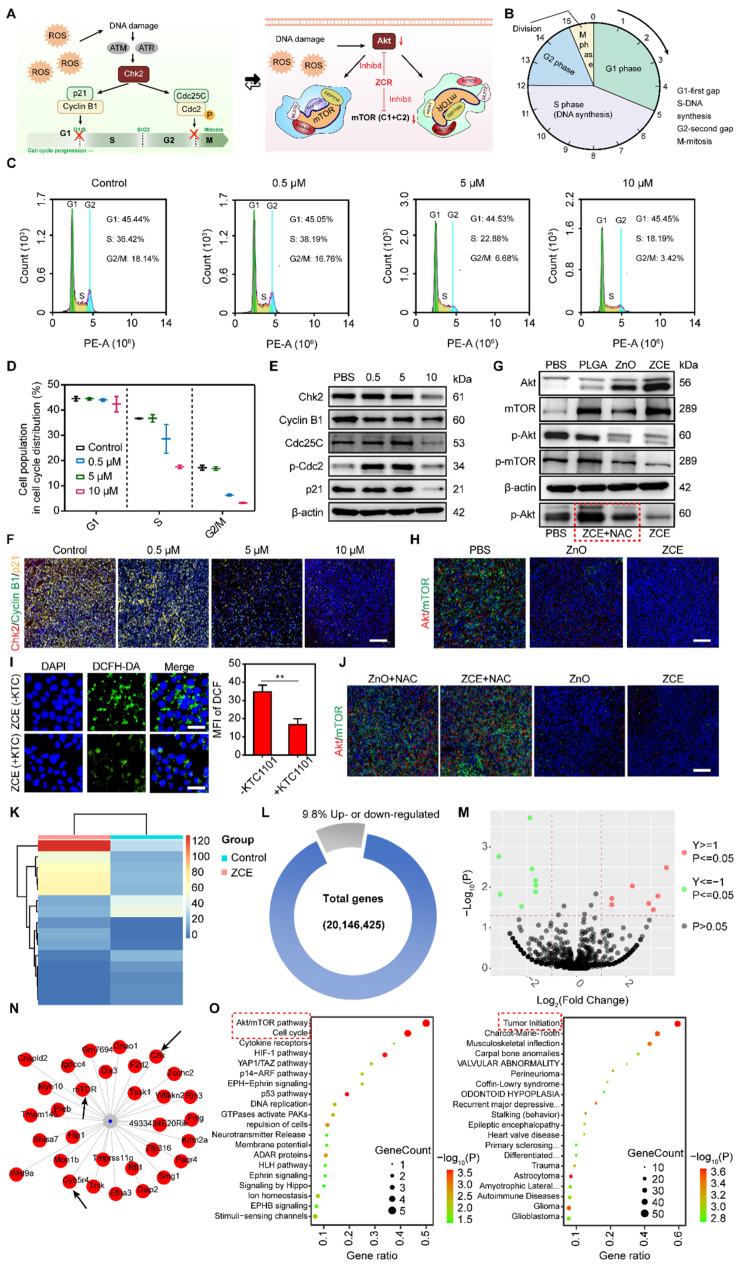
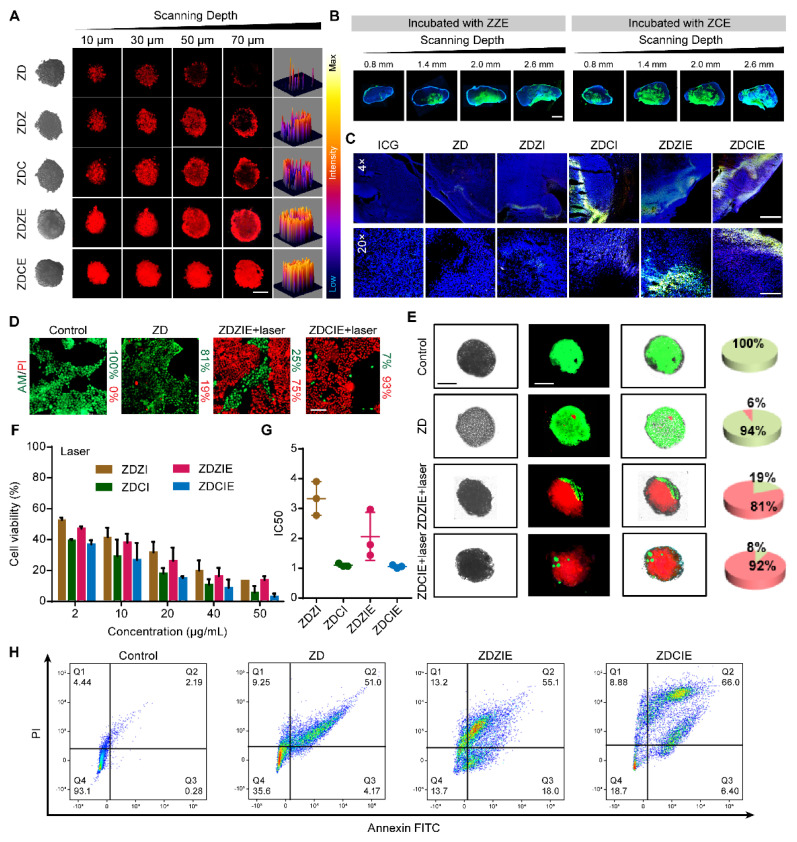
Background: Traditional programmed cell death, including ferroptosis, cuproptosis, and apoptosis, has demonstrated excellent anti-tumor effects and declared their complete mechanisms, however, the zinc ion-mediated tumor inhibiting mechanisms remain insufficiently explored. In this study, a self-generated oxygen nanocatalytic system (ZnO@COF@EM, ZCE) was developed to stimulate cascade amplified effect (CAE) of reactive oxygen species (ROS) generation leading to Znproptosis. The underlying Znproptosis mechanism to disrupt mitochondrial (Mito) metabolism was also investigated. Methods: Specifically, the principle of Znproptosis caused by accumulated zinc and ROS, which served as key factors, was declared through western blot analysis and genetic testing. The mechanism of generated ROS (·OH and 1O2) under NIR irradiation by ZCE was detected by UV scanning curves, confocal laser scanning microscopy (CLSM) images, and density functional analysis. The injury condition of Fe-S protein of mitochondria metabolism, which triggered Znproptosis with FDX2/LIAS pathway by zinc and ROS, was examined by PCR test and MTT assay. Notably, a Mito-targeting strategy for ZCE was proposed by using molecular docking technology, wherein Zn2+ was recognized by zinc finger proteins (ZFPs) with the Mito. Results: ZCE, along with CAE, produced abundant ROS (2.42-time more than control group). At the quantum chemical level, the CAE mechanism was associated with a narrower highest occupied molecular orbital-lowest unoccupied molecular orbital (HOMO-LUMO) gap and increased electronic energy motion within ZCE, which prolonged the excited triplet state (ETS). At the gene level, Znproptosis was achieved by regulating FDX2 and ZIP7 proteins to damage Fe-S protein. The cell cycle was interrupted by Chk2/Cdc25C/Cdc2 and Chk2/p21/Cyclin B1 pathways, leading to the arrest of G1/S and G2/M phases of the cell cycle and inhibition of the Akt/mTOR signaling pathway. Moreover, Znproptosis induced by overloading zinc ions and ROS resulted in a significant antitumor effect (up to 83.81%). Conclusion: Hence, the research reveals a detailed Znproptosis mechanism in nanocatalytic system. Through regulating FDX2/LIAS pathway, Znproptosis could improve the death rate of mitochondria by decreasing the production of Fe-S protein, contributing to advancements in the field of antitumor therapy.

Keywords: Akt/mTOR pathway; FDX2/LIAS pathway; Znproptosis; cascade amplificated effect; nanocatalyst.


Conflict of interest statement

Competing Interests: The authors have declared that no competing interest exists.

Figures

Scheme 1
Scheme 1
Schematic nanocatalytic system as a ROS generator with CAE for Znproptosis. (A) Formation and activation of ZDCIE. (B) Through effective endocytosis process, ZCE decomposition for inducing ROS, promoting dysfunctional Mito, arresting cell cycle and inhibiting Akt/mTOR pathway in cancer cell, triggering Znproptosis ultimately.
Figure 1
Figure 1
Characterization of NPs. (A) 1H NMR spectra of COF; (B) FTIR spectra of ZnO, ZZ and ZC; (C) Different composed fractions distribution of ZZE and ZCE; (D) TEM images of ZnO, ZZ and ZC. Scale bar is 300 nm; and Cyro-TEM images of EM, ZZE and ZCE (The red rows are labeled the EM films). Scale bar is 100 nm. (E) The sizes and (F) zeta potentials of NPs; (G) The HRTEM images of ZCE and elemental mapping images of C, N, O and Zn. Scale bar, 5 nm and 500 nm. (H) SDS-PAGE analysis of EM, ZCE, ZC, ZZE, ZZ and ZnO; (I) XRD patterns of ZnO, ZZ and ZC; (J) XPS patterns of ZZ and ZC; (K) The CLSM images of ZZ, ZE and (L) ZC, CE, red, RITC-labeled; green, FITC-labeled. Scale bar, 1 μm; (M) UV-vis spectra of DOX, ICG, and prepared NPs.
Figure 2
Figure 2
In vitro self-oxygen generating capacity and ROS generation mechanism studies. (A) Absorbance changes of methylene blue incubated with NPs with or without laser irradiation for 10 min; (B) Absorbance changes of DPBF incubated with ZDCIE with or without l/H (laser/H2O2 (40 μM)); (C) UV-vis spectroscopy of DPBF incubated with ZDCIE with laser irradiation for 0, 2, 4, 6, 8 and 10 min; (D) O2 generation images of NPs; (E) O2 concentration changes of NPs; (F) O2 concentration changes of ZZE solutions after incubated with various concentrations of H2O2; ESR spectra for detection of ·OH (G)and 1O2 (H) in different conditions by DMPO. (I) Schematic illumination of mechanism for ZCE to produce O2 and ROS; (J) The produced progress of active ·OH by the interaction between COF and Zn. (K) Energy changing curves during the catalytic process. (L) Normalized EXAFS of Zn K-edge spectra (E-space); (M) k3χ(k) space spectra fitting curve of Zn foil, ZnO, and ZCE (k-space), and (N) Fourier transforms of k3-weighted Zn K-edge EXAFS spectra (R-space); FT-EXAFS fitting curves at R space of Zn foil (O), ZnO (P) and ZCE (Q); (R) WT-EXAFS plots of Zn-foil, ZnO and ZCE. The data are presented as means ± SD, n = 3, *p < 0.05, **p < 0.01 and ***p < 0.001.
Figure 3
Figure 3
Overcoming extracellular sequential barriers. (A) The images and (B) quantitative data for depth of penetration in the stimulate ECM. (C) The values of MSD as a function of time scale. The data represent experiments in which 200 NPs were tracked. (D) The trajectories of NPs on a time scale of 1 s; The group was same with (C). (E) Distributions of the logarithmic Deff values of NPs in the simulated ECM; The group was same with (C); (F) Cell viabilities of different NPs. (G) CLSM images of the internalized of NPs in 4T1 cells under normal and hypoxia atmosphere. Blue, nuclei stained with DAPI. Red, RITC-labeled NPs. Scale bars, 20 μm; Flow cytometry (FCM) analysis on the cell uptake at normal atmosphere (H), cell uptake at hypoxia atmosphere (I) and (J) cell uptake mechanism. (K) CLSM images of the endocytosis of NPs in 4T1 cells pretreated with CPZ, FLP, DNS and AMI. Scale bar, 50 μm. (L) Schematic illustration of transported route for NPs after endocytosis. The data are presented as means ± SD, n = 3, *p < 0.05, **p < 0.01 and ***p < 0.001.
Figure 4
Figure 4
Destroying of Mito. (A) Scheme of trafficking route for NPs to kill cancer cells; (B) CLSM images of NPs (red) incubated with the mitochondria (green) of 4T1 cells. Scale bar, 5 μm; (C) Molecular docking between ZCE and zinc-finger proteins (ZFPs). (D) Intracellular ROS detected with DCFH-DA in 4T1 cells incubated with NPs for 4 h with laser irradiation. Scale bar, 20 μm; (E) ROS penetration detected with DCFH-DA into the tumor tissue under hypoxic conditions. Scale bar, 50 μm. (F) Qualification of 1O2 detected with SOSG incubated with NPs with laser irradiation in cancer cells. (G) Western blot analysis of proteins. I, ZnO; II, ZZ; III, ZC; IV, ZZE; V, ZCE. (H) Molecular docking between ZCE and Bax/Bcl-2/CHOP proteins. (I) The CLSM images of mitochondria membrane potential with JC-1 kit; Scale bar, 20 μm. (J) Bio-TEM of 4T1 cells after incubated with NPs (red arrow labels represent mitochondria). The data are presented as means ± SD, n = 3, *p < 0.05, **p < 0.01 and ***p < 0.001.
Figure 5
Figure 5
Mechanisms of Znproptosis. (A) Western blot analysis of ZCE or 10 mM bortezomib for 6 h and under irradiation for 5 min. (B) Caspase 8 cleavage in 4T1 cells after indicted treatments. (C) Cell viability of 4T1 cells or two clones with Bax/Bak deleted after treatment with ZCE and DOX under irradiation for 5 min. (D) Heatmap of viability of cells pretreated overnight with different inhibitors and then treated with samples for 72 h (average of three replicates). (E) Cell viability in media containing either glucose or galactose treated with ZCE under irradiation for 5 min. (F) Heatmap of viability of cells pretreated overnight with different Mito inhibitors and then treated with samples for 72 h (average of three replicates). (G) Genetic screening using RNA-sequence analysis in 4T1 cells of Znproptosis. (H) Bar plot enrichment of P-value and (I) network for signaling pathways. (J) Western blot analysis of ZCE for 6 h and under irradiation for 5 min. (L) Cell viability of 4T1 cells or two clones with FDX2 deleted after treatment with ZCE under irradiation for 5 min. (L) CLSM images of expression of ZIP-7 after incubated with ZCE. Scale bar, 10 μm, enlarge, 5 μm. (M) Schematic of mechanisms that promote Znproptosis. CLSM images of expression of FDX2 and Fe-S (4) in 4T1 cells, scale bar, 20 μm (N) and tumor tissues, scale bar, 50 μm. (O) after incubated with ZCE under NIR for 3 min under hypoxic condition. The data are presented as means ± SD, n = 3, *p < 0.05, **p < 0.01 and ***p < 0.001.
Figure 6
Figure 6
The signal mechanism of Znproptosis. (A) Schematic illustration of cell cycle and Akt/mTOR pathway. (B) The detailed route of cell cycle progress. (C) Flow cytometry analysis for cell cycle distribution of 4T1cells. (D) Quantitative data of cell population in cell cycle. WB analysis of cell cycle signal pathway (E) and Akt/mTOR pathway, in the red frame was ZCE added NAC to inhibit ROS. (G) Immunofluorescent staining of Chk2/Cyclin B1/p21 (F) and Akt/mTOR (H) of tumor tissues after treatment of nanocatalysts under hypoxic condition. Scale bar, 100 μm. (I) CLSM images of ROS production and quantitative data after incubated with KTC1101 under NIR for 5 min. Scale bar, 10 μm. (J) Immunofluorescent staining of Akt/mTOR of tumor tissues after treatment of nanocatalysts with/without NAC under hypoxic condition. Scale bar, 100 μm. (K) Heatmap of RNA-seq analysis of 4T1 cells incubated without or with ZCE. (L) The proportion of up- and down-regulated genes in 4T1 cells incubated with ZCE. (M) Volcano plots of differentially expressed genes in 4T1 cells incubated with ZCE. (N) The mRNA network map of expressed genes in 4T1 cells incubated with ZCE. (O) Gene ontology enrichment analysis of 4T1 cells incubated with ZCE. The data are presented as means ± SD, n = 3, *p < 0.05, **p < 0.01 and ***p < 0.001.
Figure 7
Figure 7
Immunomodulatory effect in vivo. Flow cytometry analysis and corresponding quantification of CD8+ T cells (CD8+CD107a, A), DC cells (CD86, B), MDSCs (Gr-1 CD11b, C) and M1/M2 (CD86 CD206, D) after NIR for 5 min. Immunohistochemistry staining of spleen (E) and tumors (F) for the subcutaneous tumor treatment model at the end of the treatment under hypoxic condition. Scale bar, 100 μm. Expression levels of immunity-related cytokines (including TNF-α, IL-6, IL-10, IFN-γ and IL-2) in tumor tissues (G-K) after different treatments under hypoxic condition. (n = 3, *p < 0.05, **p < 0.01, ***p < 0.001 and ****p < 0.0001).
Figure 8
Figure 8
Particles distribution evaluation in tissues. (A) Distribution of the nanoparticles in Balb/c mice obtained via in vivo imaging and ex vivo images of major organs and tumors 48 h post-injection (The white circles are tumor sites). Scale bar: 5 mm; (B) Quantitative analysis of in vivo imaging at different time points (Inset images are the initial fluorescence intensity before injected in mice for ICG, ZnO, ZZ, ZC, ZZE and ZCE groups (from left to right)); (C) Quantitative analysis of major organs and tumors 48 h post-injection;(D) Residual contents of nanoparticles in the body after tail vein injection; (E) Predicted curve of ZCE in the body after tail vein injection compared with the observed results; (F) The half-time of nanoparticles in the body after tail vein injection. The data are presented as means ± SD, n = 3, *p < 0.05, **p < 0.01 and ***p < 0.001.
Figure 9
Figure 9
Penetration capacity and antitumor effect studies. (A) CLSM Z-stack images of NPs penetration and the 3D-renderings into the multicellular spheroids of 4T1 for 20 µm intervals. Scale bar: 100 μm; (B) CLSM images show the distribution of NPs-FITC labeled (green) in 4T1 tumors under hypoxic condition. The tumors were sliced and imaged with a 10× objective. The nuclei were stained with DAPI (blue). Scale bar: 2 mm (n=5); (C) CLSM images of intratumor distribution of DOX (red) and ICG (green) for 2 h after injection under hypoxic condition. Cell nuclei of tumor slice were stained with DAPI (blue). Scale bars, 200 μm; (D) CLSM images of calcein AM and propidium iodide (PI) staining 4T1 cells treated with NPs and then irradiation for 5 min. Live/dead cells were green/red. Scale bar, 20 μm. (E) CLSM images of calcein AM and propidium iodide (PI) staining 3D spheroids of 4T1 treated with NPs and then irradiation for 5 min. Live/dead cells were green/red. Scale bar is 150 μm. (F) Cell viability in 4T1 cells with laser. (G) The IC50 values of 4T1 cells with laser. (H) Flow cytometric analysis in 4T1 cells with irradiation for 5 min. The data are presented as means ± SD, n = 3, *p < 0.05, **p < 0.01 and ***p < 0.001.
Figure 10
Figure 10
In vivo tumor growth inhibition study. (A) Scheme of administration to inhibit the tumor growth; (B) Tumor growth volumes of mice after treatment with nanoparticles examined 14 days after the injection, mean ± SD; (C) Changes in the body weight of the mice after 14-day injection with different NPs via tail veins, mean ± SD; (D) The tumor weight in different groups after 14 days, mean ± SD; (E) Representative tumor images, Scale bar: 4 mm; (F)Tumor growth inhibition rate of mice after treatment with nanoparticles examined 14 days after the injection, mean ± SD; (G)The H&E staining of organs and tumors of the different nanoparticle groups under hypoxic condition. Scale bar: 100 μm. (H) TUNEL and Ki-67 analysis of different treatments under hypoxic condition. Scale bar: 20 μm. ns, p > 0.05; *p < 0.05; **p < 0.01, and ***p < 0.001. (n = 5).

Similar articles

References

    1. Li Z, Ding B, Li J, Chen H, Zhang J, Tan J. et al. Multi-Enzyme Mimetic MoCu Dual-Atom Nanozyme Triggering Oxidative Stress Cascade Amplification for High-Efficiency Synergistic Cancer Therapy. Angewandte Chemie International Edition. 2025;64:e202413661. - PubMed
    1. Cheng J, Li L, Jin D, Dai Y, Zhu Y, Zou J. et al. Boosting Ferroptosis Therapy with Iridium Single-Atom Nanocatalyst in Ultralow Metal Content. Advanced Materials. 2023;35:2210037. - PubMed
    1. Tang G, He J, Liu J, Yan X, Fan K. Nanozyme for tumor therapy: Surface modification matters. Exploration. 2021;1:75–89. - PMC - PubMed
    1. Zhang L, Qiu M, Wang R, Li S, Liu X, Xu Q. et al. Monitoring ROS Responsive Fe3O4-based Nanoparticle Mediated Ferroptosis and Immunotherapy via 129Xe MRI. Angewandte Chemie International Edition. 2024;63:e202403771. - PubMed
    1. Li W, Xiao Y, Guo G, Peng J, Zhu N, Chen Z, Cuprous oxide nanocomposites with photothermal (PTT) and chemical dynamics (CDT) effects induce cuproptosis in breast cancer using the strategy of increasing inflow and reducing outflow. Nano Today. 2024. 56.

MeSH terms