. 2025 Mar 21;15(10):4654-4672.
doi: 10.7150/thno.111272. eCollection 2025.

A brain-accessible peptide modulates stroke inflammatory response and neurotoxicity by targeting BDNF-receptor TrkB-T1 specific interactome

Affiliations

A brain-accessible peptide modulates stroke inflammatory response and neurotoxicity by targeting BDNF-receptor TrkB-T1 specific interactome

Lola Ugalde-Triviño et al. Theranostics. .

Abstract

Glia reactivity, neuroinflammation and excitotoxic neuronal death are central processes to ischemic stroke and neurodegenerative diseases, altogether a leading cause of death, disability, and dementia. Given the high incidence of these pathologies and the limited efficacy of current treatments, developing brain-protective therapies that target both neurons and glial cells is a priority. Truncated neurotrophin receptor TrkB-T1, a protein produced by these cell types, plays relevant roles in excitotoxicity and ischemia. We hypothesized that interactions mediated by isoform-specific TrkB-T1 sequences might contribute to neurotoxicity and/or reactive gliosis, thus representing potential therapeutic targets. Methods: We designed cell-penetrating peptides containing TrkB-T1 isoform-specific sequences to: 1) characterize peptide delivery into rat primary cortical cultures and mice brain cortex; 2) isolate and identify the isoform interactome in basal and in vitro excitotoxic conditions; 3) analyze peptide effects on neuroinflammation and neurotoxicity using primary cultures subjected to excitotoxicity or in vivo in a mouse model of ischemia. Results: We identify here the TrkB-T1-specific interactome, poorly described to date, and demonstrate that interference of these protein-protein interactions using brain-accessible TrkB-T1-derived peptides can reduce reactive gliosis and decrease excitotoxicity-induced damage in cellular and animal models of stroke, where treatment reduces the infarct volume in male and female mice. Conclusions: The crucial role of TrkB-T1 in modulating microglia and astrocyte reactivity indicates that isoform-derived peptides hold promise for the development of therapies for human stroke and other excitotoxicity-associated pathologies.

Keywords: cell-penetrating peptides; excitotoxicity; inflammatory response; interactome; neurodegeneration; neuroprotection.


Conflict of interest statement

Competing Interests: The authors have declared that no competing interest exists.

Figures

Figure 1
Figure 1
Validation of isoform-specific CPPs as tools for identification of TrkB-T1 interactome and prevention of neuronal death by excitotoxicity. (A) Structure of TrkB-T1 receptor, indicating the extracellular domain (ECD), responsible of brain derived neurotrophic factor (BDNF)-binding, the transmembrane segment (TM) and the short intracellular domain (ICD). The precise sequence corresponding to the TrkB-T1 C-ter (dotted oval) is indicated. It contains a region shared with TrkB-FL (black and green) followed by the TrkB-T1-specific sequence (pink). Biotin (Bio)-labelled Tat-derived CPPs, containing this isoform-specific sequence (Bio-sTT1Ct) or unrelated sequences for the control peptide (Bio-TMyc), are also indicated. (B) Immunocytochemistry assays of primary cortical cultures treated with Bio-sTT1Ct, Bio-TMyc (25 µM) or vehicle for 30 min. TrkB-T1 and Bio-sTT1Ct distribution were analyzed with an isoform specific antibody (red). Peptide visualization with Fluorescein Avidin D (green) shows that Bio-sTT1Ct presents a pattern similar to that observed for endogenous TrkB-T1. Bio-TMyc distribution was visualized in Neu+ (arrowheads) and Neu- (asterisk), corresponding respectively to neurons and presumably astrocytes (d-f). Scale bar, 10 µm. (C) Analysis of cultures treated as before with specific antibodies for astrocytes (GFAP, red) or neurons (NeuN, magenta). Peptide visualization with Fluorescein Avidin D (green) shows distribution in both Neu+ neurons (arrowheads) and GFAP+ astrocytes (asterisk). Scale bar, 10 μm. (D) Cell viability of cortical cultures treated with Bio-sTT1Ct and Bio-TMyc (25 µM) for 4, 6 or 24 h. Means ± SEM and individual points are presented relative to values obtained for 4 h of Bio-TMyc treatment (100%). Data were analyzed using two-way ANOVA test followed by post hoc Bonferroni test, n = 4. (E) Neuronal viability in cultures incubated with Bio-TMyc or Bio-sTT1Ct (25 µM) for 30 min and treated with NMDA for 2 or 4 h. Means ± SEM and individual points are presented relative to the values obtained for untreated cells (100%). Data were analyzed using two-way ANOVA test followed by post hoc Bonferroni test, n = 8.
Figure 2
Figure 2
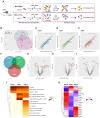
Bio-sTT1Ct as a tool to approach TrkB-T1 specific interactome in different biological conditions. (A) Experimental design of pull-down assays to isolate Bio-TMyc and Bio-sTT1Ct interacting proteins. Cultures were incubated with Bio-sTT1Ct or Bio-TMyc (25 µM) for 30 min before treatment with BDNF (100 ng/ml) or NMDA for 30 min. After that, cell lysates were combined with streptavidin agarose beads to isolate the CPP-interacting proteins. (B) Principal Component Analysis of Bio-TMyc and Bio-sTT1Ct pull-down isolates. Samples are represented using the first (PC1) and second (PC2) components of the analysis. (C-E) Pearson's correlation of the average protein interactions established by Bio-TMyc and Bio-sTT1Ct in basal conditions (C), or after BDNF (D) or NMDA treatment (E). Colored points represent the top 20% proteins whose residuals are furthest from the correlation line and have higher levels of binding to Bio-sTT1Ct. (F) Venn diagram representing the number of proteins selected for each condition following the criteria described above. (G-H) Volcano plot presenting the results of the differential analysis of interacting proteins comparing BDNF vs basal conditions (G), NMDA vs BDNF (H) and NMDA vs basal conditions (I). Log2FC and -Log10(p-value) are shown. Proteins selected with the criteria explained above are represented as dark grey points while proteins showing statistically significant differences are labelled and presented as brown dots (p-value < 0.05). FDR = 9.52% (G), 4.15% (H) or 9.55% (I). FC, fold change. (I) Pathway enrichment analysis of selected proteins for basal, BDNF and NMDA conditions. A heatmap showing the enrichment score for each pathway (Reactome.db) at the different conditions is presented. (J) Comparison of RhoGDI (Arhgdia) (highlighted) and our selected proteins annotated in "Signaling by Rho GTPases" Reactome pathway in basal, BDNF and NMDA conditions. A heatmap showing the z-score indicating levels for each protein at the different conditions is presented.
Figure 3
Figure 3
TrkB-T1-derived peptide TT1Ct is neuroprotective against in vitro excitotoxicity and prevents a decrease in CRE and MEF promoter activities induced by the excitotoxic injury. (A) Sequence of control peptide (TMyc) and TrkB-T1-derived CPP (TT1Ct). (B) Neuronal viability in cultures incubated with TMyc or TT1Ct (5, 15 or 25 µM) for 30 min and then treated with NMDA (100 µM) for 2 h or left untreated. Individual data and means ± SEM are presented relative to values obtained in the untreated cells (100%). Data were analyzed using Kruskal-Wallis test followed by Mann-Whitney U-test, n = 6-16. (C) Neuronal viability in cultures incubated with Bio-TMyc, Bio-sTT1Ct or TT1Ct (15 µM) for 30 min and then treated with NMDA (100 µM) for 2 or 4 h. Individual data and means ± SEM are presented relative to values obtained for untreated cells (100%). Data were analyzed using two-way ANOVA test followed by post hoc Bonferroni test, n = 6-8. (D) Western Blot analysis of TrkB-T1, pCREB and MEF2D levels in cultures incubated with TMyc or TT1Ct (15 µM) for 30 min followed by treatment for 30, 60 or 120 min with NMDA. A representative experiment is shown. (E) Quantitation by densitometric analysis of pCREB and MEF2D levels. Means ± SEM are presented relative to basal conditions in the presence of TMyc (100%), n = 5. (F) Effect of excitotoxicity and TT1Ct treatment on CRE and MEF2 promoter activity. Cultures transfected with plasmids containing minimal CREB or MEF2 response elements (respectively, pCRE and pMEF) or pMEFmut were preincubated with peptides as above and treated with NMDA for 2 h or left untreated. Individual results and means ± SEM are presented relative to luciferase expression in untreated cultures. Data was analyzed by two-way ANOVA test followed by post hoc Bonferroni test, n = 5-7. For cultures transfected with pCRE and pMEF, treated with vehicle or TMyc, differences between -/+ NMDA are statistically significant although not shown for simplicity.
Figure 4
Figure 4
TT1Ct interferes transcriptional changes induced by excitotoxicity affecting expression of genes involved in survival/death choices. Cultures preincubated with TT1Ct or TMyc (15 µM) for 30 min were treated with NMDA for 4 h or left untreated. Levels of mRNAs encoding for NMDAR-subunits GluN1 (A) and GluN2A (B) or TrkB-FL (C) and TrkB-T1 isoforms (D) were normalized to those of NSE. Levels of BDNF (E) and GFAP mRNA (F) were normalized relative to GAPDH. Individual values and means ± SEM are presented relative to gene expression in cultures treated with TMyc (100%). Data were analyzed by two-way ANOVA test followed by post hoc Tukey's or Kruskal Wallis test followed by post hoc Dunn's test, n = 5.
Figure 5
Figure 5
TT1Ct brain distribution in a mouse model of permanent ischemia showing upregulation of TrkB-T1+/GFAP+ cells in the interface between ischemic and non-ischemic tissue. (A) Experimental design to analyze in vivo effects of TMyc and TT1Ct. Permanent vessel occlusion and focal brain damage were induced in mice by cold-light irradiation after Rose Bengal i.v. injection. CPPs (3 nmol/g) were i.v. injected 1 h after damage initiation. Animals were sacrificed 5 or 24 h after injury onset as indicated. Representative 1 mm brain coronal slices stained with TTC after 24 h of insult are shown. (B) Immunohistochemistry of brain coronal sections prepared from TMyc-treated male animals 5 h after insult stained with isoform-specific TrkB antibodies (TrkB-FL and TrkB-T1), NeuN, GFAP and DAPI. Maximal projection of representative confocal microscopy images showing cortical areas of the infarct border are presented. Scale bar, 50 μm. (C) Analysis of TT1Ct delivery to male and female mice cortex after 5 h of ischemia. Bio-TT1Ct and Bio-TMyc were injected as before and detected in the contralateral region of coronal sections by Fluorescein Avidin D (green). Neuronal marker NeuN (magenta) is also shown. Peptide delivery was observed in neuronal (asterisks) and non-neuronal cells (arrowheads). Representative confocal microscopy images of cortical areas correspond to single sections. Scale bar, 20 μm.
Figure 6
Figure 6
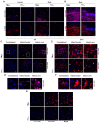
Treatment with TT1Ct prevents reactive gliosis at early and late times of ischemic damage. (A) Coronal sections of male and female mice injected with TMyc or TT1Ct (3 nmol/g) after 5 h of insult were stained with antibodies for C3 (red), GFAP (magenta) and DAPI to detect reactive astrocytes. Representative maximum intensity projection confocal images from the infarct border are shown. Scale bar, 20 μm. (B) Coronal sections of male mice treated with TMyc or TT1Ct (3 nmol/g) after 24 h of insult were stained as above. Representative maximum intensity projection of confocal images from the infarct border are shown. Scale bar, 20 μm. (C) Coronal sections of male mice injected with TMyc or TT1Ct (3 nmol/g) after 24 h of insult were stained with an antibody for CD68 (magenta) and DAPI to detect microglia and macrophage inflammatory state. Representative maximum intensity projection of confocal images from the contralateral cortex, infarct core and infarct border are shown. Scale bar, 20 μm. (D) Detail of cell morphology in selected areas indicated in panel C, corresponding to animals injected with TMyc as above indicated. Scale bar, 20 μm. (E) Coronal sections of male mice injected with TMyc or TT1Ct (3 nmol/g) after 24 h of insult were stained with antibody for Iba1 (red) and DAPI to detect microglia and macrophage inflammatory state. Representative maximum intensity projection of confocal images of the contralateral cortex, infarct core and infarct border are shown. Reactive microglia (asterisks) and resting microglia (arrows) were detected. Scale bar, 20 μm. (F) Detail of cell morphology in selected areas indicated in panel E, corresponding to animals injected with TMyc as above indicated. Scale bar, 20 μm. (G) Double immunohistochemistry with CD68 (green) and Iba1 (red) antibodies of the infarct core of male mice injected with TMyc or TT1Ct as above to analyze possible signal overlapping. Representative maximum intensity projection of confocal images are shown. Scale bar, 20 μm.
Figure 7
Figure 7
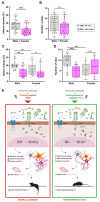
Treatment with TT1Ct reduces infarct volume and motor coordination deficits in animals exposed to permanent ischemia. (A and C) Infarct volume of animals injected with TMyc or TT1Ct (3 nmol/g) and sacrificed 24 h after damage induction, expressed as a percentage of the hemisphere volume. Individual data and box and whisker plots show interquartile range, median, minimum and maximum values. The mean value for each experimental group is also provided as a number on top of the corresponding plot. Results are given for the whole population (A) or disaggregated according to gender (C). Differences were analyzed by Student's t-test (n = 20 for A, n = 9-10 for C). (B and D) Evaluation of balance and motor coordination. Number of contralateral hind paw slips were measured in male and female animals. As above, results are presented for the whole population (B) or disaggregated according to gender (D). Differences were analyzed by Student's t-test (n = 21-22 for B, n = 10-12 for D). (E) Model proposed for TT1Ct action. In the presence of the control peptide TMyc, ischemic damage induces TrkB-T1 RIP and binding of particular proteins to the isoform-specific C-ter sequence, present in TrkB-T1-ICD or unprocessed full-length protein. This excitotoxicity-induced binding results, by still undefined mechanisms, in shut-off of CREB and MEF2 promoter activities and transcriptional changes, affecting neurons and glial cells. Among other transcripts, the increase in TrkB-T1 and GFAP mRNA levels could contribute to decreased neuronal survival concurrent with increased microglia and astrocyte reactivity, resulting in bigger infarcts and a worse neurological outcome. In contrast, by interfering TrkB-T1 protein interactions, TT1Ct would help to maintain CREB and MEF2 activities and prevent the transcriptional changes induced by excitotoxicity, contributing to neuronal survival and reduced reactive gliosis. Consequently, the infarct size and the neurological damage would be strongly diminished.

References

    1. DeLong JH, Ohashi SN, O'Connor KC, Sansing LH. Inflammatory responses after ischemic stroke. Semin Immunopathol. 2022;44:625–48. - PubMed
    1. Shen XY, Gao ZK, Han Y, Yuan M, Guo YS, Bi X. Activation and role of astrocytes in ischemic stroke. Front Cell Neurosci. 2021;15:755955. - PMC - PubMed
    1. Escartin C, Galea E, Lakatos A, O'Callaghan JP, Petzold GC, Serrano-Pozo A. et al. Reactive astrocyte nomenclature, definitions, and future directions. Nat Neurosci. 2021;24:312–25. - PMC - PubMed
    1. Hasel P, Rose IVL, Sadick JS, Kim RD, Liddelow SA. Neuroinflammatory astrocyte subtypes in the mouse brain. Nat Neurosci. 2021;24:1475–87. - PubMed
    1. Verkhratsky A, Parpura V, Li B, Scuderi C. Astrocytes: the housekeepers and guardians of the CNS. Adv Neurobiol. 2021;26:21–53. - PMC - PubMed