. 2025 Mar 21;15(10):4673-4692.
doi: 10.7150/thno.106083. eCollection 2025.

A new nano-encapsulated TSPO ligand reduces neuroinflammation and improves cognitive functions in Alzheimer's disease model

Affiliations

A new nano-encapsulated TSPO ligand reduces neuroinflammation and improves cognitive functions in Alzheimer's disease model

Antonella Casamassa et al. Theranostics. .

Abstract

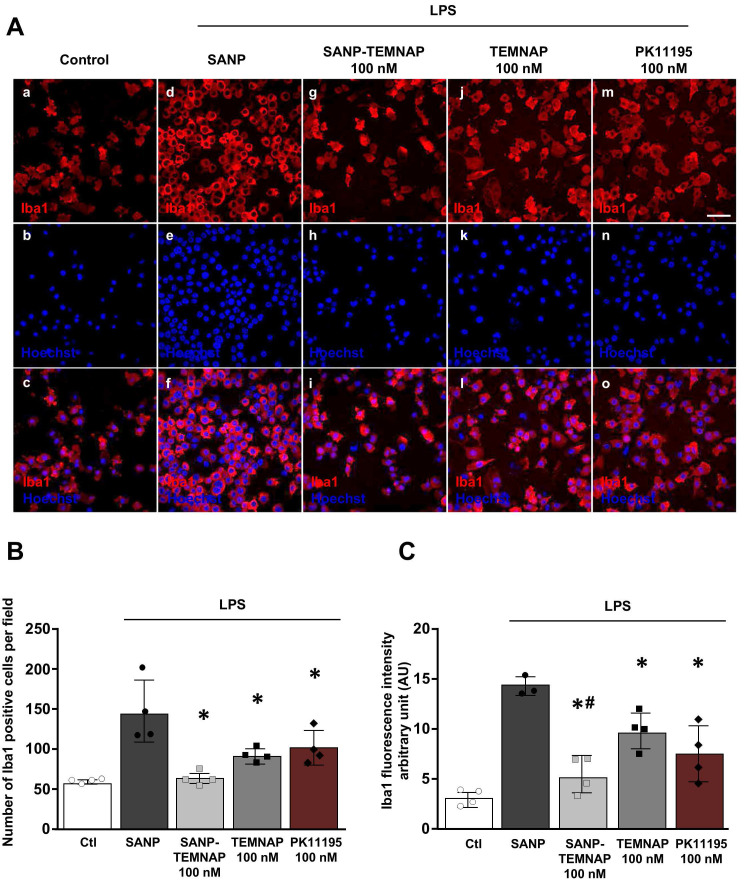
Rationale: The translocator protein 18 kDa (TSPO) is mainly expressed on the outer mitochondrial membrane and is implicated in inflammation, cell survival, and proliferation. TSPO expression in activated microglia is upregulated in Alzheimer's disease (AD), representing both a biomarker and therapeutic target for neuroinflammation. Methods: We synthesized a new TSPO ligand, TEMNAP, a hybrid of temazepam, a compound well known for its ability to bind TSPO, and naproxen, a drug with anti-inflammatory properties that is potentially useful to mitigate neuroinflammation. TEMNAP was encapsulated in a self-assembling nanoparticle transferrin-targeted (SANP-TF-TEMNAP) for brain delivery. The effectiveness of TEMNAP in mitigating inflammatory processes and cognitive behavior was investigated in genetically modified Tg2576 mice, a model of Alzheimer's disease. Its effect on neuroinflammation has also been explored in lipopolysaccharide-activated BV2 microglial cells. Results: SANP-TEMNAP significantly reduced the expression of proinflammatory markers in activated microglia, and this effect was abrogated by TSPO silencing. More importantly, TEMNAP was mass-spectrometrically detected in the hippocampus and cortex of Tg2576 mice after SANP-TF-TEMNAP intraperitoneal administration, preventing hippocampal neuroinflammation and improving cognitive function. Conclusions: These results emphasize the following: (i) the role of transferrin-conjugated self-assembling nanoparticles (SANP-TF) as CNS nanovectors, and (ii) the potential therapeutic effectiveness of peripherally administered SANP-TF-TEMNAP in preventing neuroinflammation associated with cognitive decline.

Keywords: Alzheimer's disease; TSPO; nanovectors; neurodegeneration; neuroinflammation.


Conflict of interest statement

Competing Interests: The authors have declared that no competing interest exists.

Figures

Figure 1
Figure 1
Synthesis of molecular hybrid between Temazepam and Naproxen (TEMNAP) and physical-chemical characterization of SANPs encapsulating TEMNAP. (A-B) Schematic representation of the chemical compound TEMNAP synthesis (3A-B) obtained by adding to the reaction mixture Temazepam (1) and Naproxen (2); (C) Physical-chemical characterization of SANPs encapsulating TEMNAP: the size, the polydispersity index and the zeta potential (ζ) were assessed by Zetasizer Nano Ultra (Malvern, UK).
Figure 2
Figure 2
Characterization of the new synthesized TSPO ligand TEMNAP: in vitro experiments to assess the concentration-response by evaluating iNOS expression, NO release and microglial cell proliferation. (A) Effect of the new synthesized compound TEMNAP on BV2 microglia viability. Data are expressed as the percentage of control (Ctl) condition. The values represent the mean ± SEM; (n = 4 independent experimental replicates); (B) Representative confocal images displaying the expression of Iba1 (red) and iNOS (green) in BV2 microglia cell cultures in control condition (a-c) and in LPS-stimulated microglia in absence (d-f) or in presence (g-o) of the new synthesized compound TEMNAP (10 nM) (g-i), TEMNAP (50 nM) (j-l) and TEMNAP (100 nM) (m-o). Nuclei were stained by the nuclear dye Hoechst-33258. Scale bars: 10 µm. (C) NO production in BV2 microglia cell cultures in control condition and in LPS-stimulated microglia in absence or in presence of the new synthesized compound TEMNAP (10 nM), TEMNAP (50 nM) and TEMNAP (100 nM). Data are expressed as percentage of control (Ctl) condition. The values represent the mean ± SEM; (n = 9 independent experimental replicates); *p < 0.05 versus control. (D) Representative confocal images displaying the expression of Iba1 (red) in BV2 microglia cell cultures in control condition (a-c) and in LPS-stimulated microglia in absence (d-f) or in presence (g-o) of the new synthesized compound TEMNAP (10 nM) (g-i), TEMNAP (50 nM) (j-l) and TEMNAP (100 nM) (m-o). Nuclei were stained by the nuclear dye Hoechst-33258. Scale bars: 50 µm. (E) Quantitative analysis of Iba1-positive cells in BV2 microglia cell cultures in control (Ctl) condition and in LPS-stimulated microglia in absence or in presence of the new synthesized compound TEMNAP (10 nM), TEMNAP (50 nM) and TEMNAP (100 nM). The values represent the mean±SEM; (n = 4 independent experimental replicates); *p < 0.05 versus control.
Figure 3
Figure 3
Effect of TEMNAP (100 nM) on microglial cell proliferation and Iba1 expression after exposure of BV2 cells to LPS. (A) Representative confocal images displaying the expression of Iba1 (red) in control condition (a-c) and in LPS-stimulated microglia (d-o) co-exposed to the following conditions: (1) self-assembling nanoparticle (SANP) (d-f); (2) nanoencapsulated-TEMNAP (100 nM) (SANP-TEMNAP) (g-i); (iii) TEMNAP (100 nM) non-nanoencapsulated (j-l); (3) the classical TSPO ligand PK11195 (m-o). Nuclei were stained by the nuclear dye Hoechst-33258. Scale bars: 50 µm. (B) Quantitative analysis of Iba1)-positive cells. The values represent the mean ± SEM; (n = 4 independent experimental replicates); *p < 0.05 versus LPS. (C) Quantitative analysis of Iba1 fluorescence intensity. The values represent the mean ± SEM; (n = 4 independent experimental replicates); *p < 0.05 versus control; #<0.05 versus TEMNAP (100 nM).
Figure 4
Figure 4
Expression of the pro- and anti-inflammatory markers (iNOS, CD86 and IL-1Ra) in LPS-stimulated BV2 microglia exposed to SANP-TEMNAP (100 nM). (A) Representative confocal images displaying the expression of Iba1 (red) and iNOS (green) in BV2 microglia cell cultures in control condition (a-c) and in LPS-stimulated microglia co-exposed to the following conditions: (i) self-assembling nanoparticle (SANP) (d-f); (ii) nanoencapsulated-TEMNAP (100 nM) (SANP-TEMNAP) (g-i); (iii) TEMNAP (100 nM) non-nanoencapsulated (j-l). Nuclei were stained by the nuclear dye Hoechst-33258. Scale bars: 10 µm. (B) Representative confocal images displaying the expression of Iba1 (red) and CD86 (green) in BV2 microglia cell cultures in control condition (a-c) and in LPS-stimulated microglia co-exposed to the following conditions: (i) self-assembling nanoparticle (SANP) (d-f); (ii) nanoencapsulated-TEMNAP (100 nM) (SANP-TEMNAP) (g-i); (iii) TEMNAP (100 nM) non-nanoencapsulated (j-l). Nuclei were stained by the nuclear dye Hoechst-33258. Scale bars: 10 µm. (C) Quantitative analysis of iNOS (a) and CD86 (b) fluorescence intensities. The values represent the mean±SEM; (n = 3 independent experimental replicates); *p < 0.05 versus control. (D) Representative confocal images displaying the expression of CD11b (red) and IL-1Ra (green) in BV2 microglia cell cultures in LPS-stimulated microglia co-exposed to the following conditions: (i) nanoencapsulated-TEMNAP (100 nM) (SANP-TEMNAP) (a-c); (ii) transferrin-conjugated nanoparticles containing TEMNAP (100 nM) (SANP-TF-TEMNAP) (d-f); Nuclei were stained by the nuclear dye Hoechst-33258. Scale bars: 20 µm.
Figure 5
Figure 5
Evaluation of LPS-induced proliferation, iNOS expression and cytokine release in BV2 microglial cells co-treated with the nanoparticle-encapsulated TEMNAP (100 nM) in presence of siTSPO (100 nM) or in presence of siControl (100 nM) for 72 h. (A) Representative blotting and quantitative densitometric analysis of TSPO protein expression levels in BV2 microglial cells exposed to siRNA targeting tspo gene (siTSPO) (100 nM) or to siControl (siCtl) for 72 h. The values represent the mean±SEM; (n = 3 independent experimental replicates); *p < 0.05 versus siControl. (B) Representative confocal images displaying the expression of Iba1 (green) and iNOS (red) in BV2 microglia cell cultures in control condition (a-c) and in LPS-stimulated microglia exposed to self-assembling nanoparticle (SANP) (d-f); nanoencapsulated-TEMNAP (100 nM) (SANP-TEMNAP); nanoencapsulated-TEMNAP (100 nM) in presence of siControl (100 nM) (j-l); nanoencapsulated-TEMNAP (100 nM) in presence of siTSPO (100 nM). Nuclei were stained by the nuclear dye Hoechst-33258. Scale bars: 10 µm. (C) Representative confocal images displaying the expression of Iba1 (green) and iNOS (red) in BV2 microglia cell cultures in LPS-stimulated microglia co-exposed to nanoencapsulated-TEMNAP in presence of siCtl (a-f); nanoencapsulated-TEMNAP (100 nM) in presence of siTSPO (g-l). Panels d,e,f represent higher magnification of the panels a,b and c respectively. Panels j,k,l represent higher magnification of the panels g,h and i respectively. Nuclei were stained by the nuclear dye Hoechst-33258. Scale bars: 10 µm. (D) Quantification of iNOS-fluorescence positive area (a) and quantitative analysis of Iba1-positive cells (b) in LPS-stimulated BV2 microglia co-exposed to nanoencapsulated-TEMNAP (100 nM) in presence of siControl (100 nM) and nanoencapsulated-TEMNAP (100 nM) in presence of siTSPO (100 nM). The values represent the mean ± SEM; (n = 3 experimental replicates); *p < 0.05 versus siControl. (E) Cytokine antibody array membrane representing the expression levels of two pro-inflammatory cytokines, IL-12p40p70 and RANTES, in the culture media of LPS-stimulated BV2 microglial cells co-exposed to SANP-TEMNAP in presence of siCtl and siTSPO. (F) Quantitative densitometric analysis representing the expression levels of IL-12p40p70 (a) and RANTES (b), in the culture media of LPS-stimulated BV2 microglial cells co-exposed to SANP-TEMNAP in presence of siCtl and siTSPO. Data are expressed as the percentage of siControl. The values represent the mean of two spots for each cytokine; *p < 0.05 versus siControl.
Figure 6
Figure 6
Evaluation of Iba1 and CD86 expression in hippocampus of Tg2576 mice chronically treated with TEMNAP encapsulated in a transferrin-engineering precision nanoparticle system (SANP-TF-TEMNAP). Representative brain slice cartoons indicating the area of interest are on the top side of the Figures. (A) Confocal images displaying the expression of the marker Iba1 (red) and the pro-inflammatory marker CD86 (green) in the hippocampal regions of wild-type (a-i) and Tg2576 (j-r) mice treated with the empty transferrin-engineering nanoparticles (SANP-TF) or (B) treated with transferrin-engineering nanoparticles containing TEMNAP (SANP-TF-TEMNAP). Sections were captured in the different hippocampal regions: CA1, CA2, CA3 and Dentate Gyrus (DG) -. Nuclei were stained by the nuclear dye Hoechst-33258. Stratum Oriens (SO), Stratum Pyramidale (SP), Stratum Radiatum (SR), Molecular Layer (ML), Granular Cell Layer (GCL), Polymorphic Layer (PL) Scale bars: 50 µm.
Figure 7
Figure 7
Morphological characterization of Iba1-positive microglia in the hippocampus of Tg2576 mice chronically treated with SANP-TF or SANP-TF-TEMNAP. (A) Representative confocal images displaying the hippocampal microglial expression of Iba1 (a,d), CD86 (b,e) and Merge (c,f) from Tg2576 mice treated with SANP-TF or with SANP-TF-TEMNAP. Nuclei were stained by the nuclear dye Hoechst-33258. Scale bars: 20 µm. Quantitative analysis of Iba1 (g) and CD86 (h) fluorescence intensity in brain sections from Tg2576 mice treated with SANP-TF or with SANP-TF-TEMNAP. The values represent the mean ± SEM; (n = 5 independent experiments); *p < 0.05 versus control. (B) (a-b) Representative pictures of Sholl masks of individual Iba1-positive hippocampal microglial cells. (SANP-TF, n = 18 from 3 independent experiments; SANP-TF-TEMNAP, n = 18 from 3 independent experiments). Scale bars: 20 µm. (c) Single-cell microglia morphology reconstruction by Sholl analysis. Data are represented in a line graph as mean ± SEM (SANP-TF, n = 18 from 3 independent experiments; SANP-TF-TEMNAP, n = 17 from 3 independent experiments). (C) Quantitative evaluation of hippocampal microglial morphology: (a) ending radius, (b) intersecting radii, (c) sum of intersections, (d) primary branches, (e) branching point. Data are expressed as mean ± SEM (SANP-TF, n = 18 from 3 independent experiments; SANP-TF-TEMNAP, n = 17 from 3 independent experiments). (D) (a-b) Representative examples showing the binary images of microglial morphology reconstructed starting from Iba1 immunoreactivity. In red are respectively indicated the soma cells and microglial arbor field area. Scale bars: 20 µm. (c-d) Quantitative evaluation of cell morphology performed by analyzing: (c) the soma area (in µm2) and (d) the microglial arbor field area (in µm2), Data are expressed as mean ± SEM (SANP-TF, n = 18 from 3 independent experiments; SANP-TF-TEMNAP, n = 17 from 3 independent experiments). Representative brain slices on the top of the figure represent the hippocampal area of interest.
Figure 8
Figure 8
Evaluation of Iba1 and iNOS expression in primary ex vivo microglia cultures obtained from hippocampus of Tg2576 mice chronically treated with with SANP-TF or SANP-TF-TEMNAP. (A) Representative confocal images displaying the microglial expression of Iba1 (a,d) and iNOS (b,e) and merge (c,f) in ex vivo primary cultures from Tg2576 mice chronically treated with SANP-TF or with SANP-TF-TEMNAP. Nuclei were stained by the nuclear dye Hoechst-33258. Scale bars: 10 µm. (B) Quantitative analysis of Iba1 (a) and iNOS (b) fluorescence intensity in ex vivo primary cultures from Tg2576 mice chronically treated with SANP-TF or with SANP-TF-TEMNAP. The values represent the mean±SEM; (n = 5 indipendent experiments); *p < 0.05 versus control. A representative brain slice on the top of the figure represents the hippocampal area of interest.
Figure 9
Figure 9
Evaluation of cognitive impairment in Tg2576 mice chronically treated with SANP-TF or SANP-TF-TEMNAP. (A) Total number of alternations from T-Maze test in the Tg2576 mice chronically treated with SANP-TF or with SANP-TF-TEMNAP. (B) Latency to fall from T-Maze test, the data are expressed in s. The values represent the mean±SEM; (n = 8/10 for each group); *p < 0.05 versus SANP-TF-TEMNAP treated Tg2576 mice. (C) Discrimination index from object recognition test in the Tg2576 mice chronically treated with SANP-TF or with SANP-TF-TEMNAP. The data are expressed in percentage. (D) Distance traveled in the object recognition test are expressed in cm. The values represent the mean±SEM; (n = 4/6 for each group); *p < 0.05 versus SANP-TF treated wild-type mice. (E) Latency to escape from Barnes maze test in the Tg2576 mice chronically treated with SANP-TF or with SANP-TF-TEMNAP. The data are expressed in s. The values represent the mean±SEM; (n = 4/6 for wild-type SANP-TF and wild-type SANP-TF-TEMNAP and n = 5/8 for Tg2576 SANP-TF and Tg2576 SANP-TF-TEMNAP); *p < 0.05 versus all experimental groups.

Similar articles

References

    1. Leng F, Edison P. Neuroinflammation and microglial activation in Alzheimer disease: where do we go from here? Nat Rev Neurol. 2021;17:157–72. - PubMed
    1. Rupprecht R, Papadopoulos V, Rammes G, Baghai TC, Fan J, Akula N. et al. Translocator protein (18 kDa) (TSPO) as a therapeutic target for neurological and psychiatric disorders. Nat Rev Drug Discov. 2010;9:971–88. - PubMed
    1. Gargiulo S, Anzilotti S, Coda AR, Gramanzini M, Greco A, Panico M. et al. Imaging of brain TSPO expression in a mouse model of amyotrophic lateral sclerosis with (18)F-DPA-714 and micro-PET/CT. Eur J Nucl Med Mol Imaging. 2016;43:1348–59. - PubMed
    1. Coda AR, Anzilotti S, Boscia F, Greco A, Panico M, Gargiulo S. et al. In vivo imaging of CNS microglial activation/macrophage infiltration with combined [(18)F]DPA-714-PET and SPIO-MRI in a mouse model of relapsing remitting experimental autoimmune encephalomyelitis. Eur J Nucl Med Mol Imaging. 2021;48:40–52. - PMC - PubMed
    1. Zhou R, Ji B, Kong Y, Qin L, Ren W, Guan Y. et al. PET Imaging of Neuroinflammation in Alzheimer's Disease. Front Immunol. 2021;12:739130. - PMC - PubMed

MeSH terms