. 2025 Mar 18;15(10):4308-4324.
doi: 10.7150/thno.110379. eCollection 2025.

Colorectal cancer stem cells develop NK cell resistance via homotypic cell-in-cell structures suppressed by Stathmin1

Affiliations

Colorectal cancer stem cells develop NK cell resistance via homotypic cell-in-cell structures suppressed by Stathmin1

Yen-Yu Lin et al. Theranostics. .

Abstract

Rationale: Advances in cancer therapies have significantly improved patient survival; however, tumors enriched in cancer stem cells (CSCs) have poor treatment responses. CSCs are a key source of tumor heterogeneity, contributing to therapeutic resistance and unfavorable patient outcomes. In the tumor microenvironment (TME), cell-in-cell (CIC) structures, where one cell engulfs another, have been identified as markers of poor prognosis. Despite their clinical relevance, the mechanisms underlying CIC formation across different tumor cell subpopulations remain largely unknown. Elucidating these processes could provide novel insights and therapeutic opportunities to address aggressive, treatment-resistant cancers. Method: Fluorescent mCherry-carrying colorectal cancer stem cells (CRCSCs) were expanded as spheroids in serum-free media and cocultured with either parental cancer cell-expressing Venus fluorescent protein or CFSE dye-stained immune cells (T cells, M1/M2 macrophages, neutrophils, and NK cells) or treated with EGFR- or PD-L1-targeting antibodies to assess the formation of CIC structures. Genes potentially crucial for the formation of CIC structures were knocked down or overexpressed, and their effects on CIC formation were evaluated. The clinical relevance of the in vitro findings was confirmed through analysis of formalin-fixed, paraffin-embedded (FFPE) human colorectal cancer (CRC) specimens. Results: CRCSCs have a strong predilection for serving as the outer cell in a CIC structure and forming homotypic CIC structures predominantly with parental CRC cells. The frequency of CIC structure formation increased when the cells were exposed to anti-PD-L1 antibody treatment. Both the outer CRCSC in a CIC structure and CRCSCs released from a homotypic CIC structure showed enhanced resistance to the cytotoxicity of NK-92MI cells. Restoration of Stathmin1 (STMN1) expression but not RAC1 knockdown in CRCSCs reduced the homotypic CIC frequency, disrupted the outer cell fate in CIC structures, and increased cell susceptibility to NK-92MI cytotoxicity. In CRC patients, CIC structures are associated with poor tumor differentiation, negative STMN1 expression, and poor prognosis. Conclusion: CSCs play a crucial role in informing CIC structures in CRC. CIC structure formation partially depends on low STMN1 expression and confers a survival advantage under NK cytotoxicity. Targeting this pathway may significantly improve immunotherapy's efficacy for CRC patients.

Keywords: Cell-in-Cell Structure; Colorectal Cancer Stem Cell; Immunotherapy; Stathmin1; Tumor Microenvironment.


Conflict of interest statement

Competing Interests: The authors have declared that no competing interest exists.

Figures

Figure 1
Figure 1
SDCSCs generate more CIC structures when cocultured with parental CRC cells. (A). Histograms showing the frequency of CIC structures generated by mCherry-carrying SDCSCs (HCT15-SDCSC-C2 and HT29-SDCSC-C2) and Venus-carrying CRC cells (HCT15-V2 and HT29-V2) or CFSE-stained immune cells 24 h after initial cell seeding in basal RPMI-1640 medium. The data are presented as the means ± sems. *P < 0.05, ***P < 0.001. N = 3. (B). Representative images of CIC structure formation by mCherry-carrying SDCSCs (HCT15-SDCSC-C2 and HT29-SDCSC-C2) and Venus-carrying CRC cells (HCT15-V2 and HT29-V2) or CFSE-stained immune cells at 24 h under basal RPMI-1640 medium cultivation. White arrow, CIC structure. Two representative images from three independent assays are shown. Scale bar = 10 μm. (C). Percentage of CIC structure subtypes between mCherry-carrying SDCSCs and Venus-carrying CRC cells or CFSE-labeled immune cells. There were 214 (HCT15-V2), 61 (CFSE dHL60), 15 (CFSE THP1-M1), 23 (CFSE THP1-M2), and 39 (Jurkat) CIC structures counted when the indicated cells were cocultured with mCherry-labeled HCT15-SDCSCs. When the indicated cells were cocultured with mCherry-labeled HT29-SDCSCs, 134 (HT29-V2), 17 (CFSE dHL60), 34 (CFSE THP1-M1), 13 (CFSE THP1-M2), and 6 (Jurkat) CIC structures were counted. R(G), CIC structures with outer mCherry-carrying SDCSCs and the inner indicated cells. The data are presented as the means ± sems. *P < 0.05, *** P < 0.001; ns, not significant; #, not detected. N = 3. (D). Percentages of CIC structure subtypes among mCherry-carrying CRC cells (HCT15-C2 or HT29-C2) and CFSE-labeled immune cells. Sixteen (CFSE dHL60), 23 (CFSE THP1-M1), 44 (CFSE THP1-M2), and 57 (Jurkat) CIC structures were counted when the indicated cells were cultured with HCT15-C2 cells. R(G), CIC structures with outer mCherry-carrying CRC cells and inner indicated cells. When the indicated cells were cocultured with mCherry-labeled HT29-C2 cells, 7 (CFSE dHL60), 34 (CFSE THP-1-M1), 13 (CFSE THP-1-M2), and 5 (Jurkat) CIC structures were counted. The data are presented as the means ± sems. *** P < 0.001; ns, not significant; #, not detected. N = 3. (E). Time-lapse images showing the engulfment of parental HT29-V2 cells by HT29-SDCSC-C2 cells. Scale bar = 10 μm. (F). Representative confocal images showing the internalization of an HT29-V2 cell by an HT29-SDCSC-C2 cell—scale bar = 10 μm.
Figure 2
Figure 2
Increased generation of homotypic CIC structures upon anti-PD-L1 antibody administration. (A). Histograms showing the frequency of CIC structures 48 h after initial cell seeding in basal RPMI-1640 medium. The data are presented as the means ± sems. *P < 0.05; ns, not significant. N = 3. (B). Percentages of CIC structure subtypes among mCherry-carrying SDCSCs and Venus-carrying CRC cells in the presence of the indicated unlabeled immune cells. There were 400 (no immune cells), 76 (dHL60), 58 (THP1-M1), 96 (THP1-M2), and 329 (Jurkat) CIC structures counted when coculturing HCT15-V2, HCT15-SDCSC-C2, and the indicated immune cells. When HT29-V2, HT29-SDCSC-C2, and the indicated immune cells were cocultured, 361 (no immune cells), 155 (dHL60), 177 (THP1-M1), 151 (THP1-M2), and 538 (Jurkat) CIC structures were counted. R(G), CIC structures with outer mCherry-SDCSCs and inner Venus-CRC cells. The data are presented as the means ± sems. *P < 0.05; **P < 0.01; ***P < 0.001. #, not detected. N = 3. (C). Histograms showing the frequency of CIC structures after 48 h of culture in the presence of therapeutic antibodies. IgG, IgG control; CTX: cetuximab (Erbitux); αPD-L1, anti-PD-L1 antibody. The data are presented as the means ± sems. **P < 0.01; ns, not significant. N = 3. (D). Percentages of CIC structure subtypes among mCherry-carrying SDCSCs and Venus-carrying CRC cells in the presence of therapeutic antibodies. A total of 318 (IgG), 328 (CTX), and 467 (αPD-L1) CIC structures were counted when HCT15-V2, HCT15-SDCSC-C2, and the indicated antibodies were cocultured. When HT29-V2, HT29-SDCSC-C2, and the indicated antibodies were cocultured, 412 (IgG), 591 (CTX), and 538 (αPD-L1) CIC structures were counted. R(G), CIC structures with outer mCherry-SDCSCs and inner Venus-CRC cells. The data are presented as the means ± sems. *P < 0.05; **P < 0.01; ***P < 0.001. #, not detected. N = 3.
Figure 3
Figure 3
SDCSCs experiencing a homotypic CIC structure resist NK-92MI cytotoxicity. (A). Histogram showing the relative viability of the indicated CRC cells. Loss of the fluorescence signal was considered cell death at the end of time-lapse imaging. The data are presented as the means ± sds. **P < 0.01, ***P < 0.001; ns, not significant. N = 5. (B). Representative time-lapse images of the fates of CIC structures formed by mCherry-expressing HT29-SDCSCs and Venus-labeled HT29 cells. Scale bar = 10 μm. (C). A histogram showing CIC structure cell fate in the presence or absence of NK-92MI cells. The data are presented as the means ± sems. **P < 0.01; ***P < 0.001. #, not detected. N = 5. The CIC structure is unchanged through time-lapse imaging; Escape, the release of inner cells; Inner dead, the inner cell is dead in a CIC structure; Inner proliferation, the inner cell is divided within a CIC structure. (D). Histogram showing the relative viability of the indicated mCherry-labeled HT29-SDCSCs in the presence of NK-92MI treatment. Cells that lived longer than the average survival time of singlet HT29-SDCSC-C2 cells in the presence of NK-92MI treatment during time-lapse imaging were considered alive, and loss of the fluorescence signal was considered cell death. In total, 105 (single HT29-SDCSC-C2), 10 (outer HT29-SDCSC-C2 cells in a CIC structure), and 42 (single HT29-SDCSC-C2 cells released from R(G) CIC structures) cells were analyzed. The data are presented as the means ± sds. **P < 0.01, ***P < 0.001. N = 4-5, as indicated by the number of dots in the histogram. (E). The histogram shows the CIC structure cell fate of HCT15 cells in the presence or absence of NK-92MI cells. The data are presented as the means ± sems. ns, not significant; #, not detected. N = 3. The CIC structure is unchanged through time-lapse imaging; Escape, the release of inner cells; Inner dead, the inner cell is dead in a CIC structure; Inner proliferation, the inner cell is divided within a CIC structure. (F). Histogram showing the relative viability of the indicated mCherry-labeled HCT15-SDCSCs in the presence of NK-92MI treatment. Cells that lived longer than the average survival time of singlet HCT15-SDCSC-C2 cells in the presence of NK-92MI treatment during time-lapse imaging were considered alive, and loss of the fluorescence signal was considered cell death. In total, 204 (single HCT15-SDCSC-C2), 0 (outer HCT15-SDCSC-C2 in a CIC structure), 28 (single HCT15-SDCSC-C2 cells released from R(G) CIC structures due to inner cell escape), and 12 (single HCT15-SDCSC-C2 cells released from R(G) CIC structures due to inner cell death) cells were analyzed. The data are presented as the means ± sds. **P < 0.01; ns, not significant; #, not detected. N = 3.
Figure 4
Figure 4
Knocking down RAC1 in SDCSCs does not suppress CIC frequency or outer cell fate. (A). Representative images showing RAC1-GTP and total RAC1 expression in parental cells (P) and SDCSCs (S). M.W., molecular weight. (B). Representative images showing phosphorylated MLC2 (Ser19) and total MLC2 expression in parental cells (P) and SDCSCs (S). (C). Representative images showing total RAC1 expression in HCT15-SDCSCs receiving scrambled control shRNA (Ctrl) or shRNAs targeting RAC1 (KD1 and KD2). (D). Representative images showing phosphorylated MLC2 (Ser19) and total MLC2 expression in the indicated cells. (E). Frequency of CIC structures generated by Venus-labeled parental cells and the indicated mCherry-marked HCT15-SDCSCs (pLKO.1 control and two RAC1-silenced SDCSCs, i.e., KD1 and KD2) in RPMI basal medium for 24 h. Data are presented as the means ± sems. *P < 0.05, ***P < 0.001. ns, nonsignificant. N = 3. (F). Percentages of inner/outer cell fates of HCT15-SDCSCs carrying pLKO.1 control or shRNAs targeting RAC1 (KD1 and KD2) 24 h after cell seeding. In total, 90 (pLKO.1), 119 (KD1), and 129 (KD2) CIC structures were counted when coculturing HCT15 parental cells (V2) and the indicated HCT15-SDCSCs (C2). The data are presented as the means ± sems. *P < 0.05, **P < 0.01. ns, nonsignificant. N = 3. (G). The frequency of CIC structures generated by Venus-labeled parental cells indicated that mCherry-marked HT29-SDCSCs were present in the RPMI basal medium for 24 h. Data are presented as the means ± sems. **P < 0.01. ns, nonsignificant. N = 3. (H). Percentage of inner/outer cell fates of HT29-SDCSCs carrying pLKO.1 control or shRNAs targeting RAC1 24 h after cell seeding. In total, 59 (pLKO.1), 53 (KD1), and 72 (KD2) CIC structures were counted when HT29 parental cells (V2) and the indicated HT29-SDCSCs (C2) were cocultured. The data are presented as the means ± sems. ns, nonsignificant. N = 3. (I). Representative images of CIC structure formation by mCherry-carrying HT29-SDCSCs receiving pLKO.1 control or shRNAs targeting RAC1 and Venus-labeled CRC cells after 24 h of cultivation in basal RPMI-1640 medium. White arrow, CIC structure. Two representative images from three independent assays are shown. Scale bar = 10 μm.
Figure 5
Figure 5
Overexpression of STMN1 in SDCSCs reduces CIC structure frequency and outer cell fate. (A-B). Western blots confirm the expression of flag-tagged STMN1 in HT29-SDCSCs (A) and HCT15-SDCSCs (B). (C). The frequency of CIC structures in the coculture of Venus-labeled parental cells and vector-treated or STMN1-overexpressing mCherry-marked SDCSCs (in RPMI basal medium for 24 h). The data are presented as the means ± sems. *P < 0.05. N = 3. (D). Percentages of inner/outer cell fates of SDSCCs carrying pLenti vector or overexpressing STMN1 24 h after cell seeding. In total, 176 (pLenti vec) and 150 (pLenti STMN1) CIC structures were counted when coculturing HT29 parental cells (V2) and the indicated HT29-SDCSCs (C2). A total of 294 (pLenti vec) and 125 (pLenti STMN1) CIC structures were counted when HCT15 parental cells (V2) and the indicated HCT15-SDCSCs (C2) were cocultured. The data are presented as the means ± sems. *P < 0.05, **P < 0.01. N = 3. (E). Representative images of CIC structure formation by mCherry-carrying HT29 SDCSCs and Venus-labeled HT29 CRC cells at 24 h under basal RPMI-1640 medium cultivation. White arrow, CIC structure. Two representative images from three independent assays are shown. (F). The viability of SDCSCs carrying pLenti vector or overexpressing STMN1 upon coculture with NK-92MI cells for 24 h (HT29-SDCSCs) or 3 h (HCT15-SDCSCs) at the indicated effector (E): target cell (T) ratios. The data are presented as the means ± sds. *P < 0.05. N = 3.
Figure 6
Figure 6
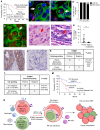
CIC structures in human colorectal cancer specimens were correlated with poor tumor differentiation, low STMN1 expression, and inferior prognosis. (A). The Kaplan‒Meier plot shows the probability of disease-free survival (DFS) in the indicated CRC patients. (B). Double immunofluorescence revealed that most CIC structures are formed by cytokeratin (CK, green)-positive carcinoma cells as inner and outer cells. Scale bar = 20 μm. (C). The image shows only one CIC structure containing a CD45 (red)-positive hematopoietic cell found in three cases. Scale bar = 20 μm. (D). CIC structures formed between CK-positive inner and outer cells represent 29 of the 30 CIC structures observed in three cases. (E). A single-plane image from three-dimensional imaging indicates a genuine cell-within-cell structure. Scale bar = 10 μm. (F). A representative image shows the CIC structure in poorly differentiated adenocarcinoma. Scale bar = 20 μm. (G). The image shows the CIC structure in well- to moderately differentiated cases. Scale bar = 20 μm. (H). The histogram shows the CIC structure counting in CRC samples. The data are presented as the means ± sds. ***P < 0.001. (I). A representative immunohistochemistry image shows a moderately differentiated case that strongly expresses the STMN1 protein. Scale bar = 100 μm. (J). A poorly differentiated case is STMN1 negative. Scale bar = 100 μm. (K). The poorly differentiated cases were more likely to be STMN1 negative. (L). Patients with at least 1 CIC per 10 hpf are more likely to be STMN1 negative than those with less than 1 CIC per 10 hpf. hpf, high-power field. (M). The Kaplan‒Meier plot shows the DFS of CRC patients with at least 1 CIC per 10 hpf (CIC structure positive) and those with less than 1 CIC (CIC structure negative). (N). Schematic model illustrating the mechanism of CRCSC-associated homotypic CIC structure formation and its role in cancer progression.

References

    1. Whiteside TL. The tumor microenvironment and its role in promoting tumor growth. Oncogene. 2008;27:5904–12. - PMC - PubMed
    1. Peinado H, Aleckovic M, Lavotshkin S, Matei I, Costa-Silva B, Moreno-Bueno G. et al. Melanoma exosomes educate bone marrow progenitor cells toward a pro- metastatic phenotype through MET. Nat Med. 2012;18:883–91. - PMC - PubMed
    1. Chen G, Huang AC, Zhang W, Zhang G, Wu M, Xu W. et al. Exosomal PD-L1 contributes to immunosuppression and is associated with anti-PD-1 response. Nature. 2018;560:382–6. - PMC - PubMed
    1. Joyce JA, Pollard JW. Microenvironmental regulation of metastasis. Nat Rev Cancer. 2009;9:239–52. - PMC - PubMed
    1. Overholtzer M, Brugge JS. The cell biology of cell-in-cell structures. Nat Rev Mol Cell Biol. 2008;9:796–809. - PubMed

MeSH terms