. 2025 Mar 29;15(10):4785-4807.
doi: 10.7150/thno.104179. eCollection 2025.

Deciphering single-cell landscape unravels cell-type-specific functional roles of RNA m6A modification in atherosclerosis

Affiliations

Deciphering single-cell landscape unravels cell-type-specific functional roles of RNA m6A modification in atherosclerosis

Xiaorui Ping et al. Theranostics. .

Abstract

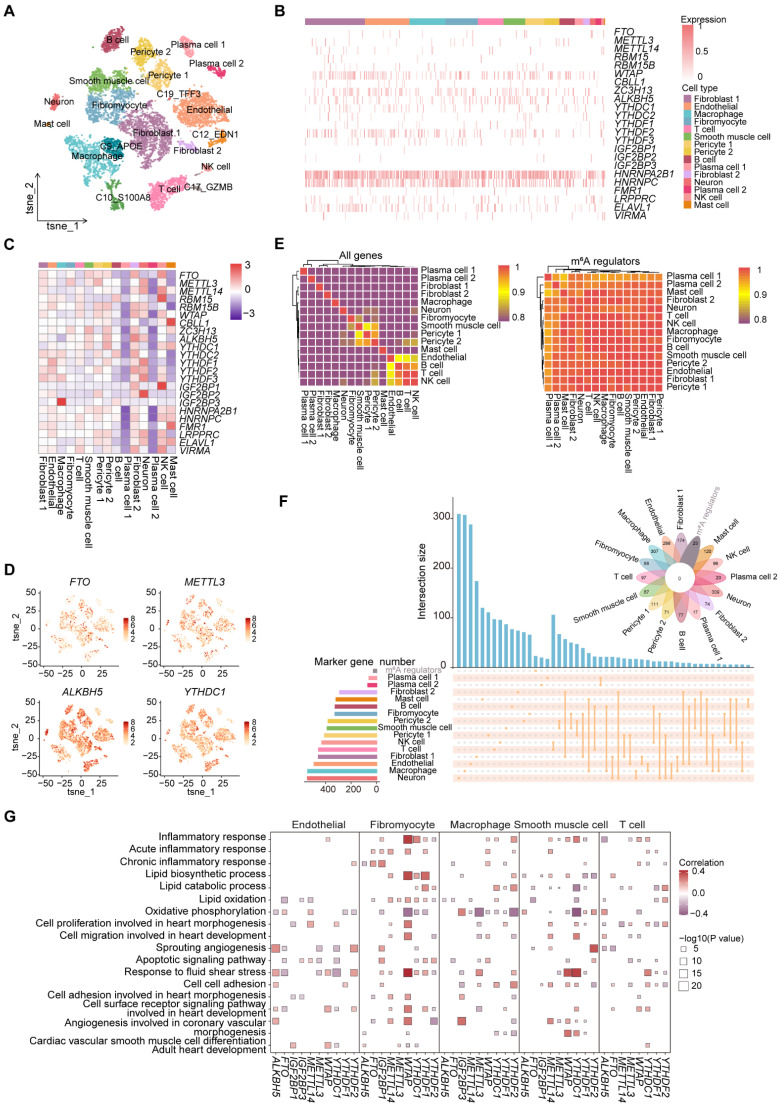
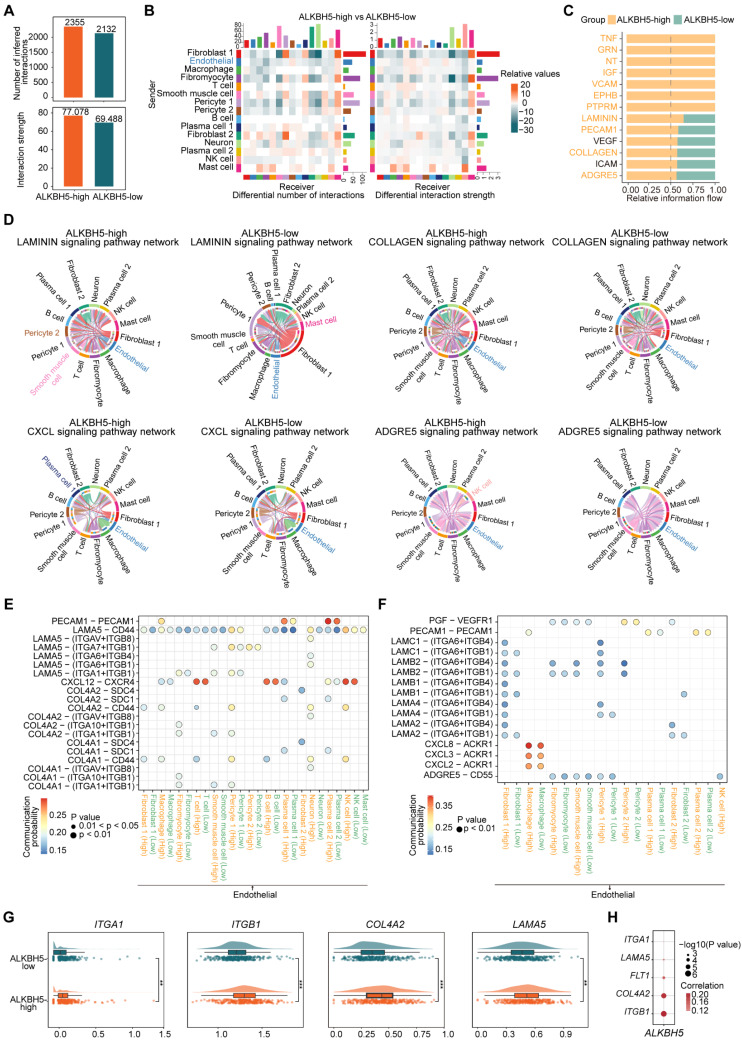
Background: Atherosclerosis is a chronic inflammatory disease that is the major cause of mortality worldwide. Although several studies have assessed the function of m6A (N6-methyladenosine) modification in atherosclerosis, its regulatory mechanism at the single-cell level remains unclear. This study provides a comprehensive single-cell atlas of m6A modification regulating cell-type-specific functions in atherosclerosis. Methods: We analyzed single-cell sequencing data derived from atherosclerosis patients to elucidate the influence of m6A modification on diverse cell types. We demonstrated the potential regulatory functions of m6A regulators across various cell types and key transcription factors involved. Furthermore, we discovered m6A regulators mediated intercellular communication in important biological processes. In vitro experiments were conducted to further investigate the effects of ALKBH5, WTAP and METTL3 on atherosclerosis. Results: ALKBH5 upregulated in endothelial cells induced cell proliferation and migration involved in sprouting angiogenesis. In smooth muscle cells, upregulation of WTAP enhanced proliferation, migration and phenotypic transformation. Upregulation of METTL3 and YTHDF2 promoted macrophage activation and differentiation. Furthermore, we identified abnormally activated transcription factors could regulate m6A regulators in a cell-type-specific manner. Moreover, we revealed that m6A regulators were implicated in dysregulated intercellular communication in atherosclerosis. And a series of experimental validations supported the conclusion that m6A regulators exert cell-type-specific regulatory functions. Conclusion: Our study provided evidence for the roles of ALKBH5, WTAP and METTL3 in orchestrating atherosclerotic cell-type-specific functions, representing promising targets for precision medicine.

Keywords: Atherosclerosis; Endothelial cell; Macrophage; Single-cell; Smooth muscle cell; m6A.


Conflict of interest statement

Competing Interests: The authors have declared that no competing interest exists.

Figures

Figure 1
Figure 1
Expression profile of m6A regulators in atherosclerotic cell types. (A) The t-SNE projection of 11,722 single cells from atherosclerotic patients, with 20 main cell clusters shown in different colors. Each dot corresponds to one single cell, colored according to cell type. (B) Distribution of m6A regulators across different identified cell types. (C) Heatmap showing the average expression of m6A regulators in major cell types. (D) T-SNE projections of 20 clusters, with each cell colored by the relative normalized expression of m6A regulators. (E) Heatmap showing the expression patterns of different cell types based on all genes (left) and m6A regulators (right). (F) Upset and venn plots showing the intersection between marker genes of different cell types and m6A regulators. (G) Correlation analysis between signatures of disease-related pathways and the expression levels of m6A regulators in key cell types. P value was calculated by Pearson correlation.
Figure 2
Figure 2
ALKBH5 regulates EC proliferation and migration involved in the signaling pathway of sprouting angiogenesis. (A) Dot plot showing the correlation between signatures of disease-related pathways and the expression levels of key m6A regulators in ECs. P value was calculated by Pearson correlation. (B) Correlations between the expression of ALKBH5 and signatures of EC-related functional pathways. (C) Violin plots showing the expression levels of NRP1 and FGF2 in ALKBH5-high group and ALKBH5-low group. The statistical differences between the groups were determined through Wilcoxon rank test. (D) Volcano plot showing DEGs between ALKBH5-high group and ALKBH5-low group. Significant DEGs were shown in orange (upregulation) or cyan (downregulation). (E) Bar chart showing the results of GSEA. NES, normalized enrichment score. Brown represents upregulated pathways and green represents downregulated pathways. (F) Module feature plot showing the distribution of turquoise module. Sorted based on the values of hMEs, with the color depth of the points indicating the level of hMEs values. (G) ALKBH5 co-expressed genes network showing the top 30 hub genes within the turquoise module. Each node in the graph represents a gene, and each edge represents a co-expression relationship, with the opacity of the edges scaled according to the strength of the co-expression relationship. (H) The correlation between signatures of pathways related to ECs proliferation and migration and gene modules. (I) Sankey diagram showing TFs regulating the expression levels of m6A regulators.
Figure 3
Figure 3
ALKBH5 regulates ligand-receptor pairs associated with ECs phenotypic activation. (A) The total number of interactions and the interaction intensity of the inferred cell-cell communication networks in ALKBH5-high and ALKBH5-low groups. (B) Heatmaps showing the differences in the number or intensity of interactions between all cell types in ALKBH5-high group and ALKBH5-low group. Orange represents an increase in ALKBH5-low group compared to ALKBH5-high group, while green represents a decrease. The colored bar graph at the top represents the total value of each column displayed in the heatmap (incoming signal). The colored bar graph on the right represents the total value of each row (outgoing signal). (C) Comparison of several signaling pathways in ALKBH5-high and ALKBH5-low groups. (D) Chord plots showing the signaling pathways (LAMININ, COLLAGEN, CXCL, ADGRE5) of aggregated cell-cell communication networks at the signaling pathway level in ALKBH5-high and ALKBH5-low groups. Cell types with altered communication were colored. (E) Comparison of specific ligand-receptor pairs from ECs to other cell types between ALKBH5-high group and ALKBH5-low group. (F) Comparison of specific ligand-receptor pairs from other cell types to ECs between ALKBH5-high group and ALKBH5-low group. (G) Violin plots showing the expression levels of ligand and receptor genes in ALKBH5-high group and ALKBH5-low group. The statistical differences between the groups were determined through Wilcoxon rank test. (H) Correlations between the expression levels of ALKBH5 and ligand-receptor genes. P value was calculated by Pearson correlation.
Figure 4
Figure 4
The upregulation of ALKBH5 in HCAECs in response to ox-LDL stimulation promotes angiogenesis. (A) Representative western blot images of ALKBH5 levels in control and HCAECs treated with 50 μg/mL ox-LDL at 48 hours. (B) Quantification of ALKBH5 levels in control and HCAECs treated with 50 μg/mL ox-LDL at 48 hours (n=3). (C) Representative immunofluorescence images to detect ALKBH5 expression in 50 μg/mL ox-LDL-induced HCAECs at 48 hours. Scale bars, 20 μm. (D) Dot blot assay using an anti-m6A antibody in 50 μg/mL ox-LDL-induced HCAECs. MB staining was included as a loading control. Total RNA concentration: 400 ng/μL, 200 ng/μL, 100 ng/μL. (E) Cell proliferation was measured by EdU staining. (F) The percentage of EdU-positive HCAECs (red) was quantified (n=3). Scale bars, 20 μm. (G) HCAECs migration ability was measured by the Scractch Closure assay. (H) Quantifications of relative migration area of HCAECs were made (n=3). Scale bars, 500 μm. (I) HCAECs migration ability was measured by the Transwell assay. (J) Quantifications of migration cell number of HCAECs were made (n=3). Scale bars, 100 μm. (K) Images of the tube formation assay. (L) Quantitative analysis of the tube length and branches number (n=3). Scale bars, 100 μm. Data are presented as mean±SD. T test followed by a Normality test was used.
Figure 5
Figure 5
WTAP specifically regulates the proliferation and migration of SMCs. (A) Correlation analysis between the expression levels of selected m6A regulators and signatures of disease-related pathways in SMCs. P value was calculated by Pearson correlation. (B) Correlations of WTAP expression with signatures of “Vascular associated smooth muscle proliferation” and “Smooth muscle cell migration” pathways. P value was calculated by Pearson correlation. (C) Violin plots showing the expression levels of NR4A3 and PRKG1 in WTAP-high group and WTAP-low group. The statistical differences between two groups were determined through Wilcoxon rank test. (D) Volcano plot showing DEGs in WTAP-high group and WTAP-low group. Significant DEGs were shown in orange (upregulation) and purple (downregulation). (E) Representative GO terms and pathways of upregulated genes in WTAP-high group. (F) GSEA showing three SMC-related pathways. (G) Gene modules detected through hdWGCNA in atherosclerotic SMCs. (H) Overall expression levels of hMEs in different modules within SMCs. (I) WTAP co-expressed genes network showing the top 30 hub genes (left, network) and top 10 hub genes ranked by kME (right) within the turquoise module. In the network, each node represents a gene and each edge represents a co-expression relationship, with the opacity of the edges scaled according to the strength of the co-expression relationship. (J) Disease-related pathways enriched by 200 genes ranked by kME within the turquoise module. (K) Correlation of all gene modules with WTAP and signatures of SMC-related signaling pathways. (L) Heatmap showing the TFs that regulate m6A regulators in SMCs.
Figure 6
Figure 6
WTAP regulates the phenotypic transformation of SMCs. (A) T-SNE plot showing the subclusters of SMCs. (B) Projection of the pseudotime trajectory onto the t-SNE plot. (C) The order of SMC1 and SMC2 along the pseudotime axis in the 2D state space defined by Monocle2. The orders of the cells were inferred from the expression of the top 100 DEGs using “FindAllMarkers” function, with each point corresponding to a single cell. (D) The expression level of WTAP and signature score of “Phenotypic switching” pathway. The statistical differences between two groups were determined through t-test. (E) Heatmap showing gene expression profiles alongside the pseudotime of SMC1 and SMC2, which were divided into two clusters based on their expression patterns (left). The enriched GO pathways corresponding to the heatmap clustering were shown on the right. Blue represents cluster 1 and red represents cluster 2. (F) AUCell scores of disease-related pathways enriched along the evolutionary trajectory of SMCs. (G) Correlations between the expression level of WTAP and signatures of disease-related pathways in SMCs. (H) Dynamic alterations in WTAP and other key genes during phenotypic transformation. (I) Correlations between the expression levels of WTAP and phenotypic-related genes, as well as metabolism-related genes in SMCs.
Figure 7
Figure 7
METTL3 regulates the activation, differentiation and the intercellular communication of macrophages. (A) Dot plot showing the correlation between signatures of disease-related pathways and the expression levels of key m6A regulators in macrophages. P value was calculated by Pearson correlation. (B) Correlations between the expression of METTL3 and YTHDF2 with signatures of macrophage-related functional pathways. (C) Volcano plot showing DEGs between METTL3-high group and METTL3-low group. Significant DEGs are shown in orange (upregulation) or blue (downregulation). (D) Representative GO terms and pathways of upregulated genes in METTL3-high group. (E) GSEA showing three macrophage-related pathways. (F) METTL3 co-expressed genes network showing the top 25 hub genes within the green module. Each node in the graph represents a gene, and each edge represents a co-expression relationship, with the opacity of the edges scaled according to the strength of the co-expression relationship. (G) The correlation between gene modules and METTL3, as well as the signaling pathways related to macrophages. (H) Network plot showing TFs regulating m6A regulators. m6A regulators are located in the central pink box surrounded by TFs. TFs regulating METTL3 expression are colored pink, and those for YTHDF2 expression are green. (I) Comparison of the number of interactions between all cell types in METTL3-high and METTL3-low groups. (J) Comparison of several signaling pathways in METTL3-high and METTL3-low groups. (K) Chord plot showing TNF signaling pathway of cell-cell communication network present only in METTL3-high group. (L) Comparison of specific ligand-receptor pairs from macrophages to other cell types between METTL3-high group and METTL3-low group. (M) Chord diagram showing the upregulated ligand-receptor pairs of the TNF signaling pathway.

Similar articles

References

    1. Björkegren JLM, Lusis AJ. Atherosclerosis: recent developments. Cell. 2022;185:1630–1645. - PMC - PubMed
    1. Libby P, Buring JE, Badimon L, Hansson GK, Deanfield J, Bittencourt MS. et al. Atherosclerosis. Nat Rev Dis Primers. 2019;5:56. - PubMed
    1. Stroope C, Nettersheim FS, Coon B, Finney AC, Schwartz MA, Ley K. et al. Dysregulated cellular metabolism in atherosclerosis: mediators and therapeutic opportunities. Nat Metab. 2024;6:617–638. - PMC - PubMed
    1. Lin A, Miano JM, Fisher EA, Misra A. Chronic inflammation and vascular cell plasticity in atherosclerosis. Nat Cardiovasc Res. 2024;3:1408–1423. - PubMed
    1. Hahn C, Schwartz MA. Mechanotransduction in vascular physiology and atherogenesis. Nat Rev Mol Cell Biol. 2009;10:53–62. - PMC - PubMed

MeSH terms