. 2025 Mar 21;15(10):4614-4637.
doi: 10.7150/thno.111130. eCollection 2025.

The basolateral amygdala-anterior cingulate cortex circuit contributes to postherpetic neuralgia-anxiety comorbidity

Affiliations

The basolateral amygdala-anterior cingulate cortex circuit contributes to postherpetic neuralgia-anxiety comorbidity

Xiaofeng Jiang et al. Theranostics. .

Abstract

Background: Postherpetic neuralgia (PHN) causes chronic pain and emotional dysfunction, but its underlying mechanisms are unknown. Methods: We first compared the structural and functional magnetic resonance imaging (MRI) of PHN-anxiety patients with healthy controls (HCs). Then, we created a PHN comorbid anxiety-like model by injecting resiniferatoxin (RTX) intraperitoneally and used Fos-CreER::Ai9 mice to validate brain regions with volume differences in MRI. Furthermore, we combined behavioral experiments with electrophysiology, viral tracing, in vivo fiber-photometry, optogenetics, and chemogenetics, to analyze the role of the basolateral amygdala (BLA)-anterior cingulate cortex (ACC) circuit in PHN comorbid anxiety-like mice multi-dimensionally. Results: According to neuroimages, patients with PHN-anxiety comorbidity have decreased amygdala volume and decreased functional connection (FC) of the BLA and ACC. Furthermore, we created a PHN comorbid anxiety-like model by injection of RTX intraperitoneally, and these mice showed dysesthesia and anxiety-like behaviors 3 weeks after RTX injection. Then, we discovered that BLA and ACC were related to PHN comorbid anxiety-like behaviors using Fos-CreER::Ai9 mice. Immunohistochemistry and electrophysiology revealed enhanced activation of BLA glutamatergic (BLAGlu) neurons in PHN comorbid anxiety-like mice. Opto/chemogenetic activating BLAGlu neurons aggravated pain threshold in PHN comorbid anxiety-like mice. Inhibiting BLAGlu alleviates mechanical nociception, thermal hyperalgesia, and anxiety-like behavior. Moreover, the elevated excitability of BLAGlu neurons resulted in increased excitatory inputs to the ACC. Selective activation or inhibition of the BLAGlu-ACC pathway exacerbated or alleviated the pain and anxiety behavior, respectively. Conclusion: Findings in this study will provide new insight for understanding the central pathomechanism underlying PHN-anxiety comorbidity, as well as serve as solid theoretical underpinnings for the management of PHN.

Keywords: Anterior cingulate cortex; Basolateral amygdala; Neural circuit; Postherpetic neuralgia; fMRI.


Conflict of interest statement

Competing Interests: The authors have declared that no competing interest exists.

Figures

Figure 1
Figure 1
Structural and functional changes in the amygdala in PHN-anxiety comorbidity patients compared to HCs. (A) Compared to HCs, PHN-anxiety comorbidity patients had lower GM volumes in brain areas such as the bilateral amygdala/hippocampus, middle frontal gyrus, and fusiform gyrus (p < 0.05, FWE-corrected, k > 100 voxels). The most substantial reduction in GM volume was observed in the bilateral amygdala/hippocampus. (B) Seeds for the connectivity analyses correspond to the three subregions of the amygdala. (C) When the left BLA was used as a seed point, brain areas in PHN-anxiety had significantly reduced FC than in HC. (D) Comparison of FC values between the two groups of subjects (t = 3.137, p = 0.002). (E-F) Correlation of FC values with VAS and HAMA scores. (G) When the right BLA was used as a seed point, brain areas in PHN-anxiety comorbidity had significantly reduced FC than in HCs. (H) Comparison of FC values between the two groups of subjects (t = 4.799, p < 0.001). (I-J) Correlation of FC values with VAS and HAMA scores. (K-L) When the left CMA was used as a seed point, brain areas in PHN-anxiety had significantly reduced FC than in HC (t = 7.239, p < 0.001). (M-N) Correlation of FC values with VAS and HAMA scores. (O) When the right CMA was used as a seed point, brain areas in PHN-anxiety patients had significantly reduced FC than in HCs. (P) Comparison of FC values between the two groups of subjects (t = 2.215, p = 0.029). (Q-R) Correlation of FC values with VAS and HAMA scores. BLA, basolateral amygdala; CMA, central medial amygdala; SFA, superficial amygdala. (*p < 0.05, **p < 0.01, ***p < 0.001).
Figure 2
Figure 2
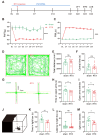
Intraperitoneal injection of RTX leads to PHN comorbid anxiety-like behaviors. (A) Intraperitoneal injection of RTX and experimental timeline. Mechanical threshold (B) and the thermal paw withdrawal latency (C) in sham and RTX mice (two-way ANOVA, F(8, 56) = 58.47, p < 0.0001; n = 11 mice/group). (D) Representative trace of OFT in sham mice and RTX mice. Statistical analysis of total distance traveled (E) and center time (F) in the OFT of mice 3 weeks after solvent or RTX injection (total distance traveled t = 0.439, p = 0.672; center time t = 0.011, p = 0.991). (G) Representative diagrams of the EPM in sham and RTX mice. (H) Time spent in the open arm (t = 2.423, p = 0.025) and (I) number of entries into the open arm (t = 2.433, p = 0.024) in the EPM test. (J) Schematic representation of the LDB experiment. (K) Time spent in the light box in sham and RTX mice (t = 3.232, p = 0.004), (L) latency to enter the light box (U = 53, p = 0.652), and (M) number of entries into the bright box (t = 2.689, p = 0.014) (n = 11 mice/group). (*p < 0.05, **p < 0.01, ***p < 0.001).
Figure 3
Figure 3
PHN comorbid anxiety-like-dependent neuron labeling. (A) Experimental flowchart. (B) Representative images showing Fos-CreER::Ai9 positive neurons in the BLA, ACC, mPFC, IC, LHb, PVT, and vHIP in Fos-CreER::Ai9 mice (scale bars, 200 μm). (C) Statistical plots of mean c-fos per square millimeter in different brain regions in the sham and PHN comorbid anxiety-like group (6 brain slices of 3 mice in each group, BLA: t = 4.707, p = 0.0012, ACC: t = 3.268, p = 0.0085, mPFC: t = 3.171, p = 0.010, IC: t = 0.547, p = 0.596, LHb: t = 0.416, p = 0.686, PVT: t = 0.494, p = 0.632, vHIP: t = 1.784, p = 0.105). (*p < 0.05, **p < 0.01).
Figure 4
Figure 4
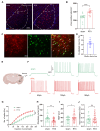
Increased excitability of BLAGlu neurons in PHN comorbid anxiety-like mice. (A) Representative plots of immunohistochemical c-fos of BLA in sham vs PHN comorbid anxiety-like mice, scale bar 100 μm; (B) Statistical plots of mean c-fos per square millimeter of the BLA in both groups (14 brain slices of 4 mice in each group, t = 8.862, p < 0.001); (C) Representative plots of c-fos co-labeled with glutamate in the BLA brain region and (D) statistical graph (8 brain slices from 3 mice), scale bar 50 μm; (F) Representative graphs of action potential spikes recorded from BLAGlu neurons in sham and PHN comorbid anxiety-like mice (E, F) and statistical graphs of the data (G) (6 mice in the sham group with a total of 20 neurons, and 7 mice in the PHN comorbid anxiety-like mice with a total of 37 neurons; F(13, 209) = 6.283, p < 0.0001). (H) Rheobase current (t = 3.091, p = 0.003), (I) RMP (t = 2.104, p = 0.040), and (J) Rin (t = 0.782, p = 0.437) in the sham and PHN comorbid anxiety-like group. (*p < 0.05, **p < 0.01, ***p < 0.001).
Figure 5
Figure 5
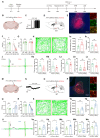
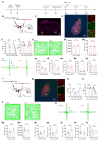
Chemogenetic activation or inhibition of BLAGlu neurons alters pain and anxiety-like behaviors in PHN comorbid anxiety-like mice. (A) Experimental flowchart of chemogenetic activation. (B) Schematic diagram of AAV-CaMKIIα-hM3dq-mCherry virus injected in BLA and in vitro electrophysiology. (C) Whole-cell current clamp recordings of BLA show that CNO perfusion resulted in depolarization of BLA neurons expressing hM3dq. (D) Schematic of chemogenetic activation of BLAGlu neurons in PHN comorbid anxiety-like mice and (E) representative chart of viral expression with a scale bar of 200 μm; white box magnified area with a scale bar of 20 μm. (F) Mechanical thresholds after stereotactic injection of control or hM3dq virus and intraperitoneal injection of CNO in PHN comorbid anxiety-like mice (Comparing before and after CNO injection, p was 0.250 and 0.008 in mCherry or hM3dq-mCherry group, respectively) and (G) latency of thermal paw withdrawal (Comparing before and after CNO injection, p was 0.609 and > 0.999 in mCherry or hM3dq-mCherry group, respectively) (n = 8 mice/group). (H) Representative plots of OFT trace in mCherry or hM3dq-mCherry group after CNO injection. (Ia) Total distance traveled (t = 1.834, p = 0.089) and (Ib) time in the central region (t = 0.012, p = 0.991) of the OFT in both groups of mice after CNO injection (n = 8 mice/group). (J) Representative plots of exploration trace in the EPM in mCherry or hM3dq-mCherry group after CNO injection. (Ka) Time spent in the open arm of the EPM (t = 1.333, p = 0.204) and (Kb) number of times entry the open arm (t = 1.301, p = 0.214) in both groups after injection of CNO. In the LDB, (La) both groups of mice spent time in the lightbox (t = 1.627, p = 0.126), (Lb) latency to enter the lightbox (U = 30, p = 0.878), and (Lc) number of times entering the lightbox (t = 1.936, p = 0.073) (n = 8 mice/group). (M) Schematic diagram of electrophysiology after injection of AAV-CaMKIIα-hM4di-mCherry virus in the BLA. (N) BLA whole-cell membrane clamp recordings show that CNO perfusion resulted in hyperpolarization of BLA neurons expressing hM4di. (O) Schematic of chemical genetic inhibition of BLAGlu neurons in PHN comorbid anxiety-like mice and (P) Representative chart of viral expression, scale bar 200 μm, white box magnified area scale bar 20 μm. (Q) Mechanical thresholds of PHN comorbid anxiety-like mice after injection of control or hM4di viruses and intraperitoneal injection of CNO (Comparing before and after CNO injection, p > 0.999 and p = 0.031 in mCherry or hM4di-mCherry group, respectively) and (R) latency of thermal paw withdrawal (Comparing before and after CNO injection, p = 0.187 and p = 0.016 in mCherry or hM4di-mCherry group, respectively) (n = 7 mice/group). (S) Representative plots of OFT trace in mCherry or hM4di-mCherry after CNO injection. (Ta) Total distance (t = 1.569, p = 0.143) and (Tb) time in the central region (t = 3.572, p = 0.004) of the OFT in both groups of mice after CNO injection (n = 7 mice/group). (U) Representative plots of exploration trace in the EPM of PHN comorbid anxiety-like mice with mCherry or hM4di-mCherry and injection of CNO. (Va) The time spent in the open arm of the EPM (t = 1.837, p = 0.091) and (Vb) the number of times entered the open arm (t = 2.189, p = 0.049) in both groups after CNO injection. In the LDB experiment, (Wa) the duration of stay in the lightbox (t = 2.844, p = 0.015), (Wb) latency to enter the lightbox (U = 23, p = 0.877), and (Wc) number of entries into the lightbox (t = 1.633, p = 0.128) in both groups of mice (n = 7 mice/group). (*p < 0.05, **p < 0.01, ***p < 0.001).
Figure 6
Figure 6
Dissection of the BLAGlu-ACC circuit. (A) Schematic of BLA virus tracing in WT mice (left), representative chart of ChR2 virus expressing in BLA (center), and example chart of BLA projection fibers in ACC (right), scale bar 500 μm. (B) Schematic of ACC injected retrograde virus tracing in WT mice (left), representative chart of viral injection sites (center), and virus expression in BLA (right), scale bar 500 μm. (C) Representative chart of BLA neurons co-labeled with glutamate from ACCGlu retrograde tracing and (D) quantitative analysis (n = 3 mice, total of 8 brain slices), scale bar 50 μm. (E) Representative map of BLA neurons co-labeled with c-fos in retrograde labeling of BLA neurons from ACC pyramidal neurons in PHN comorbid anxiety-like mice, scale bar 100 μm; the white box denotes the zoomed-in BLA area shown, scale bar 20 μm and (F) graph of the analysis of the co-labeled rate of the two (c-fos co-stained with mCherry in about 69.59% of all c-fos+ neurons; c-fos co-stained with mCherry in about 94.69% of all mcherry+ neurons) (n = 4 mice, total of 12 brain slices). (G) Optogenetically activated virus was injected in the BLA and electrophysiologic recordings were performed on ACC pyramidal neurons. (H) Schematic of BLA projecting terminal and Neurobiotin-labeled neurons in ACC. (I) The oEPSC recorded in ACC was blocked by CNQX and (J) statistical graph (p = 0.0003) (n = 3 mice, 6 neurons in total). (K) oEPSC was completely blocked by TTX and rescued with 4-AP, and (L) corresponding statistical graphs (ACSF vs TTX p = 0.031, TTX vs TTX+4-AP p = 0.001) (n = 3 mice, 6 neurons in total). (*p < 0.05, **p < 0.01, ***p < 0.001).
Figure 7
Figure 7
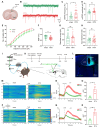
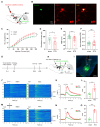
Increased excitability of ACC glutamatergic neurons in PHN comorbid anxiety-like mice. (A) Schematic diagram of in vitro electrophysiology of ACC slices. (B) Representative charts of mEPSC in sham and PHN comorbid anxiety-like group. (C) Comparison of mEPSC frequency (4 mice in the sham group, 19 neurons in total; 4 mice in the PHN comorbid anxiety-like group, 23 neurons in total; t = 2.697, p = 0.010) and (D) amplitudes in ACC about sham and PHN comorbid anxiety-like mice (4 mice in the sham group, 19 neurons in total; 4 mice in the PHN comorbid anxiety-like group, 23 neurons in total; t = 1.075, p = 0.289). (E) The statistical plot of action potential firing after electrical evocation (F (15, 248) = 2.609, p = 0.001; 6 mice in the sham group with a total of 25 neurons; 7 mice in the PHN comorbid anxiety-like group with a total of 26 neurons). (F) RMP of mice in the sham and PHN comorbid anxiety-like group (t = 3.277, p = 0.002), (G) Rheobase current (t = 1.093, p = 0.280), and (H) Rin (t = 0.382, p = 0.704). (I) Schematic of fiber optic recording of calcium signals, box enlargement for (J) virus injection, and fiber optic position. (K) Flowchart of calcium signal recording in sham and PHN comorbid anxiety-like mice. (L) Representative diagram of GCaMP6s virus expression and fiber-optic cannulation, scale bar 500 μm. (M) Heatmap of calcium during mechanical pain stimulation in sham and PHN comorbid anxiety-like mice. (N) Quantitative statistical plots of mean calcium signal and (O) mean fluorescent calcium response (t = 3.150, p = 0.020, n = 4 mice/group). (P) Heatmap of calcium signal changes in sham and PHN comorbid anxiety-like mice when moving from the closed arm into the open arm in EPM. (Q) Mean fluorescent calcium signal and (R) Mean fluorescent calcium response statistic plots (t = 4.252, p = 0.005, n = 4 mice/group). (*p < 0.05, **p < 0.01, ***p < 0.001).
Figure 8
Figure 8
Behavioral effects of optical regulation of BLAGlu-ACC projections in PHN comorbid anxiety-like mice. (A) Schematic of virus injection and optical fiber implantation. (B) Representative plots of oEPSC in sham and PHN comorbid anxiety-like groups and (C) Statistical plots (5 mice in the sham group with 14 neurons; 5 mice in PHN comorbid anxiety-like group with 21 neurons; t = 3.034, p = 0.005). (D) Representative plots of PPR in the sham and the PHN comorbid anxiety-like group and (E) statistical plots (5 mice in the sham group, 14 neurons in total; 5 mice in the PHN comorbid anxiety-like group, 21 neurons in total; t = 5.622, p < 0.001). (F) Optogenetic flow chart. (G) Schematic diagram of BLA virus injection and ACC fiber implantation. (H) Representative diagram of virus expression and fiber optic implantation in ACC, scale bar: 500 μm. (I) The effects of optical activation of BLAGlu-ACC projections on pain threshold in the mCherry and the ChR2 group (blue-light induced in the mCherry group: pre vs on p > 0.999, on vs post p > 0.999; ChR2 group: pre vs on p = 0.031, on vs post p = 0.031) (n = 6 mice/group). (J) Representative plots of the action trace of the two groups in OFT, (K) statistical plots of total distance (t = 1.541, p = 0.154), and (L) time spent in the central region (t = 0.838, p = 0.421). (M) Representative plots of the action trace of the two groups in the EPM, with statistical plots of (N) time spent in the open arm (t = 0.791, p = 0.447) and (O) number of entries in the open arm (t = 2.446, p = 0.034). (P) The effects of optical inhibition of BLAGlu-ACC projections on pain threshold in the mCherry and the eHPHR group (yellow light-induced mCherry group: pre vs on p > 0.999, on vs post p > 0.999; eNPHR group: pre vs on p = 0.031, on vs post p = 0.031) (n = 6 mice/group). (Q) Representative plots of the trace of the two groups in OFT, (R) statistical plots of the total distance (t = 0.089, p = 0.931), and (S) time in the central region (t = 2.119, p = 0.060). (T) Representative plots of the trace of both groups in the EPM, (U) statistical plots of the time spent in the open arm (t = 2.361, p = 0.039), and (V) number of entries to the open arm (t = 0.759, p = 0.465). (*p < 0.05, **p < 0.01, ***p < 0.001).
Figure 9
Figure 9
Increased excitability of BLAACC neurons in PHN comorbid anxiety-like mice. (A) Schematic of ACC injected with AAV/Retro-CaMKIIα-mCherry virus and whole-cell membrane clamped on BLA mCherry+ neurons. (B) Schematic of Neurobiotin-labeled neurons (left), mCherry+ neurons (center), and co-labeled of both (right), scale bar 20 μm. (C) Comparison of spikes in BLAACC neurons in mice of the sham and PHN comorbid anxiety-like group (5 mice in the sham group with a total of 20 neurons; 6 mice in the PHN comorbid anxiety-like group with a total of 20 neurons; F(14, 266) = 4.997, p < 0.0001), (D) comparison of Rheobase (t = 2.518, p = 0.016), (E) RMP (t = 3.29, p = 0.002) and (F) Rin (t = 1.230, p = 0.226). (G) Flowchart of calcium signal recording in sham and PHN comorbid anxiety-like mice. (H) Schematic of virus injection and fiber optic position. (I) Representative diagram of GCaMP6s virus expression and fiber-optic cannulation, scale bar 500 μm. (J) Heatmap of calcium during mechanical pain stimulation in sham and PHN comorbid anxiety-like mice. (K) Quantitative statistical plots of mean calcium signal and (L) mean fluorescent calcium response (t = 3.689, p = 0.006, n = 5 mice/group). (M) Heatmap of calcium signal changes in sham and PHN comorbid anxiety-like mice when moving from the closed arm into the open arm in EPM. (N) Mean fluorescent calcium signal and (O) Mean fluorescent calcium response statistic plots (t = 7.548, p < 0.001, n = 5 mice/group). (*p < 0.05, **p < 0.01, ***p < 0.001).
Figure 10
Figure 10
Chemogenetic modulation of BLAACC neurons alters pain and anxiety-like behaviors in PHN comorbid anxiety-like mice. (A) Flow diagram of chemogenetic modulation of BLAACC neurons. (B) Schematic diagram of chemogenetically activated viruses injected into BLA and ACC in WT mice. (C) Representative diagram of BLA virus expression bilaterally, scale bar 1 mm. (D) Representative diagram of neurons expressing mCherry+ in BLA co-labeled with c-fos, scale bar 200 μm. The area shown is enlarged in the white box of BLA, scale bar 20 μm. (E) stereotaxic injection of control or hM3dq virus in the PHN comorbid anxiety-like mice, and the mechanical pain thresholds (Comparing before and after CNO injection, p = 0.500 and p = 0.016 in mCherry or hM3dq-mCherry group, respectively) and (F) the thermal paw withdrawal latency (Comparing before and after CNO injection, p = 0.844 and p = 0.384 in mCherry or hM3dq-mCherry group, respectively) comparisons by intraperitoneal injection of CNO (n = 7 mice/group). (G) Representative plots of OFT trace in PHN comorbid anxiety-like mice with mCherry or hM3dq-mCherry after CNO injection. (Ha) the total distance in OFT (t = 0.732, p = 0.478) and (Hb) central time spent (t = 0.241, p = 0.814) in both groups after the injection of CNO (n = 7 mice/group). (I) Representative plots of the exploration trace in the EPM. (Ja) The duration of stay in the open arm of the EPM (t = 1.218, p = 0.247) and (Jb) entries into the open arm (t = 2.963, p = 0.012). In the LDB, (Ka) spent time in the lightbox (t = 1.007, p = 0.334), (Kb) latency to enter the lightbox (U = 32, p > 0.999), and (Kb) the entries into the lightbox (t = 0.112, p = 0.912) (n = 7 mice/group). (L) Schematic diagram of inhibition viruses injected into BLA and ACC in WT mice. (M) Representative diagram of neurons expressing mCherry+ in the BLA co-labeled with c-fos, scale bar 200 μm. White boxes denote magnified areas in the BLA, scale bar 20 μm. (N) Mechanical pain thresholds in PHN comorbid anxiety-like mice injected with either control or hM4di virus (Comparing before and after CNO injection, p > 0.999 and p = 0.016 in mCherry or hM4di-mCherry group, respectively) and (O) the thermal paw withdrawal latency (Comparing before and after CNO injection, p = 0.781 and p = 0.016 in mCherry or hM4di-mCherry group, respectively) (n = 7 mice/group). (P) Representative plots of OFT trace in PHN comorbid anxiety-like mice with mCherry or hM4di-mCherry after CNO injection. (Qa) Total distance in OFT (t = 1.008, p = 0.334) and (Qb) central time (t = 1.592, p = 0.137) in both groups after the injection of CNO (n = 7 mice/group). (R) Representative plots of exploration trace in the EPM in two groups after CNO injection. (Sa) Time spent in the open arm of the EPM (t = 2.795, p = 0.016) and (Sb) entries into the open arm (t = 1.961, p = 0.074) after CNO injection. (Ta) Comparison of time spent in the lightbox (t = 1.627, p = 0.126), (Tb) latency to enter the lightbox (U = 30, p = 0.878), and (Tc) entries into the lightbox (t = 1.936, p = 0.073) (n = 7 mice/group) in the LDB experiment. (*p < 0.05, **p < 0.01, ***p < 0.001).

References

    1. Saguil A, Kane S, Mercado M, Lauters R. Herpes Zoster and Postherpetic Neuralgia: Prevention and Management. Am Fam Physician. 2017;96:656–63. - PubMed
    1. Gilden D. Efficacy of live zoster vaccine in preventing zoster and postherpetic neuralgia. J Intern Med. 2011;269:496–506. - PMC - PubMed
    1. Sun X, Wei Z, Lin H, Jit M, Li Z, Fu C. Incidence and disease burden of herpes zoster in the population aged ≥50 years in China: Data from an integrated health care network. J Infect. 2021;82:253–60. - PubMed
    1. Asada H. Recent topics in the management of herpes zoster. J Dermatol. 2023;50:305–10. - PubMed
    1. Du J, Sun G, Ma H, Xiang P, Guo Y, Deng Y. et al. Prevalence and Risk Factors of Anxiety and Depression in Patients with Postherpetic Neuralgia: A Retrospective Study. Dermatology. 2021;237:891–5. - PubMed

MeSH terms