. 2025 Mar 21;15(10):4593-4613.
doi: 10.7150/thno.111625. eCollection 2025.

FOS-driven inflammatory CAFs promote colorectal cancer liver metastasis via the SFRP1-FGFR2-HIF1 axis

Affiliations

FOS-driven inflammatory CAFs promote colorectal cancer liver metastasis via the SFRP1-FGFR2-HIF1 axis

Long Liu et al. Theranostics. .

Abstract

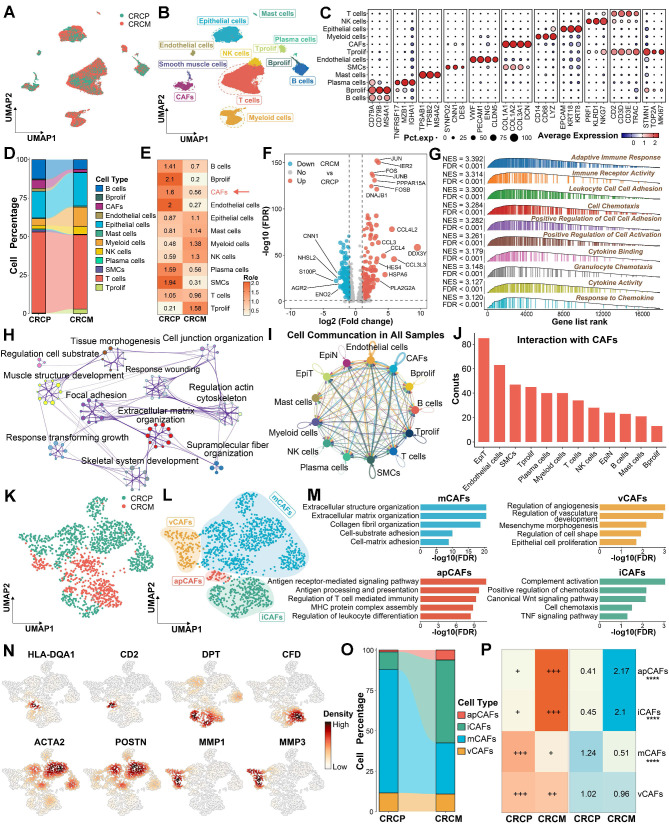
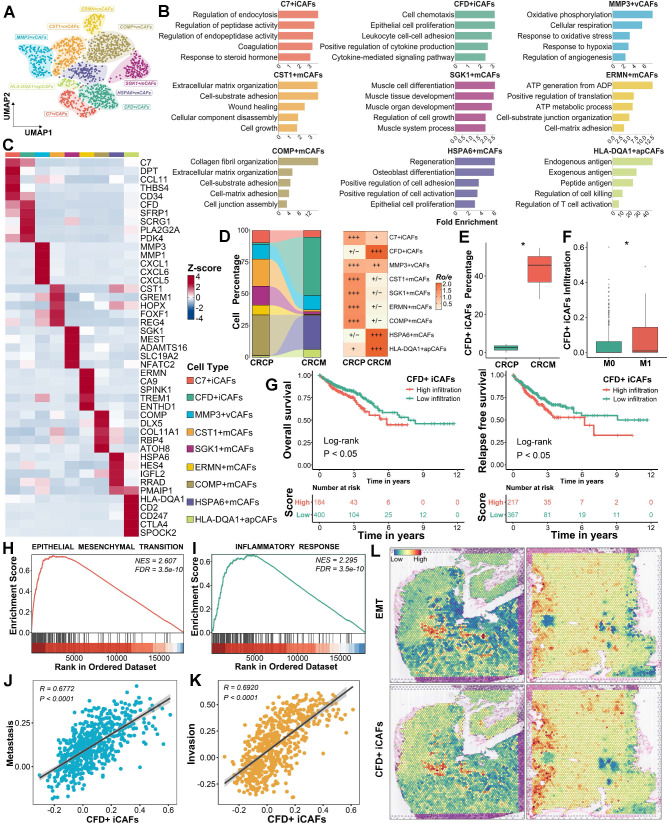
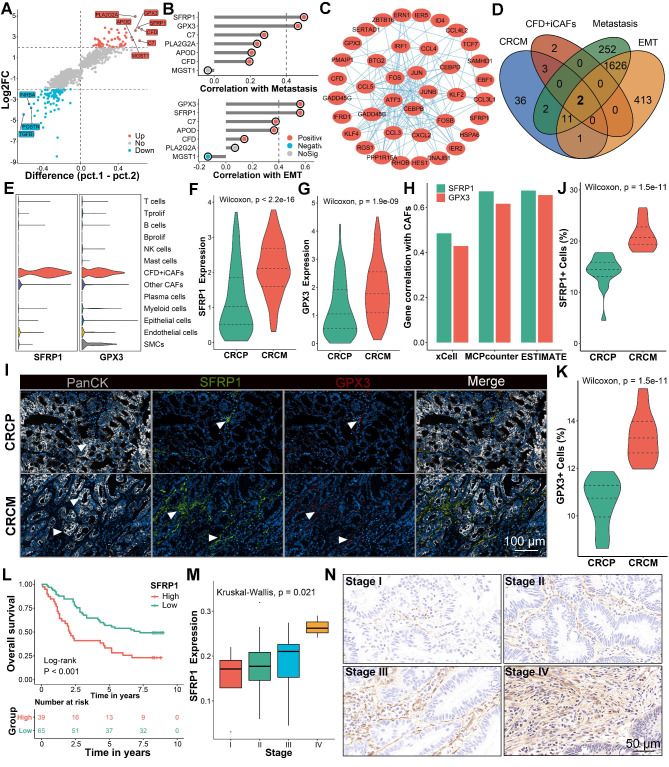
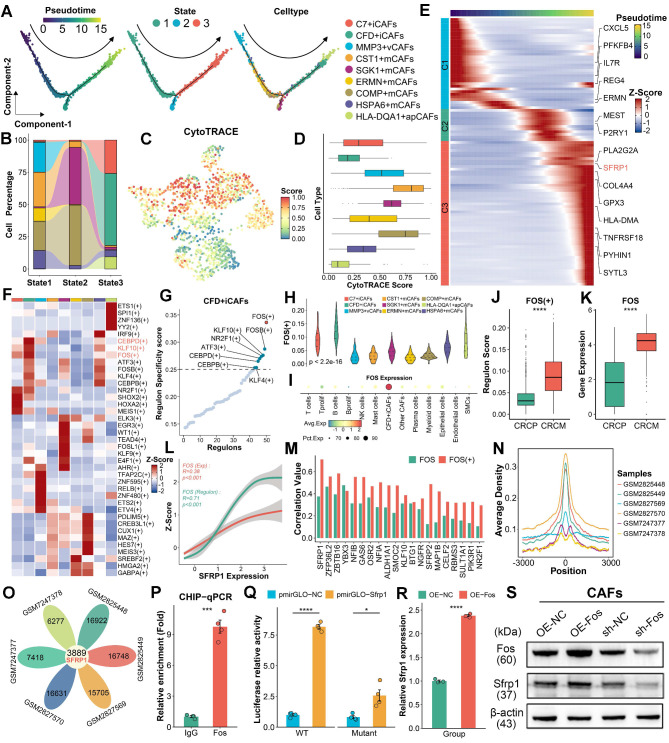
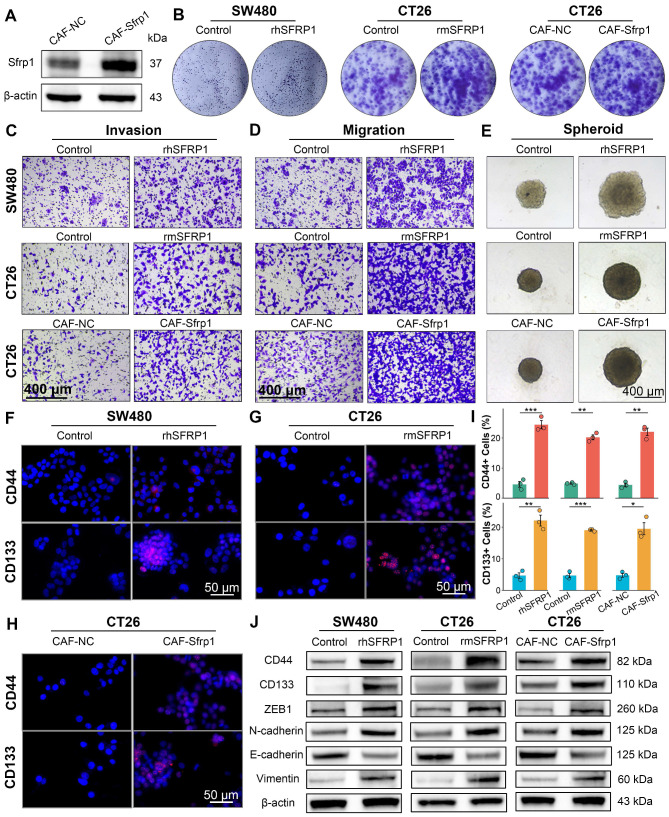
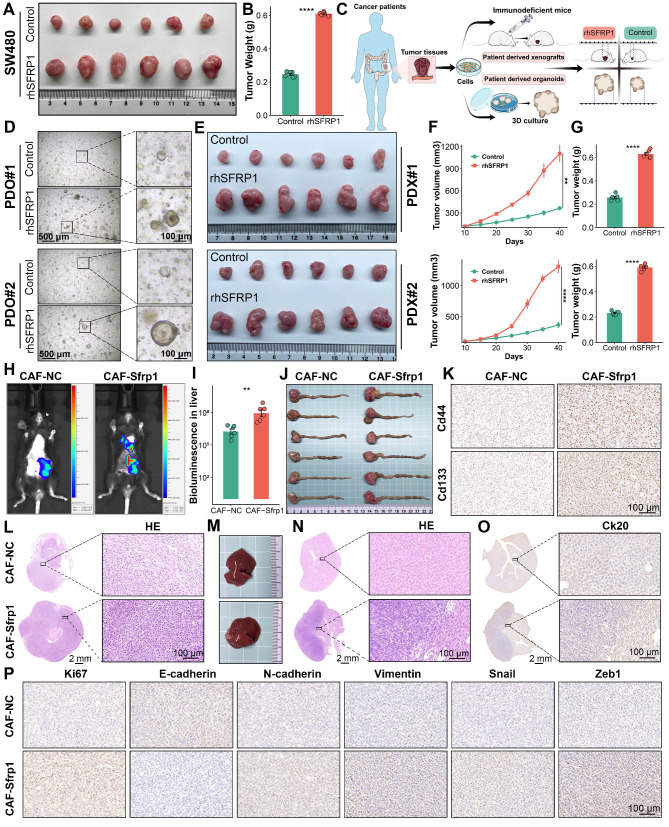
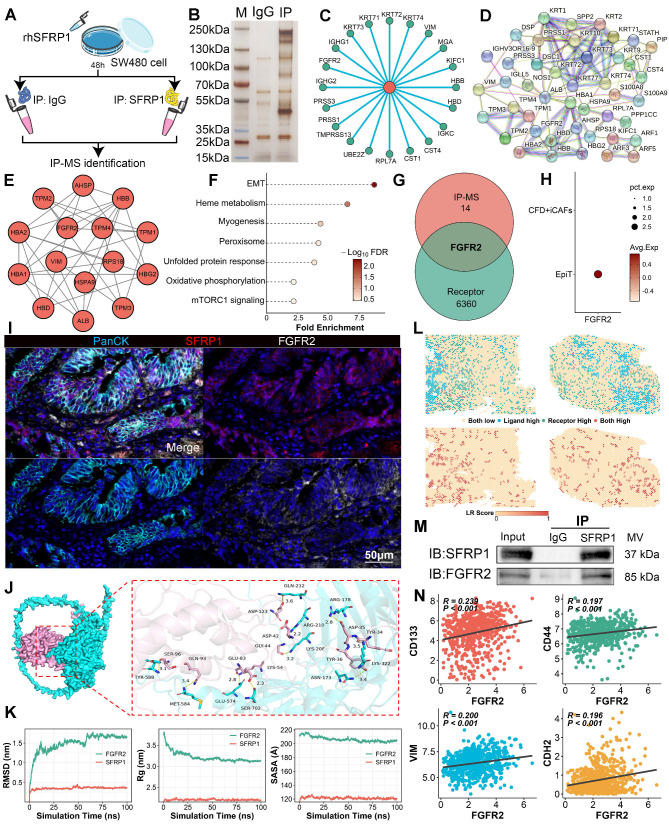
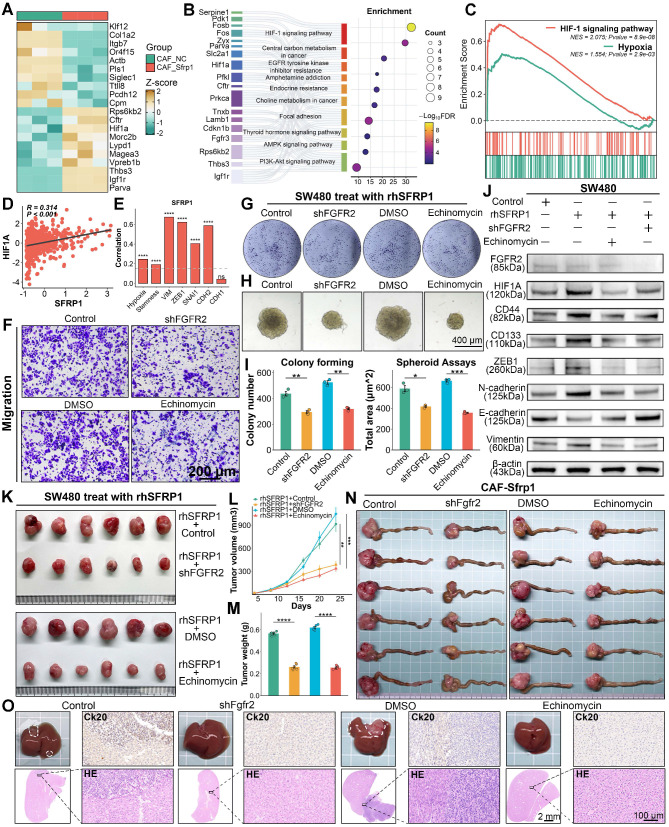
Rationale: Cancer-associated fibroblasts (CAFs) exhibit diverse functions, yet their roles in colorectal cancer liver metastasis (CRLM) remain poorly understood. Methods: Through integrated analysis of single-cell RNA sequencing and spatial transcriptomics from colorectal cancer patients (CRCP: non-metastatic primary tumors; CRCM: metastatic primary tumors with liver metastases), combined with in vitro and in vivo models to investigate the role of CAFs in CRLM. In vitro experiments included six groups to reveal the role of SFRP1-producing CAFs, comprising PBS (control) and recombinant human SFRP1 (rhSFRP1) treated SW480 cells, PBS (control) and recombinant mouse SFRP1 (rmSFRP1) treated CT26 cells, and conditioned medium (CM) derived from CAF-NC and CAF-Sfrp1 treated CT26 cells. Preclinical models were further employed to elucidate the role of SFRP1 in CRLM. Subcutaneous xenografts models were constructed from PBS (control) and rhSFRP1 treated SW480 cells. For orthotopic tumor metastasis models, CT26 cells were pre-cultured with CAF-NC or CAF-Sfrp1 and then orthotopically injected into BALB/c mice. Results: We identified an inflammatory CAF subtype (CFD+ iCAFs) associated with poor clinical outcomes, advanced staging, and metastasis. Transcriptional regulation analysis revealed FOS-mediated differentiation of CFD+ iCAFs drives SFRP1 overexpression. In vitro and in vivo experiments confirmed that SFRP1-producing CAFs promote tumor stemness and epithelial-mesenchymal transition (EMT). Mechanistically, SFRP1 from CFD+ iCAFs binds FGFR2, activating the HIF1 signaling pathway to enhance tumor stemness, EMT, and CRLM progression. Conclusion: This study highlights CFD+ iCAFs as key regulators of tumor-stromal interactions and identifies SFRP1 as a potential therapeutic target in CRLM.

Keywords: Cancer-associated fibroblasts; Colorectal cancer liver metastasis; SFRP1; Single-cell RNA sequencing; Therapeutic target.


Conflict of interest statement

Competing Interests: The authors have declared that no competing interest exists.

Figures

Figure 1
Figure 1
The difference and alterations of CAFs between CRCP and CRCM. (A-B). Dimensionality reduction and unsupervised clustering delineating the distribution of scRNA-seq data. (C). Dot plot exhibiting the expression of classical cell markers among major cell types in CRC. (D). Sankey diagram showing proportions of identified major cell populations within CRCP and CRCM. (E). Heatmap showing the Ro/e index of CAFs between CRCP and CRCM. (F). Volcano plot depicting the differentially expressed genes between CAFs from CRCP and CRCM. (G). Gene set enrichment analysis (GSEA) reveals functional characteristics of CAFs from CRCM. (H). Metascape showing the enriched pathways within CAFs from CRCP based on upregulated genes in this cell population. (I-J). CellChat infers cell-cell communication network among all cell types. (K-L). Dimensionality reduction plot delineating four CAFs subpopulations, including mCAFs, iCAFs, apCAFs, and vCAFs. (M). Functional enrichments uncover biological characteristics among four CAFs subpopulations. (N) The distribution and density of classical markers in identified four CAFs subpopulations. (O). Sankey diagram displaying proportions of identified CAF subpopulations within CRCP and CRCM. (P). Ro/e index supporting the preference of cell populations in CRCP and CRCM. ****P < 0.0001.
Figure 2
Figure 2
CFD+ iCAFs significantly correlated with tumor EMT and metastasis. (A). Focusing on all CAFs, dimensionality reduction and unsupervised clustering depicting the mapping of nine cell subpopulations in CRC. (B). Functional enrichment analysis uncovers specific biological pathways among different CAFs subpopulations. (C). Heatmap illustrating highly expressed genes among identified nine CAFs subpopulations in CRC. (D). Sankey diagram displaying proportions and Ro/e index supporting the preference of identified nine CAFs subpopulations. (E-F). Box plot showing the CFD+ iCAFs percentage in scRNA-seq data and comparing the infiltration of CFD+ iCAFs in TCGA transcriptomic data. (G). Kaplan-Meier survival analysis reveals the prognosis value of CFD+ iCAFs. (H-I). GSEA highlights the significant biological pathways in CFD+ iCAFs. (J-K). Correlation analysis suggests the strong links between CFD+ iCAFs and tumor metastasis and invasion activity, respectively. (L). Spatial transcriptomic analysis of CFD+ iCAFs and tumor EMT in primary CRC tissues.
Figure 3
Figure 3
Secretory protein SFRP1 derived from CFD+ iCAFs displays implications in driving CRLM. (A). The identification of biomarkers for CFD+ iCAFs from CRCM, with labeled genes showing a difference of over 0.5 in two percentage categories. (B). Correlation analysis explores the links between significantly upregulated labeled genes and tumor metastasis and EMT activity. (C). The protein-protein interaction networks exhibiting interconnected relationships among the upregulated genes in CFD+ iCAFs from CRCM. (D). Venn diagram illustrating two overlap genes (SFRP1 and GPX3) according to upregulated genes from CRCM, feature genes from CFD+ iCAFs, significant positive correlation genes from EMT and metastasis with R value over 0.4. (E). Violin plots showing SFRP1 and GPX3 specifically expressed in CFD+ iCAFs, suggesting SFRP1 and GPX3 are derived from CFD+ iCAFs. (F-G). Violin plots comparing the expression of SFRP1 and GPX3 between CRCP and CRCM. (H). Using xCell, MCPcounter, and ESTIMATE tool evaluate the correlation between fibroblast abundance and expression of SFRP1 and GPX3. (I). Representative images of multiplex immunohistochemistry (mIHC) staining for SFRP1 and GPX3 in human CRCP and CRCM tissues. (J-K). Violin plots demonstrating that superior expression of SFRP1 and GPX3 in human CRCM tissues, especially for SFRP1, as assessed by mIHC staining analysis. (L-M). In a tissue microarray (TMA), Kaplan-Meier survival curves showing the association between high SFRP1 expression and poorer overall survival, alongside with advanced tumor stage. (N). Representative images of immunohistochemistry (IHC) staining for SFRP1 in CRC tissues with diverse clinical stages.
Figure 4
Figure 4
FOS facilitates the formation of CFD+ iCAFs and increases SFRP1 expression. (A-B). Pseudotime analysis highlights the differentiation of CAFs subpopulations, depicting three distinct states. (C-D). Dimensionality reduction plot displaying the distribution of CytoTRACE scores and Box plot comparing CytoTRACE scores across these nine CAFs subpopulations. (E). Heatmap illustrating the dynamic expression of key pseudotime associated genes. (F). SCENIC analysis evaluates transcription factor activity across distinct CAFs subpopulations. (G). Regulon specificity score (RSS) plot displaying FOS as the top-ranked transcription factor in CFD+ iCAFs. (H-I). Violin plot comparing the RSS levels of FOS across CAFs subpopulations and dot plot exhibiting FOS expression among various cell types. (J-K). Box plots comparing the RSS and expression levels of FOS between CAFs derived from CRCP and CRCM. (L). The correlation of FOS expression and transcriptional activity with SFRP1 expression. (M). The correlation of FOS expression and transcriptional activity with top 20 targeted genes expression across CAFs subpopulations. (N-O). FOS ChIP-sequencing analysis reveals its high transcriptional regulatory activity and venn diagram showing the overlap FOS targeted genes. (P). ChIP-qPCR analysis showing significant enrichment of Fos at the promoter region of Sfrp1. (Q). Luciferase reporter assay suggesting that Fos enhances the transcriptional activity of the wild-type Sfrp1 promoter relative to a mutant type. (R). qPCR analysis of Sfrp1 mRNA level in primary mouse CAFs with Fos control and overexpression. (S). Western blot analysis of Sfrp1 protein level in primary mouse CAFs with Fos knockdown or overexpression.
Figure 5
Figure 5
SFRP1 performs a pro-metastatic biological role in vitro. (A). Western blot analysis tests the efficiency of lentiviral transduction, confirming Sfrp1 overexpression in primary mouse CAFs. (B). Colony formation assay detecting colony number to assess proliferative capacity of CRC cells. (C). Invasion assay assessing invasive activity of CRC cells. Representative images of invasion assay. Scale bars, 400 μm. (D). Migration assay assessing migratory activity of CRC cells. Representative images of migration assay. Scale bars, 400 μm. (E). Spheroid assay reflecting stemness of CRC cells. Representative images of spheroid assay. Scale bars, 400 μm. (F-H). CD44 and CD133 staining evaluating stemness of CRC cells. Representative images of immunofluorescence. Scale bars, 50 μm. (I). Quantification of CD44 and CD133 staining and identification of positive cells ratio, comparing the effects of recombinant proteins and CAF CM on CRC cells. (J). Western blot analysis tests tumor stemness and EMT associated proteins, including CD44, CD133, ZEB1, Vimentin, N-cadherin, and E-cadherin, on recombinant proteins or CAFs CM treated CRC cells, suggesting SFRP1 promotes tumor stemness and EMT activity in vitro. *P < 0.05, **P < 0.01, ***P < 0.001.
Figure 6
Figure 6
SFRP1 promotes tumor stemness and metastasis in preclinical models. (A). Representative images of subcutaneous xenografts model from SW480 cells. (B). Tumor weights of subcutaneous xenografts model from SW480 cells. The rhSFRP1 treatment group displayed larger tumor weight, markedly accelerating tumor growth in vivo setting. (C). The diagram of establishing patient derived organoids (PDOs), patient derived xenograft (PDX) models. (D). PDOs models are successfully established by two CRC patients and classified into PDO#1 and PDO#2. The rhSFRP1 treatment group display significantly larger, indicating enhanced proliferation. (E). PDX models are successfully established by two CRC patients and classified into PDX#1 and PDX#2. Representative images of PDX models from two patients treated with control rhSFRP1. (F-G) Tumor growth curves and final tumor weights of PDX models. The rhSFRP1 treatment group displays significantly larger volumes and weights compared to control group. (H). Representative bioluminescence images of orthotopic tumor metastasis models. (I). Quantification of bioluminescence in metastatic liver from orthotopic tumor metastasis models. (J). Representative images of CRC tissues form orthotopic tumor metastasis models. (K). Representative images of Cd44 and Cd133 staining of CRC tissues from orthotopic tumor metastasis models. Scale bars, 100 μm. (L-N). Representative images of hematoxylin and eosin (H&E) staining of CRC tissues and metastatic liver tissues from orthotopic tumor metastasis models. Scale bars, 2 mm and 100 μm. Gross images of metastatic liver tissues from orthotopic tumor metastasis models in CAF-Sfrp1 and CAF-NC groups. (O). Representative images of Ck20 staining of metastatic liver tissues from orthotopic tumor metastasis models. Scale bars, 2 mm and 100 μm. (P). Immunohistochemical analysis of CRC tissues from orthotopic tumor metastasis models. Scale bars, 100 μm. **P < 0.01, ****P < 0.0001.
Figure 7
Figure 7
Secretory protein SFRP1 interacts with FGFR2 receptor on tumor cells in CRC. (A). The scheme of immunoprecipitation-mass spectrometry (IP-MS) identifying SFRP1 interacted proteins in SW480 cells mixed with rhSFRP1. (B). SDS-PAGE and silver staining exhibiting interacted protein bands in the IP group (SFRP1 antibody) compared to the IgG control group. (C). Circle plot showing top 20 proteins interacting with SFRP1 by mass spectrometry analysis. (D-E). Protein-protein interaction (PPI) networks displaying all SFRP1 interacted proteins and MCODE analysis identifying hub module of SFRP1 interacted proteins. (F). Functional enrichment analysis explores the biological pathways associated with identified SFRP1 interacted proteins, indicating activated EMT pathway. (G). Venn diagram showing overlap proteins between hub module of SFRP1 interacted proteins and cell communication associated receptors. (H). Dot plot displaying FGFR2 specifically expressed in epithelial tumor cells compared to CFD+ iCAFs. (I). mIHC images showing spatial proximity between high SFRP1-expressing CAFs and FGFR2-expressing tumor cells. Representative images of immunofluorescence. Scale bars, 50 μm. (J). Molecular docking and dynamics simulations displaying SFRP1-FGFR2 interaction, with structural stability. (K). Quantification of Root Mean Square Deviation (RMSD), Radius of Gyration (Rg), and Buried Surface Area (SASA) values to evaluate SFRP1-FGFR2 interaction in 100-nanosecond simulation. (L). Spatial transcriptomics reveals SFRP1 interacted with FGFR2 in primary CRC tissues. (M). Co-immunoprecipitation (CO-IP) experiment confirming the direct physical interaction between SFRP1 and FGFR2 in SW480 cells. (N). Correlation analysis demonstrates a positive association between SFRP1 expression and CD133, CD44, VIM, and CDH2 expression in TCGA transcriptomic data.
Figure 8
Figure 8
SFRP1 interacts with FGFR2 promoting tumor stemness and metastasis through HIF1 pathway. (A). Heatmap showing DEGs based on transcriptomic sequencing data. (B). Gene Ontology analysis of these DEGs suggests enrichment of the HIF1 signaling pathway in CRC cells pre-culture with CAF-Sfrp1. (C). GSEA analysis highlights positive association between SFRP1 and HIF1 signaling pathway as well as hypoxia signaling pathway. (D). Correlation analysis of SFRP1 expression with HIF1A expression, revealing a positive association between them in CRC samples from TCGA dataset. (E) Bar plot displaying correlations between THBS2 expression and hypoxia activity, stemness activity, and EMT associated genes in TCGA dataset. The hypoxia and stemness activities are assessed through CancerSEA dataset. (F). Migration assay assessing migratory activity across four experimental groups. Representative images of migration assay. Scale bars, 200 μm. (G). Colony formation assay detecting colony number to assess proliferative capacity across four experimental groups. (H) Spheroid assay reflecting stemness across four experimental groups. Representative images of spheroid assay. Scale bars, 400 μm. (I). Quantification of colony formation and spheroid assays results, comparing the effects of shFGFR2 and Echinomycin on SW480 CRC cells. (J). Western blot analysis of HIF1A, CD44, CD133, ZEB1, E-cadherin, N-cadherin, and Vimentin in rhSFRP1, shFGFR2, and Echinomycin treated SW480. (K). Representative images of subcutaneous xenografts models from SW480 cells across four experimental groups. (L-M). Tumor growth curves and final tumor weights of subcutaneous xenografts models. Both shFGFR2 and Echinomycin treatment significantly suppressed tumor growth even in the presence of rhSFRP1. (N). Representative images of CRC tissues from orthotopic tumor metastasis models across four experimental groups. (O). Representative images of metastatic livers with anatomical gross, Ck20 staining, and H&E staining. Scale bars, 2 mm and 100 μm. **P < 0.01, ***P < 0.001, ****P < 0.0001.

Similar articles

Cited by

References

    1. Li R, Liu X, Huang X, Zhang D, Chen Z, Zhang J. et al. Single-cell transcriptomic analysis deciphers heterogenous cancer stem-like cells in colorectal cancer and their organ-specific metastasis. Gut. 2024;73:470–84. - PMC - PubMed
    1. Canellas-Socias A, Sancho E, Batlle E. Mechanisms of metastatic colorectal cancer. Nat Rev Gastroenterol Hepatol. 2024;21:609–25. - PubMed
    1. Cords L, de Souza N, Bodenmiller B. Classifying cancer-associated fibroblasts-The good, the bad, and the target. Cancer Cell. 2024;42:1480–5. - PubMed
    1. Liu Y, Zhang X, Gu W, Su H, Wang X, Wang X. et al. Unlocking the crucial role of cancer-associated fibroblasts in tumor metastasis: Mechanisms and therapeutic prospects. J Adv Res. 2024;31:S2090–1232. (24)00220-0. - PubMed
    1. Fang Z, Meng Q, Xu J, Wang W, Zhang B, Liu J. et al. Signaling pathways in cancer-associated fibroblasts: recent advances and future perspectives. Cancer Commun (Lond) 2023;43:3–41. - PMC - PubMed

MeSH terms

Substances