. 2025 Mar 18;15(10):4270-4286.
doi: 10.7150/thno.104474. eCollection 2025.

Improved optogenetic modification of spiral ganglion neurons for future optical cochlear implants

Affiliations

Improved optogenetic modification of spiral ganglion neurons for future optical cochlear implants

Anupriya Thirumalai et al. Theranostics. .

Abstract

Optogenetic stimulation has become a promising approach for restoring lost body function. For example, partial restoration of vision has been achieved in a blind patient and preclinical proof-of-concept has been demonstrated for optogenetic hearing restoration. In preparation for clinical translation of hearing restoration, efficient and safe optogenetic modification of spiral ganglion neurons (SGNs) in the mature cochlea remained to be developed. Methods: Here, we established microcatheter-based administration of adeno-associated virus (AAV) into scala tympani of the cochlea of Mongolian gerbils and compared it to the previously developed direct AAV-injection into the spiral ganglion. We probed the potential of AAV-PHP.S to express channelrhodopsins (ChRs) under the control of the human synapsin promotor in mature SGNs of hearing and deafened gerbils. Results: Using the microcatheter approach, but not with the AAV-modiolus injection, we achieved reliable ChR expression in SGN enabling optogenetic stimulation of the auditory pathway in 80% of the treated animals. Yet, the efficiency of SGN transduction was modest with only ~30% ChR-expressing SGNs. Moreover, we encountered off-target expression in hair cells in hearing gerbils in both approaches. We did not detect ChR expression in the central nervous system using microcatheter administration. Comparing optogenetic auditory brainstem responses of gerbils with and without hair cell transduction confirmed that SGNs were the primary site of optogenetic stimulation of the pathway. Conclusions: The AAV.PHP-S microcatheter administration via the round window with pressure relief at the round window is a reliable approach to optogenetically modify the SGNs in order to restore hearing with future optical cochlear implants.

Keywords: cochlear optogenetic stimulation; microcatheter-based administration; optical cochlear implants; spiral ganglion neurons.; viral vector delivery.


Conflict of interest statement

Competing Interests: The authors have declared that no competing interest exists.

Figures
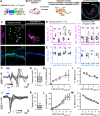
Figure 1
Figure 1
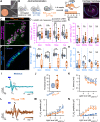
AAV.PHP-S mediates efficient ChR-expression of CatCh in SGNs following cochlear injection at early postnatal age. A. pAAV plasmid used in this study containing CatCh fused with eYFP. Expression was driven by human synapsin promoter (hSyn) and enhanced by the Woodchuck hepatitis virus post-translational regulatory element (WPRE) and bovine growth hormone (bGH). ITR corresponds to the inverted terminal repeats. B. Time course of the experiment: At early postnatal age, animals received an intracochlear viral suspension injection. At least 8 weeks later, optically evoked auditory brainstem responses (oABR) were measured and the cochleae were collected for histology. C. Representative maximum projection of confocal images obtained from immunolabelled cross-modiolar sections of an injected (left) and a non-injected cochlea (right, scale bar = 50 µm). GFP (green) marks ChR-expressing cells. The first row corresponds to the spiral ganglion neurons (SGN) labelled with parvalbumin (magenta). The second row corresponds to the inner hair cells (IHC) labelled with calretinin (blue). D-E. Quantification of the SGN density, GFP+ SGN density (D), IHC density and GFP+ IHC density (E). Data from the injected cochleae are represented in black, and contralateral non-injected cochlea in grey. For the injected cochlea, a grey-filled marker was used when positive oABRs were measured and an open-marker for the negative oABRs. Wilcoxon rank sum test (n.s., non-significant; *, P ≤ 0.05). F.J. Representative oABRs (F) and optically evoked compound action potentials (oCAP). The first wave of both potentials reflects the synchronous activation of the SGNs. G-I, K-M. Quantification of the activation thresholds (G,K), first wave amplitude (H,L) and first wave latency (I,M) of the oABR (G-I, n = 5 cochleae) and the oCAP (K-M, n = 5 cochleae). The potential latencies and amplitudes are expressed as mean ± SEM as a function of the light level above threshold (see Material and methods for details). Box plots show minimum, 25th percentile, median, 75th percentile, and maximum.
Figure 2
Figure 2
Viral administration with a micro-catheter inserted at the round window + vent at the oval window (RWµ-cat + OW) mediates improved optogenetic modification of the SGNs compared to the reference modiolus injection. A. Picture of the catheter used for the RWµ-cat + OW approach. The white line indicates the insertion depth (4.5-5 mm). B. Time course of the experiment. At adult age, animals were divided in three groups: i) untreated control (black); ii) modiolus injection (blue); iii) RWµ-cat + OW administration (orange) of AAV-PHP.S-hSyn-CatCh. At least 4 weeks later, oABRs were measured. The proportion of animals for which a positive oABR were recorded are represented as boxplot. Next, the cochleae were collected for histology. Here, the overview image is a cross-modiolar section from a modiolus injected cochlea (scale bar = 500 µm). C,F. Representative maximum projection of confocal images obtained from immunolabelled cross-modiolar sections of spiral ganglion neurons (SGN, C, scale bar = 50 µm) and inner hair cells (IHC, F, scale bar = 50 µm). GFP (green) marks ChR-expressing cells. The SGNs were labelled with parvalbumin (magenta). The IHCs were labelled with calretinin (blue). D-E, G-H. Quantification of the SGN density (D, n = 6), GFP+ SGN density (E, n = 6), IHC density (G, n = 4) and GFP+ IHC density (H, n = 4). A filled circle was used when positive oABRs were measured and an open-triangle for the negative oABRs. No oABRs were measured from the untreated control cochleae (squared marker)..Kruskal-Wallis test followed by a multi-comparison test (n.s., non-significant; *, P ≤ 0.05; **, P ≤ 0.01). I-L. Representative oABRs recorded from modiolus injected (I) and RWµ-cat + OW administered cochleae (L). The light intensity is color coded using the color scale in insert. J. Quantification of the oABR activation threshold measured from modiolus injected (orange, n = 2 positive oABR cochleae out of 10 injected ones) and RWµ-cat + OW administred (blue, n = 8 positive oABR cochleae out of 10 injected ones) cochleae. K,M-N. Quantification of the P1 latency (K), P1-N1 amplitude (M) and P2-N2 amplitude (N) as a function of the light level relative to the oABR threshold. Box plots show minimum, 25th percentile, median, 75th percentile, and maximum. Averaged ± SEM. Wilcoxon rank sum test (n.s., non-significant; *, P ≤ 0.05; **, P ≤ 0.01). Approximately, 4 weeks after injection, animals were tested and expression of f-Chrimson-eYFP was analyzed by confocal microscopy of mid-modiolar cryosection immunolabeled for GFP and parvalbumin as a SGN marker, regardless of the presence or absence of optically evoked oABRs (Figure S2B-C). RWµ-cat + vent administrations tended to enable higher SGN and GFP+ SGN densities (Table 1, Figure S2B) and transduction rates (Table 1, Figure S2C) compared to the reference modiolus injection. The RWµ-cat + OW vent approach was selected for further investigation because, unlike the RWµ-cat + PSCC vent approach, it limits active delivery of the viral suspension to the vestibule.
Figure 3
Figure 3
Viral administration with a RWµ-cat + OW does not require the presence of inner hair cell to optogenetically modify the SGNs. A. Time course of the experiment. At adult age, a group of animals was deafened by cochlear round window injection of Kanamycin (100 mg/mL, n = 6). The control normal hearing animals are replotted from figure 2. One week after deafening, animals received a RWµ-cat + OW administration of AAV-PHP.S-hSyn-CatCh. At least 4 weeks later, oABRs were measured. The proportion of animals for which a positive oABR were recorded are represented as boxplot. Next, the cochleae were collected for histology. Here, the overview image is a cross-modiolar section from a deafened cochlea (scale bar = 500 µm). B,E. Representative maximum projection of confocal images obtained from immunolabelled cross-modiolar sections of spiral ganglion neurons (SGN, B, scale bar = 50 µm) and inner hair cells (IHC, E, scale bar = 50 µm). GFP (green) marks ChR-expressing cells. The SGNs were labelled with parvalbumin (magenta). The IHCs were labelled with calretinin (blue). C-D, F-G. Quantification of the SGN density (C), GFP+ SGN density (D), IHC density (F) and GFP+ IHC density (G). A filled circle was used when positive oABRs were measured and an open-triangle for the negative oABRs. (n.s., non-significant) H-I. Representative oABRs recorded in normal hearing (H) and deafened (I) cochleae following RWµ-cat + OW administration. The light intensity is color coded using the color scale in insert. J. Quantification of the oABR activation threshold measured from normal hearing (orange) and deafened (red) cochleae. K-M. Quantification of the P1 latency (K), P1-N1 amplitude (L) and P2-N2 amplitude (M) as a function of the light level relative to the oABR threshold. Box plots show minimum, 25th percentile, median, 75th percentile, and maximum (n.s., non-significant). Averaged ± SEM.
Figure 4
Figure 4
Contribution of optogenetically modified inner hair cell response to the oABRs. A. Quantification of the GFP+ SGN density as a function of the presence of the oABR response. B. For the cochleae where ChR-expressing IHC were observed, quantification of the IHC transduction as a function of the presence of the oABR. C. Quantification of the oABR threshold for cochlea where GFP+ IHC were present (green) or absent (purple). D-E. Quantification of the P1 latency (C), P1-N1 amplitude (D) as a function of the light level relative to the oABR threshold. Box plots show minimum, 25th percentile, median, 75th percentile, and maximum. Averaged ± SEM. Wilcoxon rank sum test (n.s., non-significant; *, P ≤ 0.05; **, P ≤ 0.01).

References

    1. WHO. Deafness and hearing loss [Internet]. WHO; 2021 Jan [cited 10 July 2022]. Available at: https://www.who.int/news-room/fact-sheets/detail/deafness-and-hearing-loss .
    1. Qi J, Tan F, Zhang L. et al. AAV-Mediated Gene Therapy Restores Hearing in Patients with DFNB9 Deafness. Adv Sci (Weinh) 2024;11:e2306788. - PMC - PubMed
    1. Lv J, Wang H, Cheng X. et al. AAV1-hOTOF gene therapy for autosomal recessive deafness 9: a single-arm trial. The Lancet. 2024;403:2317–25. - PubMed
    1. Lenarz T. Cochlear implant - state of the art. GMS Current Topics in Otorhinolaryngology - Head and Neck Surgery. 2018;16:Doc04. - PMC - PubMed
    1. Hunniford V, Kühler R, Wolf B, Keppeler D, Strenzke N, Moser T. Patient perspectives on the need for improved hearing rehabilitation: A qualitative survey study of German cochlear implant users. Frontiers in Neuroscience. 2023;17:1105562. - PMC - PubMed

Substances