. 2025;3(1):14.
doi: 10.1038/s44324-025-00057-2. Epub 2025 Apr 9.

Periodic dietary restriction of animal products induces metabolic reprogramming in humans with effects on cardiometabolic health

Affiliations

Periodic dietary restriction of animal products induces metabolic reprogramming in humans with effects on cardiometabolic health

Konstantinos Rouskas et al. NPJ Metab Health Dis. 2025.

Abstract

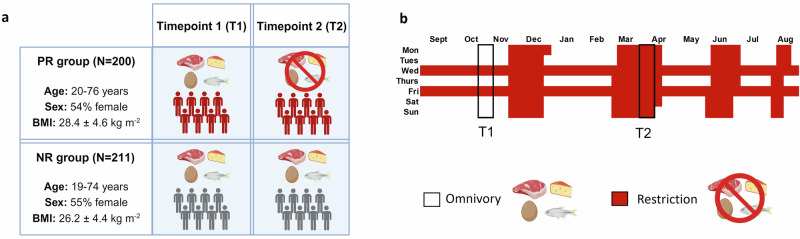
Dietary interventions constitute powerful approaches for disease prevention and treatment. However, the molecular mechanisms through which diet affects health remain underexplored in humans. Here, we compare plasma metabolomic and proteomic profiles between dietary states for a unique group of individuals who alternate between omnivory and restriction of animal products for religious reasons. We find that short-term restriction drives reductions in levels of lipid classes and of branched-chain amino acids, not detected in a control group of individuals, and results in metabolic profiles associated with decreased risk for all-cause mortality. We show that 23% of proteins whose levels are affected by dietary restriction are druggable targets and reveal that pro-longevity hormone FGF21 and seven additional proteins (FOLR2, SUMF2, HAVCR1, PLA2G1B, OXT, SPP1, HPGDS) display the greatest magnitude of change. Through Mendelian randomization we demonstrate potentially causal effects of FGF21 and HAVCR1 on risk for type 2 diabetes, of HPGDS on BMI, and of OXT on risk for lacunar stroke. Collectively, we find that restriction-associated reprogramming improves metabolic health and emphasise high-value targets for pharmacological intervention.

Keywords: Endocrine system and metabolic diseases; Metabolism; Metabolomics.


Conflict of interest statement

Competing interestsThe authors declare no competing interests.

Figures

Fig. 1
Fig. 1. Study design and periods of animal product restriction.
a Schematic of study design. Periodically restricted (PR) individuals alternate between omnivory and animal product restriction for religious reasons. These two dietary states were profiled at timepoint 1 (T1) and timepoint 2 (T2) respectively. Non-restricted (NR) individuals are continuously omnivorous and were also profiled at T1 and T2. Created with BioRender.com. b PR individuals practice animal product restriction for 180-200 days annually. Restriction is practiced during four extended periods throughout the year and on Wednesdays and Fridays of each week.
Fig. 2
Fig. 2. Differentially abundant metabolites (absolute levels) detected from T1 to T2 for each dietary group.
Metabolites are grouped into classes. Within lipid classes 1-7, lipoproteins are grouped by type and are ordered by size. Changes in metabolite profiles are shown in the outer circle for PR individuals and in the inner circle for NR individuals. The -log10 of the FDR-adjusted p-value (q-value) is represented on the y-axis. Yellow bars represent an increase in metabolite levels from T1 to T2 whereas blue bars represent a decrease. Metabolites shown in grey are not significant.
Fig. 3
Fig. 3. Differentially abundant metabolites (ratios and percentages) detected from T1 to T2 for each dietary group.
Metabolites ratios and percentages are grouped into classes. Within each class, lipoproteins are grouped by type and are ordered by size. Changes in metabolite profiles are shown in the outer circle for PR individuals and in the inner circle for NR individuals. The -log10 of the FDR-adjusted p-value (q-value) is represented on the y-axis. Yellow bars represent an increase in metabolite levels from T1 to T2 whereas blue bars represent a decrease. Metabolites shown in grey are not significant.
Fig. 4
Fig. 4. Heatmap of metabolite levels associated with animal product restriction (FastBio) and with cardiometabolic diseases (UK Biobank).
Disease codes included ICD10 starting with I- or E-. For each of the 23 metabolite classes, the most significant metabolite associated with animal product restriction was selected. Diseases with the most distinct metabolite profiles correspond to type 2 diabetes, chronic ischemic heart disease, essential hypertension, angina pectoris and disorders of lipoprotein metabolism, which are all strongly associated with lipoproteins. In the dendrogram, comparisons of the PR group between timepoints (PR_T2vsT1) and of dietary groups at T2 (T2_PRvsNR) each form their own distinct branches within their respective clusters. This arrangement highlights specific patterns of associations for PR and T2 that are distinct from those observed with prevalent cardiometabolic diseases in the UK Biobank.
Fig. 5
Fig. 5. Differentially abundant proteins detected from T1 to T2 for each dietary group.
Total differentially abundant proteins detected in the PR group (a) and in the NR group (b). Unique differentially abundant proteins detected in the PR group (c) and in the NR group (d). Proteins with increased levels at T2 are shown in yellow whereas proteins with decreased levels are shown in blue. Proteins shown in grey are not significant.
Fig. 6
Fig. 6. Proteins displaying the greatest magnitude of change linked to animal product restriction.
Eight proteins showing the greatest effect size changes from T1 to T2 and between dietary groups were identified through heterogeneity analysis using the Cochran’s statistics (associated p-value indicated in ‘Heterogeneity p-value’). Associations between levels of each protein and timepoints are shown in red for the PR group and in grey for the NR group.
Fig. 7
Fig. 7. Forest plot representing the effect sizes of two-sample MR for significant proteins-cardiometabolic traits.
The IVW method along with sensitivity analyses are shown for proteins with more than one IV, and the Wald ratio estimates are shown for proteins with only one IV.

References

    1. Fontana, L., Partridge, L. & Longo, V. D. Extending healthy life span–from yeast to humans. Science328, 321–326 (2010). - PMC - PubMed
    1. Green, C. L., Lamming, D. W. & Fontana, L. Molecular mechanisms of dietary restriction promoting health and longevity. Nat. Rev. Mol. Cell Biol.23, 56–73 (2022). - PMC - PubMed
    1. Lee, M. B., Hill, C. M., Bitto, A. & Kaeberlein, M. Antiaging diets: Separating fact from fiction. Science374, 953–961 (2021). - PMC - PubMed
    1. Longo, V. D. & Anderson, R. M. Nutrition, longevity and disease: From molecular mechanisms to interventions. Cell185, 1455–1470 (2022). - PMC - PubMed
    1. Longo, V. D., Di Tano, M., Mattson, M. P. & Guidi, N. Intermittent and periodic fasting, longevity and disease. Nat. Aging1, 47–59 (2021). - PMC - PubMed

LinkOut - more resources