. 2025 Jan 28:3:102.
doi: 10.12688/openreseurope.15906.2. eCollection 2023.

Mapping out the scenarios of ocean energy scale-up based on the development of offshore wind

Affiliations

Mapping out the scenarios of ocean energy scale-up based on the development of offshore wind

Anne-Caroline Pillet et al. Open Res Eur. .

Abstract

Background: Our oceans remain one of the last untapped large sources of renewable energy. The predictability and reliability of marine energy technologies could contribute significantly to the global energy transition. By 2022, marine energy, and in particular wave and tidal energy have reached a pre-commercial phase in their development.

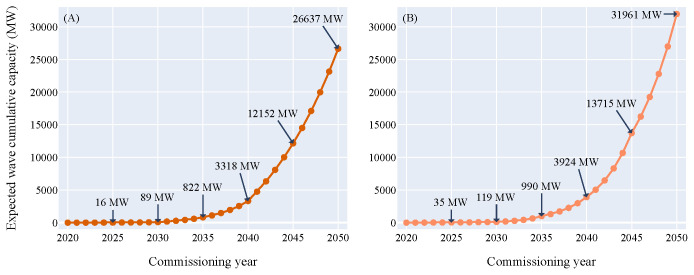
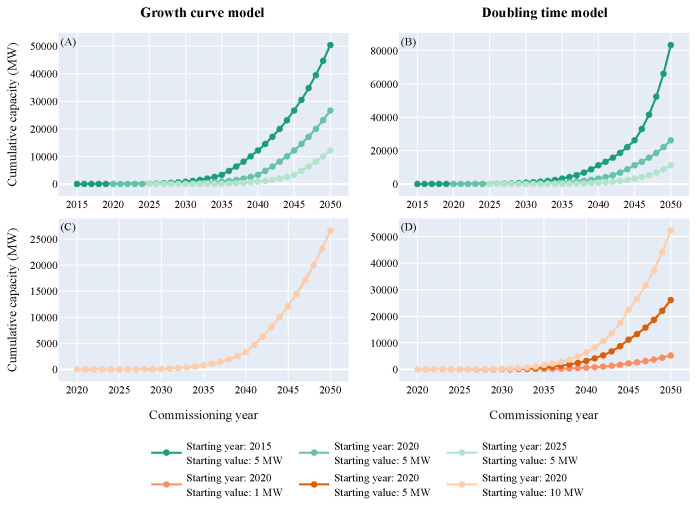
Methods: This study investigates the potential progression of the wave and tidal energy sector in the next three decades based on the offshore wind sector in the past three decades. Two different models were developed from the yearly capacity increase of offshore wind in Europe and applied to the wave and tidal energy sector.

Results: According to both models, the 40 GW 2050 target for marine energy set by the European Commission in 2020 could be reached if European coastal countries, including countries associated to the EU-27, adopt supportive policies for both technologies immediately. A sensitivity analysis shows further that a small delay right now will have tremendous negative impacts on fulfilling the EU goals and the contribution of marine energy to the energy transition.

Conclusions: The ocean energy sector shows a strong growth potential and is capable of supporting the European and global climate targets substantially by 2050. Lessons learned from the offshore wind sector can help scope and support the growth of marine energy technologies.

Keywords: European targets; Offshore energy; Offshore wind; Policy recommendations; Tidal; Wave.


Conflict of interest statement

No competing interests were disclosed.

Figures

Figure 1.
Figure 1.. Figure 1 depicts a flowchart summarizing the key steps that were used to build the model presented in this paper.
Each step will be further elaborated upon in this section.
Figure 2.
Figure 2.. Offshore wind cumulative capacity over the commissioning years.
( A) Growth curve model. Coefficients a and b are the two coefficients computed by the curve_fit function used to draw the exponential fitting curve. The fitting curve is split into three ten-year intervals: the "lag phase", the "kick-off phase" and the "growth phase". The coefficient of determination is higher than 0.9 for the three intervals. - ( B) Doubling time model. N is the number of doublings. The whole period is split into six five-year intervals in order to follow the original dataset closely. The global value of the coefficient of determination is higher than 0.99 which indicates that the model is close to the original dataset.
Figure 3.
Figure 3.. Expected tidal cumulative capacity over the commissioning years.
( A) Growth curve model - ( B) Doubling time model. Both models returned values with the same order of magnitude: between 46 and 58 MW could be deployed in 2025, between 323 and 594 MW in 2030 and between 40.3 and 44.7 GW in 2050. The red line displayed on the figure represents the tidal energy technical potential limitation in Europe which is around 20 GW. This limitation will be reached between 2044 and 2047 according to the models.
Figure 4.
Figure 4.. Expected wave cumulative capacity over the commissioning years.
( A) Growth curve model - ( B) Doubling time model. According to both models, between 16 and 35 MW of wave power could hit the water by 2025, between 89 and 119 MW by 2030 and between 26 and 32 GW by 2050. As the wave energy technical potential in Europe is not expected to be reached by 2050, the sector will likely keep growing significantly after 2050. The wave energy resource potential limitation (around 100 GW) is outside the graph boundaries and will not be met by 2050 according to both models.
Figure 5.
Figure 5.. Completion percentage of the European targets.
According to both models, the 2025 and 2030 targets will not be reached. Yet, the 2050 target could be overtaken. In order to get closer to the 2025 and 2030 targets, intensive support from European coastal countries are needed.
Figure 6.
Figure 6.. Expected LCoE over the commissioning years (the OEE dataset give the LCoE between 1 MW and 2000 MW of cumulative capacity).
The 100 EUR/MWh target set by the European Commission could be reached, for both technologies, around 2035. The wave LCoE is higher than the tidal LCoE for the first capacities deployed but as more capacities hit the water, the LCoE for both technologies comes closer together.
Figure 7.
Figure 7.. Sensitivity analysis of both models.
( A) Growth curve model, varying parameter=starting year - ( B) Doubling time model, varying parameter=starting year - ( C) Growth curve model, varying parameter=starting value - ( D) Doubling time model, varying parameter=starting value.
Figure 8.
Figure 8.
( A) Offshore wind cumulative capacity over the years for each European country - ( B) Offshore wind support schemes in Belgium - ( C) Offshore wind support schemes in Denmark - ( D) Offshore wind support schemes in Germany - ( E) Offshore wind support schemes in the Netherlands - ( F) Offshore wind support schemes in the United Kingdom. The first figure highlights the five European leading countries for offshore wind in terms of capacity deployed. Four different support schemes were used during the past 20 years: Feed-in Tariff, Feed-in Premium, Contract for Difference and Quota.
Figure 9.
Figure 9.. Completion percentage of the European targets in the best case scenario using the growth curve model.
The European targets could be greatly overtaken if actions are taken now.
Figure 10.
Figure 10.. Expected tidal and wave cumulative capacities according to the best case scenario using the growth curve model.
( A) Tidal - ( B) Wave Page

References

    1. International Energy Agency: Ocean power. Reference Source
    1. Nicholls-Lee RF, Turnock SR: Tidal energy extraction: renewable, sustainable and predictable. Sci Prog. 2008;91(Pt 1):81–111. 10.3184/003685008X285582 - DOI - PMC - PubMed
    1. van der Zant HF, Pillet AC, Schaap A, et al. : The energy park of the future: modelling the combination of wave-, wind-and solar energy in offshore multi-source parks. Heliyon. 2024;10(5): e26788. 10.1016/j.heliyon.2024.e26788 - DOI - PMC - PubMed
    1. Haces-Fernandez F, Li H, Ramirez D: A layout optimization method based on wave wake preprocessing concept for wave-wind hybrid energy farms. Energy Conv Manag. 2021;244: 114469. 10.1016/j.enconman.2021.114469 - DOI
    1. Azzellino A, Ferrante V, Kofoed JP, et al. : Optimal siting of offshore wind-power combined with wave energy through a marine spatial planning approach. Int J Mar Energy. 2013;3–4:e11–e25. 10.1016/j.ijome.2013.11.008 - DOI

LinkOut - more resources