. 2025 Mar 30;14(3):808-819.
doi: 10.21037/tau-2024-665. Epub 2025 Mar 26.

Personalized prediction for recurrence of cystitis glandularis: insights from SHAP and machine learning models

Affiliations

Personalized prediction for recurrence of cystitis glandularis: insights from SHAP and machine learning models

Yuyang Yuan et al. Transl Androl Urol. .

Abstract

Background: Cystitis glandularis (CG) is a rare urological condition characterized by glandular metaplasia of the bladder mucosa. Recurrence following transurethral resection (TUR) is a significant clinical challenge. Traditional predictive models often fail to capture the complexity of the data, resulting in insufficient accuracy. In contrast, machine learning (ML) has demonstrated substantial potential in medical prediction by identifying and analyzing complex patterns that are undetectable by conventional methods. This study aims to develop and evaluate an interpretable ML model to predict recurrence after TUR for CG, thereby improving clinical decision-making and patient outcomes.

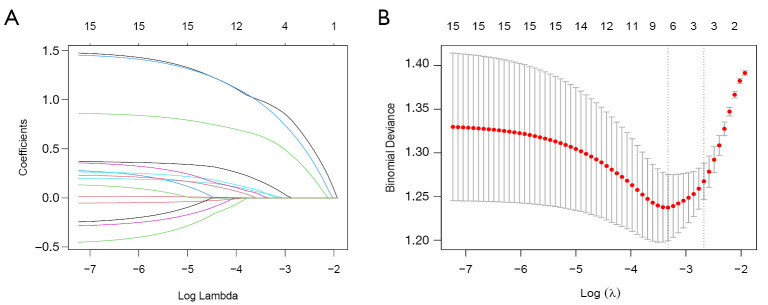
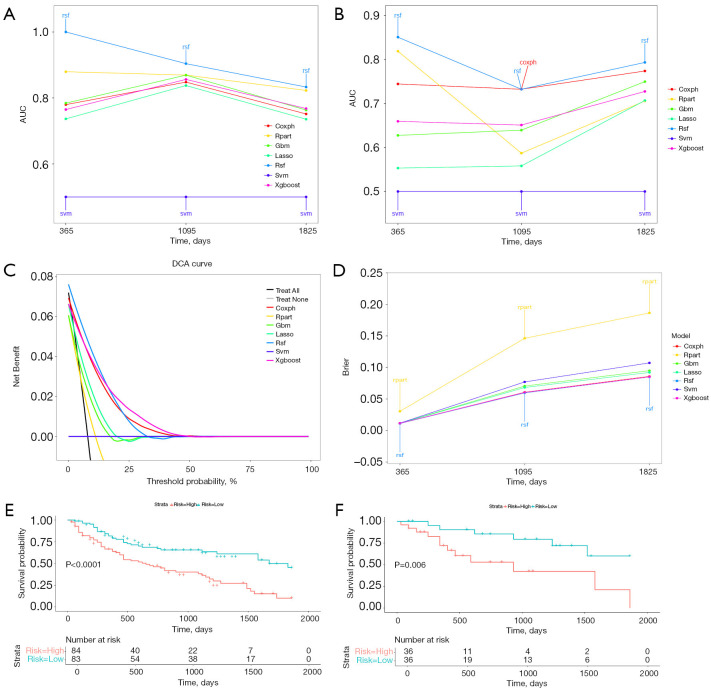
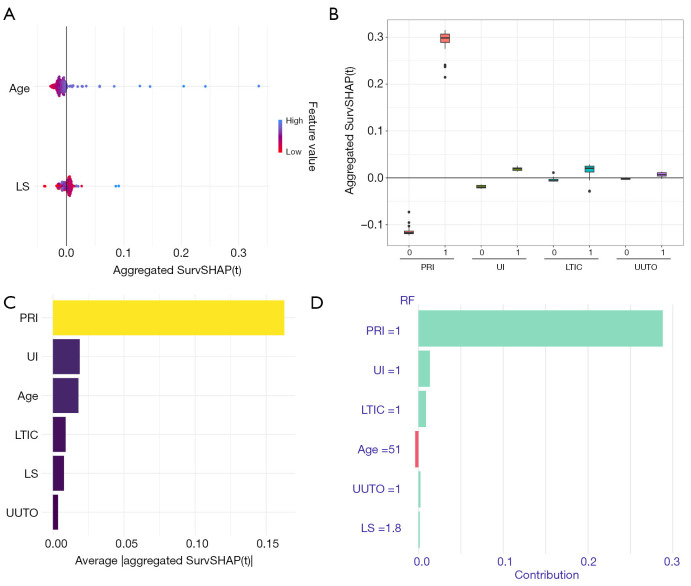
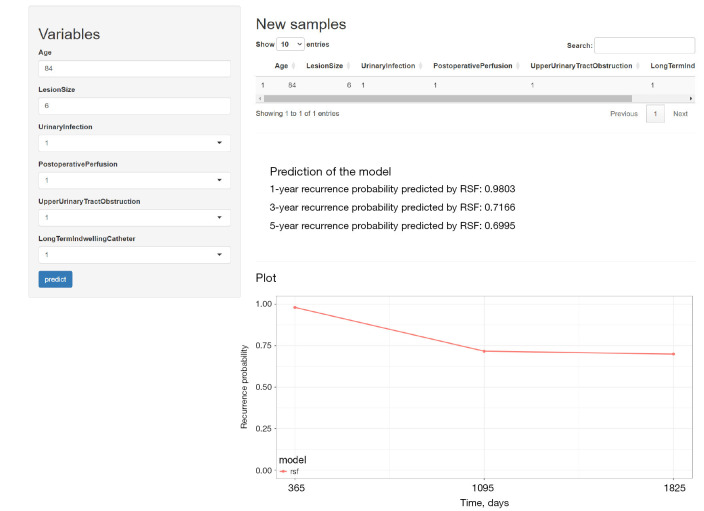
Methods: We analyzed predictors of recurrence using the least absolute shrinkage and selection operator (LASSO) and multivariate logistic regression. We developed and tested seven ML-based models: Cox proportional hazards model (CoxPH), LASSO regression, decision tree (rpart), random survival forest (RSF), gradient boosting machine (GBM), support vector machine (SVM), and extreme gradient boosting (XGBoost). Participants were diagnosed with CG by pathology following TUR and treated from 2012 to 2018. Model discrimination was assessed using the receiver operating characteristic (ROC) curve and area under the ROC curve (AUC), while model preference was evaluated through the Brier score (BS). Decision curve analysis (DCA) was used for model comparison. The SHapley Additive exPlanations (SHAP) method was employed for interpretation, providing insights into recurrence prediction and prevention strategies. Finally, user-friendly platform was developed, allowing users to predict CG recurrence by entering feature values into designated text boxes on the webpage.

Results: The RSF model demonstrated the best performance in predicting recurrence, as indicated by superior ROC, DCA, and BS metrics. In SHAP, postoperative regular instillation (PRI) contributed the most to model construction.

Conclusions: The RSF model effectively predicts CG recurrence, offering a framework for individualized treatment strategies. PRI was identified as the most significant risk factor influencing recurrence.

Keywords: Cystitis glandularis (CG); SHapley Additive exPlanations (SHAP); machine learning (ML); online platform; prediction model.


Conflict of interest statement

Conflicts of Interest: All authors have completed the ICMJE uniform disclosure form (available at https://tau.amegroups.com/article/view/10.21037/tau-2024-665/coif). The authors have no conflicts of interest to declare.

Figures

Figure 1
Figure 1
LASSO regression analysis for the selection of clinical features. (A) LASSO coefficient distribution diagram of clinical features. (B) LASSO regression analysis used the minimum criterion and ten folder crossvalidation method. By introducing a penalty adjustment parameter (λ) to compress the coefficients of clinical features, the coefficients of irrelevant features tend to zero, thereby achieving automatic screening of features. LASSO, least absolute shrinkage and selection operator.
Figure 2
Figure 2
ML model comprehensive analysis. (A) Training sets AUC and (B) testing sets AUC patients were sampled 10 times at a ratio of 7:3. (C) DCA where the black solid line represents the assumption that all patients will experience recurrence, and the blue solid line represents the assumption that no patients will experience recurrence.The remaining solid lines represent different models. (D) BS in all models. (E) Training sets Kaplan-Meier curves and (F) testing sets Kaplan-Meier curves. AUC, area under the ROC curve; BS, Brier score; CoxPH, Cox proportional hazards model; DCA, decision curve analysis; GBM, gradient boosting machine; LASSO, least absolute shrinkage and selection operator; ML, machine learning; ROC, receiver operating characteristic; RSF, random survival forest; rpart, decision tree; SVM, support vector machine; XGBoost, extreme gradient boosting.
Figure 3
Figure 3
SHAP interprets the model. (A) Attributes of continuous variables in SHAP. Each line represents a feature, and the abscissa is the SHAP value. Red dots represent higher eigenvalues and blue dots represent lower eigenvalues. (B) Attributes of categorical variables in SHAP, with higher values indicating greater eigenvalues. (C) Feature importance ranking as indicated by SHAP. The matrix diagram describes the importance of each covariate in the development of the final prediction model. (D) Single-sample prediction decomposition. SHAP values reflect the impact of each feature on the risk score (the risk of recurrence). Each variable’s SHAP value represents its contribution to the predicted outcome. Positive SHAP values indicate that the feature increases the risk of recurrence, while negative values suggest a reduction in risk. The plot illustrates the contribution of all input variables to the risk prediction for this individual sample. The order of the variables reflects their importance in the model’s prediction, with the most significant variables at the top. LS, lesion size; LTIC, long-term indwelling catheter; PRI, postoperative regular instillation; SHAP, SHapley Additive exPlanations; UI, urinary infection; UUTO, upper urinary tract obstruction.
Figure 4
Figure 4
The online platform prediction tool based on ML RSF model. ML, machine learning; RSF, random survival forest.

Similar articles

References

    1. Guo A, Liu A, Teng X. The pathology of urinary bladder lesions with an inverted growth pattern. Chin J Cancer Res 2016;28:107-21. - PMC - PubMed
    1. Singh J, Farooq S, Joshi S, et al. Histopathologic findings in patients who have undergone blue light cystoscopy and bladder biopsy or transurethral resection: A contemporary clinicopathologic analysis of 100 cases. Pathol Res Pract 2022;234:153916. 10.1016/j.prp.2022.153916 - DOI - PubMed
    1. Xin Z, Zhao C, Huang T, et al. Intestinal metaplasia of the bladder in 89 patients: a study with emphasis on long-term outcome. BMC Urol 2016;16:24. 10.1186/s12894-016-0142-x - DOI - PMC - PubMed
    1. Agrawal A, Kumar D, Jha AA, et al. Incidence of adenocarcinoma bladder in patients with cystitis cystica et glandularis: A retrospective study. Indian J Urol 2020;36:297-302. 10.4103/iju.IJU_261_20 - DOI - PMC - PubMed
    1. Hu H, Tang Y, Zhou B, et al. Anti-cystitis glandularis action exerted by glycyrrhetinic acid: bioinformatics analysis and molecular validation. Mol Divers 2025. [Epub ahead of print]. doi: .10.1007/s11030-025-11105-w - DOI - PubMed

LinkOut - more resources