. 2023 Mar 4:2023:6404468.
doi: 10.1155/2023/6404468. eCollection 2023.

Ascorbic Acid 2-Phosphate-Releasing Supercritical Carbon Dioxide-Foamed Poly(L-Lactide-Co-epsilon-Caprolactone) Scaffolds Support Urothelial Cell Growth and Enhance Human Adipose-Derived Stromal Cell Proliferation and Collagen Production

Affiliations

Ascorbic Acid 2-Phosphate-Releasing Supercritical Carbon Dioxide-Foamed Poly(L-Lactide-Co-epsilon-Caprolactone) Scaffolds Support Urothelial Cell Growth and Enhance Human Adipose-Derived Stromal Cell Proliferation and Collagen Production

Alma Kurki et al. J Tissue Eng Regen Med. .

Abstract

Tissue engineering can provide a novel approach for the reconstruction of large urethral defects, which currently lacks optimal repair methods. Cell-seeded scaffolds aim to prevent urethral stricture and scarring, as effective urothelium and stromal tissue regeneration is important in urethral repair. In this study, the aim was to evaluate the effect of the novel porous ascorbic acid 2-phosphate (A2P)-releasing supercritical carbon dioxide-foamed poly(L-lactide-co-ε-caprolactone) (PLCL) scaffolds (scPLCLA2P) on the viability, proliferation, phenotype maintenance, and collagen production of human urothelial cell (hUC) and human adipose-derived stromal cell (hASC) mono- and cocultures. The scPLCLA2P scaffold supported hUC growth and phenotype both in monoculture and in coculture. In monocultures, the proliferation and collagen production of hASCs were significantly increased on the scPLCLA2P compared to scPLCL scaffolds without A2P, on which the hASCs formed nonproliferating cell clusters. Our findings suggest the A2P-releasing scPLCLA2P to be a promising material for urethral tissue engineering.


Conflict of interest statement

The authors declare that there are no conflicts of interest.

Figures
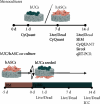
Figure 1
Figure 1
Research timeline for hUC and hASC monocultures and hUC/hASC coculture. The hUC and hASC monocultures were treated similarly. In coculture, the hASCs were seeded in basic medium (BM) five days prior to seeding the hUCs on the opposite side of the scaffold and changing the coculture medium to EpiLife. The time points for mono- and cocultures were d1, d7, and d14.
Figure 2
Figure 2
Micro-CT images of the scPLCLA2P and scPLCL scaffolds. Overall structure of scPLCLA2P scaffolds (a), volume (3.8 × 3.8 × 1.2 mm) of scPLCLA2P used in the porosity and A2P particle distribution measurements (b), distribution of the A2P particles in scPLCLas (c), particle size distribution (n = 3) (d), overall structure of scPLCL scaffolds (e), and volume (3.8 × 3.8 × 1.2 mm) of scPLCL used in the porosity measurements (f). Scale bar 500 µm.
Figure 3
Figure 3
Micro-CT analysis of the scaffold pore sizes and interconnectivity. (a) Scaffold pore interconnectivity as a function of particle size capable of passing through the interconnected pores entering from outside of the scaffold. Distribution of pore sizes in scPLCLA2P (b) and scPLCL (c). Color scale represents the size of a particle capable of entering a pore (0–1000 µm). Scale bar 500 µm.
Figure 4
Figure 4
Viability of hUCs monoculture on scPLCLA2P and scPLCL at d1, d7, and d14. Viable cells are shown green and dead cells red. Cell growth seems parallel on both scaffolds. Scale bar 500 µm.
Figure 5
Figure 5
Viability of hASCs monoculture on scPLCLA2P and scPLCL at d1, d7, and d14. Viable cells are shown green and dead cells red. The hASCs appear to be spreading more on scPLCLA2P than on scPLCL. Scale bar 500 µm.
Figure 6
Figure 6
Scanning electron microscope (SEM) images showing the morphology of hUCs in monoculture on scPLCLA2P and scPLCL at d1, d7, and d14. Spreading of hUCs seems similar on both scaffolds, yet on d14, the hUCs on scPLCLas seem to have acquired more structural apical surface (arrows). Scale bar 100 µm.
Figure 7
Figure 7
Scanning electron microscope (SEM) images showing the morphology of hASCs in monoculture on scPLCLA2P and scPLCL at d1, d7, and d14. The hASCs on scPLCLA2P appear to spread more along the scaffold compared to scPLCL. Scale bar 100 µm.
Figure 8
Figure 8
Fluorescent images showing the viability of hUCs and hASCs in hUC/hASC coculture on scPLCLA2P and scPLCL at d1, d7, and d14 time points. Viable cells stain green and dead cells red. Cell growth of hUCs remains similar on both scaffolds. Viability of hASCs is supported better on scPLCLA2P, whereas hASCs on scPLCL seem to diminish during the coculture. Scale bar 500 µm.
Figure 9
Figure 9
Cell number of hUC and hASC monocultures relative to d 1 scPLCL CyQUANT mean result (n = 18–27). Relative hUC number (a) was significantly higher on scPLCL than on scPLCLA2P at each time point (d1–d 7 p < 0.001, d1–d14 p=0.009). On scPLCLA2P, the relative hUC number significantly increased between d1–d7 (p=0.022) and d1–d14 (p=0.001). On scPLCL, the hUC number increased d1–d7 and d1–d14 (p < 0.001), but no statistical significance was detected between d7–d14 (p=0.823). Relative number of hASCs (b) was similar on both scaffolds on d 1 (p=0.27), but significantly higher on scPLCLas than on scPLCL on d7 and d14 (p < 0.001). During the assessment period, relative hASC number on scPLCLA2P increased between each time point (d1–d7 p < 0.001, d1–d14 p < 0.001, d7–d14 p < 0.003). On scPLCL, hASC number increased between d1–d7 (p=0.002) and d1–d14 (p < 0.001). (∗∗=p < 0.01).
Figure 10
Figure 10
Total amount of collagen present in hUC and hASC monocultures on d 14 (n = 18). For hUCs, the amount of total collagen was higher on scPLCL compared to scPLCLA2P, whereas for hASCs, the total collagen amount was significantly higher on scPLCLA2P. (∗∗=p < 0.01).
Figure 11
Figure 11
The hUC expression of epithelial markers in monoculture on d14 relative to d1 results of a single used donor hUC line. The expression of CK7 mRNA was significantly increased on scPLCLA2P (c). (p=0.004) compared to scPLCL. No significant difference was detected in the expressions of UPIa (a) (p=0.329), UPIb (b) (p=0.931), CK8 (d) (p=1.0), or CK19 (e) (p=0.52) between scaffolds. (n = 6, ∗∗=p < 0.01).
Figure 12
Figure 12
The hASC expression of stromal markers in monoculture on d14 relative to d1 results of a single used donor hASC line. The expression of COL III (d) and αSMA (a) mRNA was increased on scPLCLA2P (p=0.004 and 0.017, respectively). No significant difference in COL I (c); (p=0.429) or elastin (b); (p=0.931) mRNA was detected between the scaffolds. Ratio of the expressed COL I/COL III mRNA (e) was similar on both scaffolds. (n = 6, =p < 0.05, ∗∗=p < 0.01).
Figure 13
Figure 13
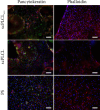
Immunofluorescent staining for pancytokeratin (green) and cytochemical staining for F-actin (red) in hUC/hASC coculture on d 14 on scPLCLA2P and scPLCL. The hUCs on the left panel and the hASCs on the right panel. The PS served as a control material. Scale bar 100 µm.
Figure 14
Figure 14
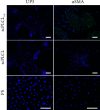
Immunofluorescence staining for UPIII (red) in hUCs and for αSMA (green) in hASCs in hUC/hASC coculture on d 14 on scPLCLA2P and scPLCL. hUCs on the left panel and hASCs on the right panel. Control stainings were performed with hUC and hASC monocultures on PS. The hUCs on all materials stain for UPIII. For hASCs, αSMA is present on all materials, yet it seems more abundant on scPLCLA2P. Scale bar 100 µm.

Similar articles

References

    1. Santucci R. A., Joyce G. F., Wise M. Male urethral stricture disease. The Journal of Urology . 2007;177(5):1667–1674. doi: 10.1016/j.juro.2007.01.041. - DOI - PubMed
    1. Lazzeri M., Sansalone S., Guazzoni G., Barbagli G. Incidence, causes, and complications of urethral stricture disease. European Urology Supplements . 2016;15(1):2–6. doi: 10.1016/j.eursup.2015.10.002. - DOI
    1. van der Horst H. J. R., de Wall L. L. Hypospadias, all there is to know. European Journal of Pediatrics . 2017;176(4):435–441. doi: 10.1007/s00431-017-2864-5. - DOI - PMC - PubMed
    1. Dugi D. D., Simhan J., Morey A. F. Urethroplasty for stricture disease: contemporary techniques and outcomes. Urology . 2016;89:12–18. doi: 10.1016/j.urology.2015.12.012. - DOI - PubMed
    1. Versteegden L. R. M., de Jonge P. K. J. D., IntHout J., et al. Tissue engineering of the urethra: a systematic review and meta-analysis of preclinical and clinical studies. European Urology . 2017;72(4):594–606. doi: 10.1016/j.eururo.2017.03.026. - DOI - PubMed

LinkOut - more resources