

Resolving Heterogeneity in Posttraumatic Stress Disorder Using Individualized Structural Covariance Network Analysis
- PMID: 40226723
- PMCID: PMC11919208
- DOI: 10.1155/2024/4399757
Resolving Heterogeneity in Posttraumatic Stress Disorder Using Individualized Structural Covariance Network Analysis
Abstract
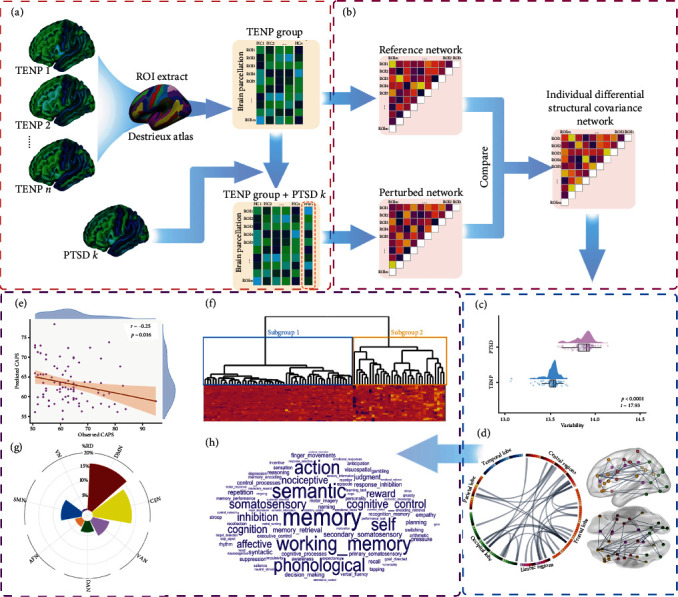
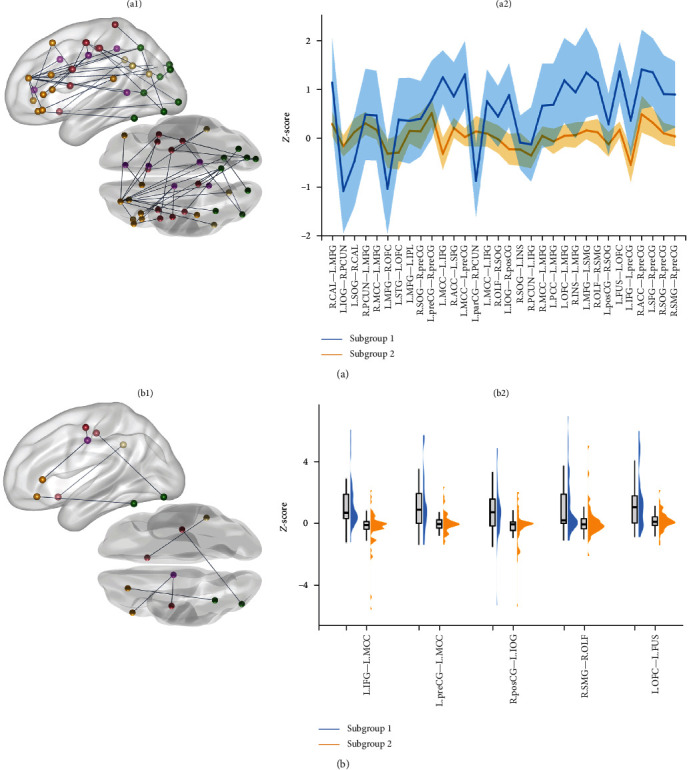
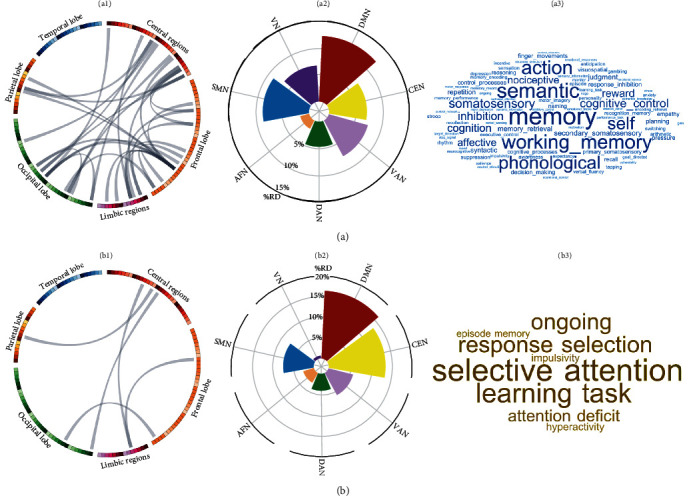
The heterogeneity of posttraumatic stress disorder (PTSD) is an obstacle to both understanding and therapy, and this has prompted a search for internally homogeneous neuroradiological subgroups within the broad clinical diagnosis. We set out to do this using the individual differential structural covariance network (IDSCN). We constructed cortical thickness-based IDSCN using T1-weighted images of 89 individuals with PTSD (mean age 42.8 years, 60 female) and 89 demographically matched trauma-exposed non-PTSD (TENP) controls (mean age 43.1 years, 63 female). The IDSCN metric quantifies how the structural covariance edges in a patient differ from those in the controls. We examined the structural diversity of PTSD and variation among subtypes using a hierarchical clustering analysis. PTSD patients exhibited notable diversity in distinct structural covariance edges but mainly affecting three networks: default mode, ventral attention, and sensorimotor. These changes predicted individual PTSD symptom severity. We identified two neuroanatomical subtypes: the one with higher PTSD symptom severity showed lower structural covariance edges in the frontal cortex and between frontal, parietal, and occipital cortex-regions that are functionally implicated in selective attention, response selection, and learning tasks. Thus, deviations in structural covariance in large-scale networks are common in PTSD but fall into two subtypes. This work sheds light on the neurobiological mechanisms underlying the clinical heterogeneity and may aid in personalized diagnosis and therapeutic interventions.
Keywords: PTSD; heterogeneity; individual differential structural covariance network; psychoradiology; subtypes.
Copyright © 2024 Xueling Suo et al.
Conflict of interest statement
The authors declare no conflicts of interest.
Figures
Similar articles
-
Structural covariance network centrality in maltreated youth with posttraumatic stress disorder.J Psychiatr Res. 2018 Mar;98:70-77. doi: 10.1016/j.jpsychires.2017.12.015. Epub 2017 Dec 25. J Psychiatr Res. 2018. PMID: 29294430 Free PMC article.
-
Using individualized structural covariance networks to analyze the heterogeneity of cerebral small vessel disease with cognitive impairment.J Stroke Cerebrovasc Dis. 2024 Nov;33(11):107829. doi: 10.1016/j.jstrokecerebrovasdis.2024.107829. Epub 2024 Jun 18. J Stroke Cerebrovasc Dis. 2024. PMID: 38901472
-
Reduced local segregation of single-subject gray matter networks in adult PTSD.Hum Brain Mapp. 2018 Dec;39(12):4884-4892. doi: 10.1002/hbm.24330. Epub 2018 Aug 10. Hum Brain Mapp. 2018. PMID: 30096216 Free PMC article.
-
Annual Research Review: Pediatric posttraumatic stress disorder from a neurodevelopmental network perspective.J Child Psychol Psychiatry. 2019 Apr;60(4):395-408. doi: 10.1111/jcpp.12996. Epub 2018 Oct 25. J Child Psychol Psychiatry. 2019. PMID: 30357832 Review.
-
Structural white matter changes in adults and children with posttraumatic stress disorder: A systematic review and meta-analysis.Neuroimage Clin. 2018 May 16;19:581-598. doi: 10.1016/j.nicl.2018.05.013. eCollection 2018. Neuroimage Clin. 2018. PMID: 29984166 Free PMC article.
Cited by
-
The epidemiology of maternal mental health in Africa: a systematic review.Arch Womens Ment Health. 2025 Apr 12. doi: 10.1007/s00737-025-01563-4. Online ahead of print. Arch Womens Ment Health. 2025. PMID: 40220206 Review.
-
Social and Economic Correlates of Prenatal Depression in Rural Bangladeshi Women.Matern Child Health J. 2025 Jul;29(7):977-985. doi: 10.1007/s10995-025-04087-6. Epub 2025 Mar 27. Matern Child Health J. 2025. PMID: 40148712 Free PMC article.
References
-
- Bao W., Gao Y., Cao L., et al. Alterations in Large-Scale Functional Networks in Adult Posttraumatic Stress Disorder: A Systematic Review and Meta-Analysis of Resting-State Functional Connectivity Studies. Neuroscience & Biobehavioral Reviews . 2021;131:1027–1036. doi: 10.1016/j.neubiorev.2021.10.017. - DOI - PubMed
Publication types
MeSH terms
LinkOut - more resources
Full Text Sources
Medical
