. 2025 Jul 7;222(7):e20231467.
doi: 10.1084/jem.20231467. Epub 2025 Apr 14.

Enhanced TLR7-dependent production of type I interferon by pDCs underlies pandemic chilblains

Affiliations

Enhanced TLR7-dependent production of type I interferon by pDCs underlies pandemic chilblains

Fanny Saidoune et al. J Exp Med. .

Abstract

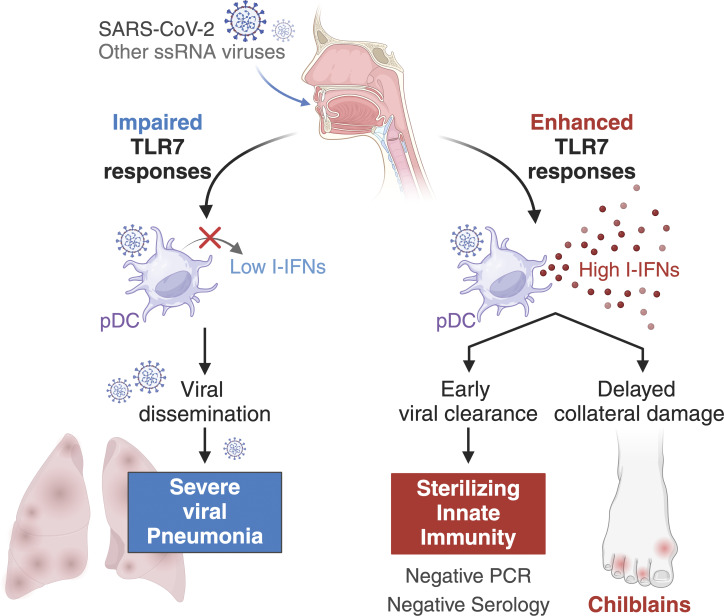
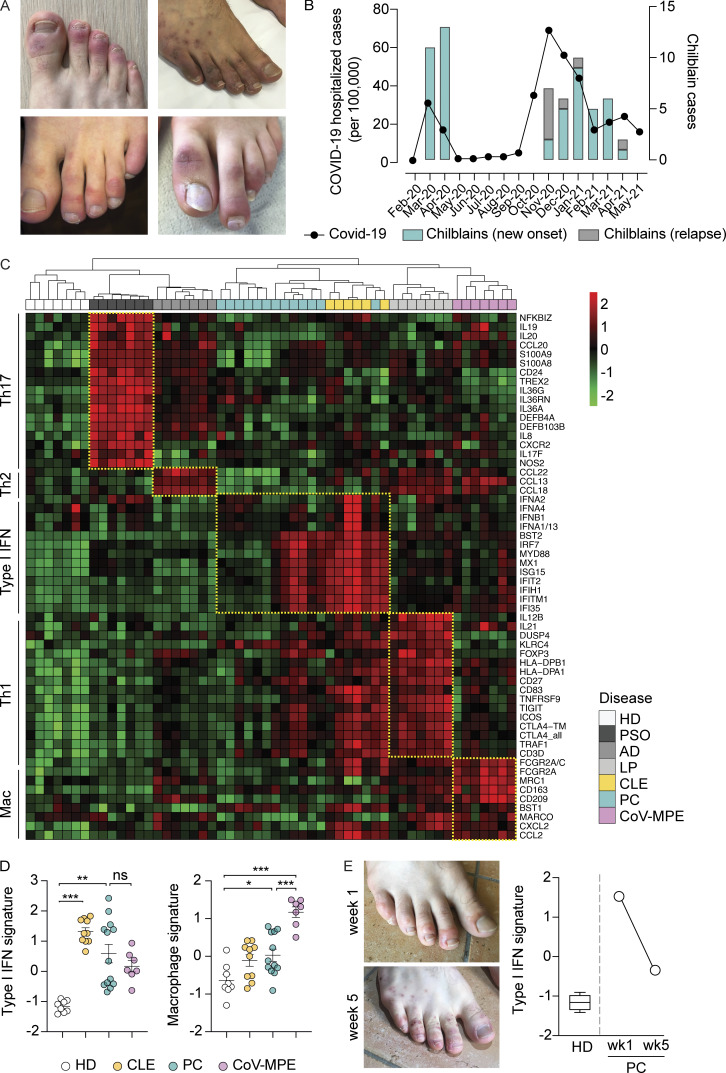
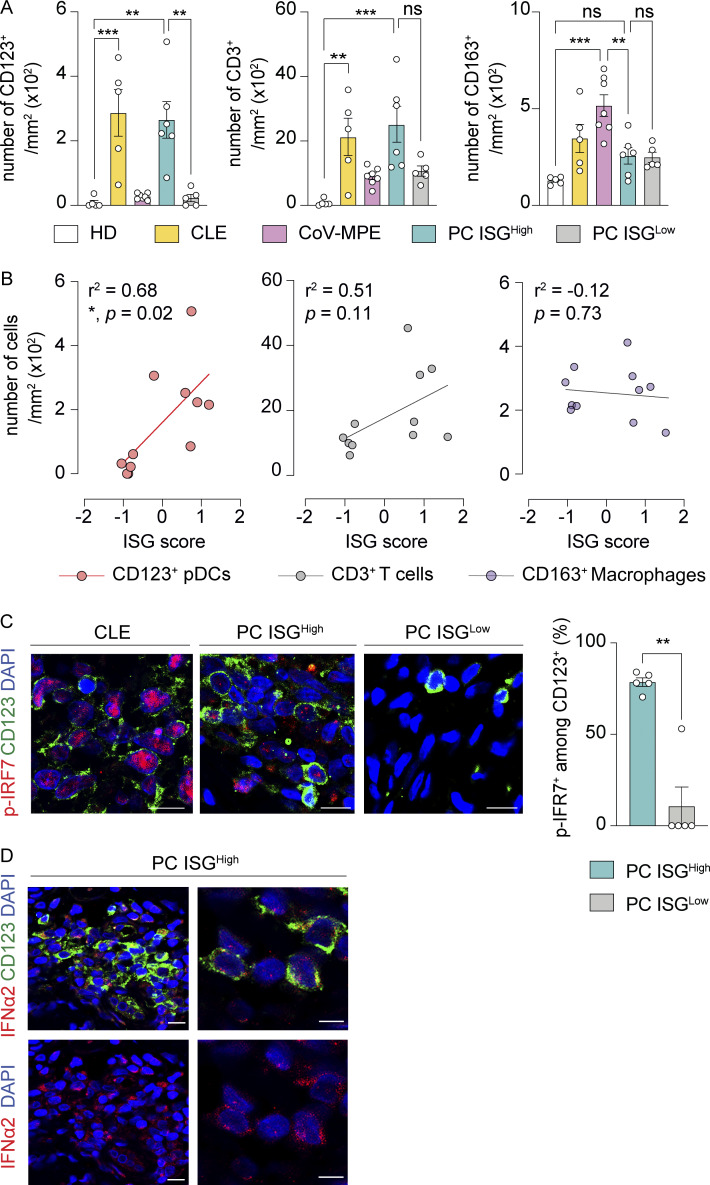
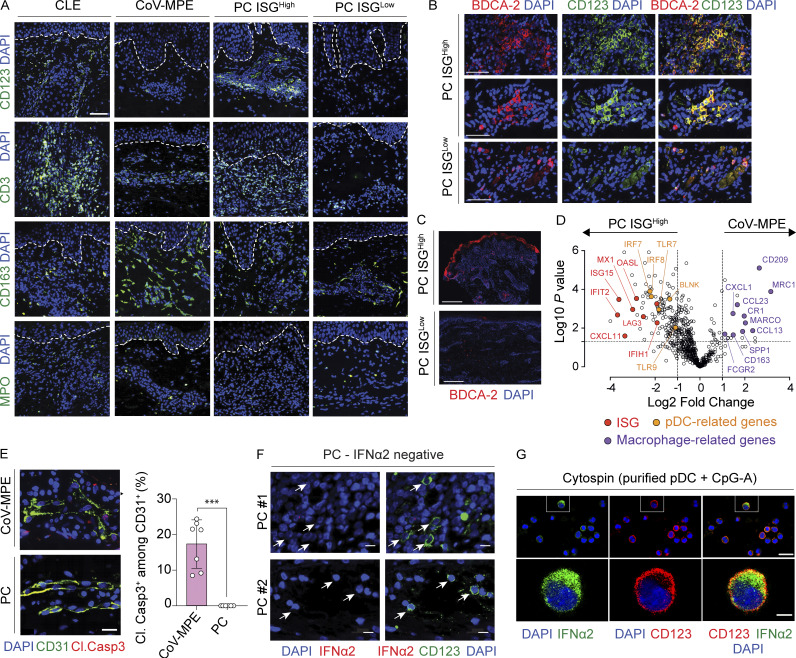
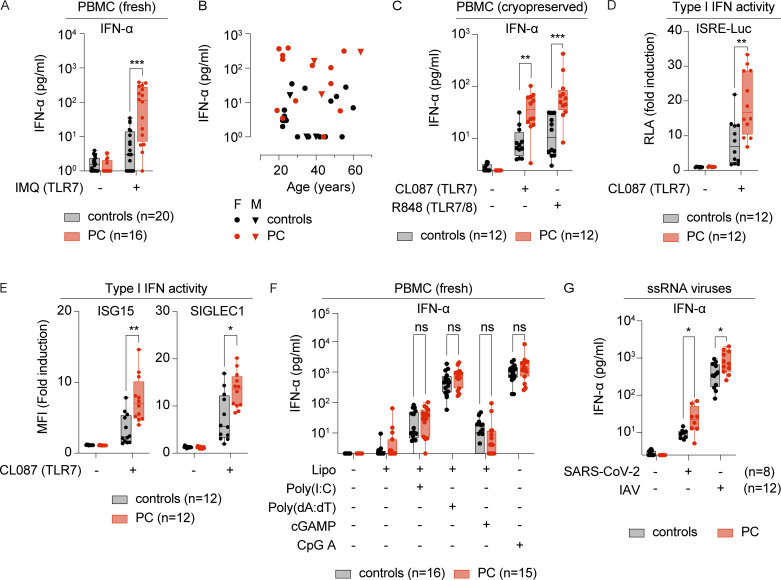
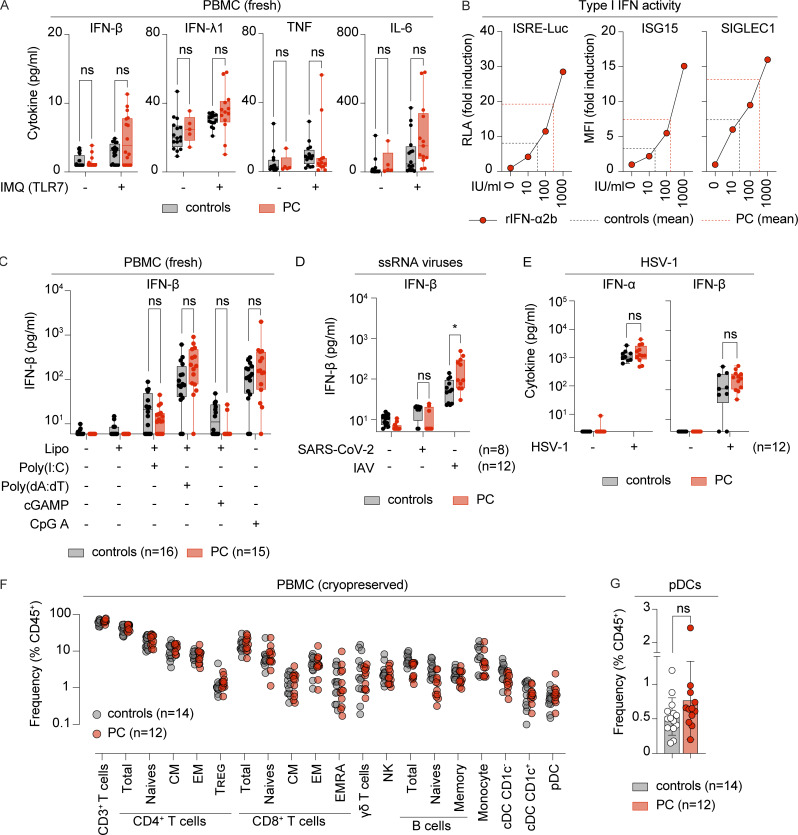
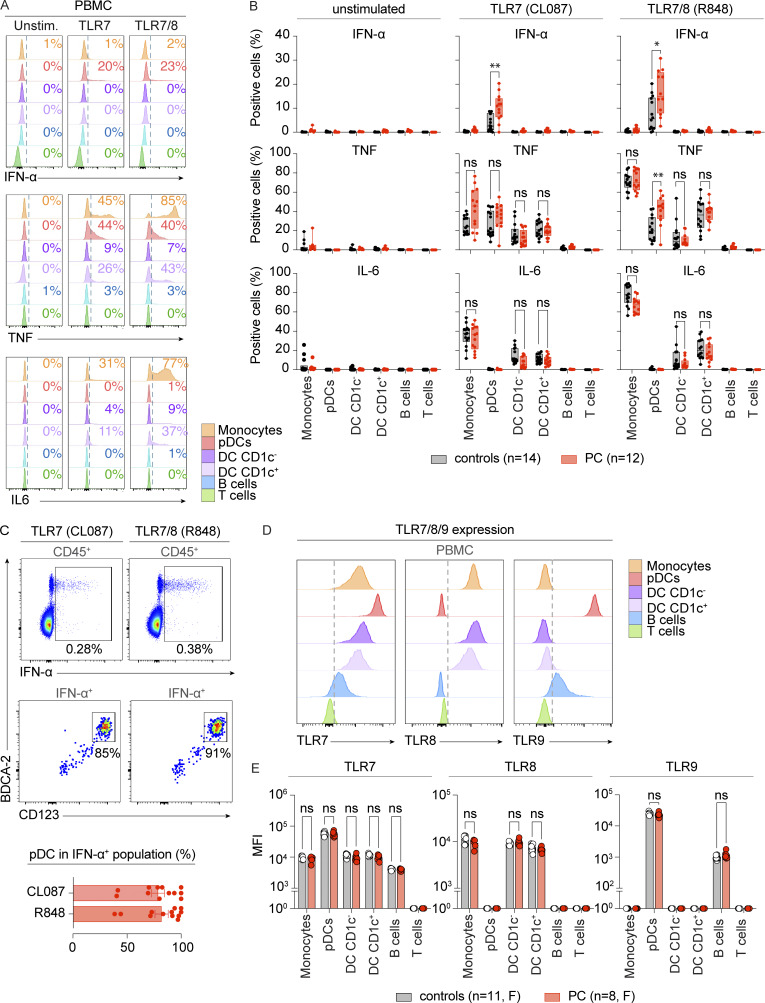
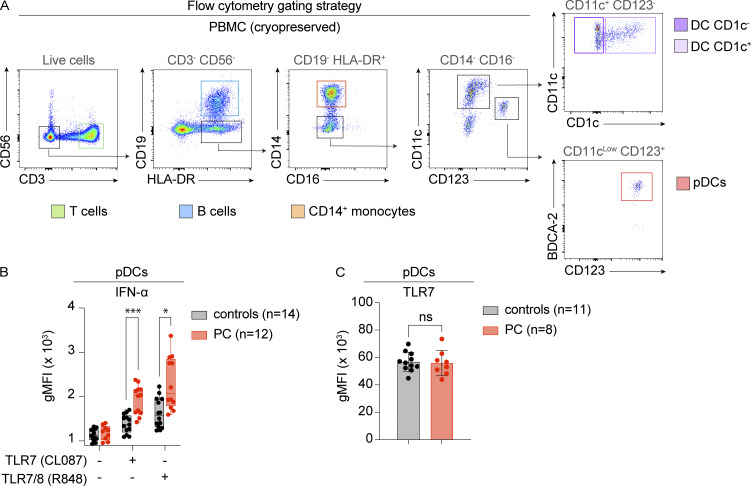
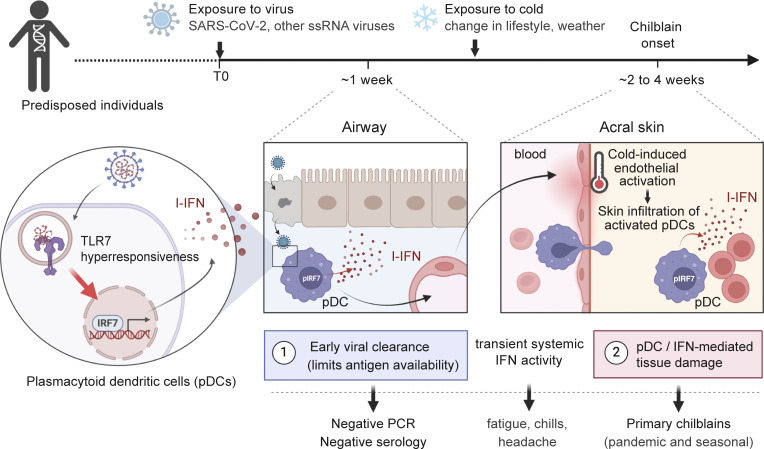
Outbreaks of chilblains were reported during the COVID-19 pandemic. Given the essential role of type I interferon (I-IFN) in protective immunity against SARS-CoV-2 and the association of chilblains with inherited type I interferonopathies, we hypothesized that excessive I-IFN responses to SARS-CoV-2 might underlie the occurrence of chilblains in this context. We identified a transient I-IFN signature in chilblain lesions, accompanied by an acral infiltration of activated plasmacytoid dendritic cells (pDCs). Patients with chilblains were otherwise asymptomatic or had mild disease without seroconversion. Their leukocytes produced abnormally high levels of I-IFN upon TLR7 stimulation with agonists or ssRNA viruses-particularly SARS-CoV-2-but not with DNA agonists of TLR9 or the dsDNA virus HSV-1. Moreover, the patients' pDCs displayed cell-intrinsic hyperresponsiveness to TLR7 stimulation regardless of TLR7 levels. Inherited TLR7 or I-IFN deficiency confers a predisposition to life-threatening COVID-19. Conversely, our findings suggest that enhanced TLR7 activity in predisposed individuals could confer innate, pDC-mediated, sterilizing immunity to SARS-CoV-2 infection, with I-IFN-driven chilblains as a trade-off.


Conflict of interest statement

Disclosures: The authors declare no competing interests exist.

Figures

None
Graphical abstract
Figure 1.
Figure 1.
Dominant I-IFN signature in PC. (A) Photographs of PC (COVID toes). (B) Temporal association between chilblain outbreaks and local waves of COVID-19. The line shows the number of hospitalizations for laboratory-confirmed COVID-19 in Switzerland (admissions per month per 100,000 inhabitants) (Bundesamt für Statistik, 2022). The histograms show the number of chilblain cases enrolled per month (initial onset and relapses). (C) NanoString profiling of immune gene expression for PC and common inflammatory skin diseases. The heatmap shows Z-scores with unsupervised clustering of immune gene expression profiling results for PC (n = 13), plaque-type psoriasis (PSO, n = 7), atopic dermatitis (AD, n = 7), lichen planus (LP, n = 7), CLE (n = 6), CoV-MPE (n = 7), and healthy skin (HD, n = 7). Differentially expressed genes were used to generate disease-related gene signatures, including T helper (Th)17, Th2, Th1, I-IFN, and macrophage (Mac) signatures (immune modules). Red corresponds to upregulated genes, and green to downregulated genes. The yellow dashed lines indicate the upregulated immune modules across patient groups. (D) Type I IFN signature (left) and macrophage signature (right) in HD and inflammatory lesions from individuals with CLE, PC, and CoV-MPE. Bars represent the mean and SEM. (E) Photographs of lesions taken from the same patient during the early inflammatory phase (week 1, wk1) and the postinflammatory phase (week 5, wk5). Right panel: I-IFN signature in skin biopsy specimens from the lesions shown in the left panel, and for healthy skin from volunteers (HD, n = 7). The scores in D and E were calculated by determining the normalized mean expression level of the corresponding genes across all samples (Z-score). The adjusted P values in D were obtained in Brown–Forsythe Welch’s ANOVA followed by Dunnett’s test for multiple comparisons for datasets that were normally distributed, and Kruskal–Wallis tests followed by Dunn’s test for multiple comparisons for datasets that were not normally distributed. ***P < 0.001; **P < 0.01; *P < 0.05; ns = nonsignificant.
Figure 2.
Figure 2.
Large numbers of pDCs in PC. (A) Quantification of CD123+ cells (marker of pDCs), CD3+ cells (T cells), and CD163+ cells (macrophages) in healthy skin (HD, n = 5), CLE (n = 5), CoV-MPE (n = 7), and PC with a high (PC ISGHigh, n = 6) or low I-IFN signature score (PC ISGLow, n = 5). Adjusted P values were obtained in one-way ANOVA followed by Tukey’s tests for multiple comparisons. (B) Correlation between the ISG signature score calculated from the mean level of expression of IRF7, MYD88, MX1, ISG15, IFITM1, and IFI35 (normalized across samples) and the number of CD123+ pDCs, CD3+ T cells, and CD163+ macrophages in PC lesions. Correlations were analyzed in Pearson’s tests. (C) Confocal microscopy images of representative CLE, ISGHigh PC, and ISGLow PC skin lesions stained for CD123 (green) and phosphorylated-IRF7 (p-IRF7, red). Scale bar, 10 μm. Right panel: proportions of CD123+ pDCs displaying nuclear p-IRF7+ staining in ISGhigh PC and ISGLow PC. Adjusted P values were obtained in Mann–Whitney tests. (D) Confocal microscopy images of ISGhigh PC lesions stained for CD123 (green) and IFN-α2 (red). Left panel: low magnification. Scale bar, 10 μm. Right panel: high magnification. Scale bar, 5 μm. ***P < 0.001; **P < 0.01; *P < 0.05; ns = nonsignificant.
Figure S1.
Figure S1.
Related to Fig. 2. (A) Confocal microscopy images of CD123+ cells (marker of pDCs), CD3+ cells (T cells), CD163+ cells (macrophages), and MPO+ cells (neutrophils) in skin lesions from individuals with CLE, CoV-MPE, and ISGhigh and ISGLow PC. Representative images from 5 CLE, 7 CoV-MPE, 6 PC ISGhigh, and 5 PC ISGLow patients are shown. Scale bars, 50 μm. (B) Confocal microscopy images of representative PC ISGhigh and PC ISGLow skin lesions stained for CD123 (green) and BDCA-2 (red). Scale bar, 50 μm. (C) Microscopy images of representative PC ISGhigh and PC ISGLow skin lesions stained for BDCA-2 (red). Scale bar, 500 μm. (D) Volcano plot of differentially expressed genes (DEG) in CoV-MPE (right) versus PC ISGhigh (left). Macrophage-related DEG (purple), pDC-related DEG (orange), and type I ISG (red) are highlighted. (E) Absence of endothelial cell death in PC. Confocal microscopy images (left) and quantification (right) of cleaved caspase-3 (Cl.Casp3) in CD31+ endothelial cells in skin lesions from CoV-MPE (n = 7) and PC patients (n = 6). Scale bar, 20 μm. ***P < 0.001. (F) Negative controls for IFN-α2 staining. Confocal microscopy images of representative sections from two IFN-α2–negative PC skin lesions stained for CD123 (green) and IFN-α2 (red). Each skin sample is displayed in either the upper or the lower panel (scale bar, 10 μm). Arrows indicate CD123+ pDC cells. (G) Positive controls for IFN-α2 staining. Confocal microscopy images of cytospin preparations stained for IFN-α2 (green) and CD123 (red). pDC-enriched fractions from fresh PBMCs were stimulated with CpG-A prior to cytospin. The upper row shows images at low magnification (scale bar, 20 μm), and the lower row shows images at high magnification (scale bar, 5 μm).
Figure 3.
Figure 3.
Enhanced TLR7 responses in patients with PC. (A and B) PBMCs from chilblain patients (PC, n = 16) or HD (controls, n = 20) were stimulated with the TLR7-selective agonist IMQ for 24 h. (A) Secreted IFN-α was evaluated in a LEGENDplex assay. (B) IFN-α production in response to IMQ is shown relative to the age of female (F) and male (M) patients or controls. Freshly isolated PBMCs were used in these experiments. (C) PBMCs from chilblain patients (PC, n = 12) or HD (controls, n = 12) were stimulated with the TLR7-selective agonist CL087 and the dual TLR7/8 agonist R848 for 24 h. Secreted IFN-α was evaluated in a LEGENDplex assay. Cryopreserved PBMCs were used in these experiments. (D) ISRE reporter cells (expressing luciferase under the control of an ISRE, THP1-Dual) were treated with supernatants from the CL087-stimulated PBMCs of chilblain patients (PC, n = 12) or HD (controls, n = 12). Luciferase activity was quantified with a luminometer, and RLA is represented as fold induction over untreated reporter cells. (E) THP1-Dual cells were treated with the supernatants of CL087-stimulated PBMCs from chilblain patients (PC, n = 12) or HD (controls, n = 12). The expression of ISG15 and SIGLEC1 was analyzed by flow cytometry with intracellular staining. Graphs show MFI as fold induction over basal levels in THP1 cells. (F) PBMCs from chilblain patients (PC, n = 15) or HD (controls, n = 16) were stimulated with viral nucleic acid surrogates for 24 h. Secreted IFN-α levels were evaluated in a LEGENDplex assay after stimulation with liposome-encapsulated poly(I:C), cGAMP (STING agonist) or poly(dA:dT) (cytosolic DNA sensors), or naked CpG-A (TLR9 agonist). Freshly isolated PBMCs were used in these experiments. (G) PBMCs from chilblain patients (PC) or HD (controls) were stimulated for 24 h with SARS-CoV-2 virus (n = 8) or IAV (n = 12). Secreted IFN-α was evaluated in a LEGENDplex assay. Cryopreserved PBMCs were used in these experiments. Adjusted P values in A and C–G were determined in Mann–Whitney tests with the Bonferroni correction for multiple testing. ***P < 0.001; **P < 0.01; *P < 0.05; ns = nonsignificant. IMQ, imiquimod; RLA, relative luciferase activity; MFI, mean fluorescence intensity; IAV, influenza A virus.
Figure S2.
Figure S2.
Related to Fig. 3 . (A) PBMCs from chilblain patients (PC, n = 13) or HD (controls, n = 16) were stimulated with the TLR7-selective agonist IMQ for 24 h. Secreted cytokines were evaluated in a LEGENDplex assay. Freshly isolated PBMCs were used in these experiments. (B) THP1-Dual reporter cells were treated with various doses of recombinant IFN-α (rIFN-α2b), ranging from 10 to 1,000 IU/ml. Left panel: luciferase activity was quantified with a luminometer, and RLA is represented as fold induction over untreated reporter cells. Right panels: the expression of ISG15 and SIGLEC1 was analyzed by flow cytometry with intracellular staining. Graphs show MFI as fold induction over basal levels in THP1 cells. The dashed lines represent the mean type I IFN activity levels for supernatants from the TLR7-stimulated leukocytes of HD (black) (controls, n = 12) and chilblain patients (red) (PC, n = 12). (C) PBMCs from chilblain patients (PC, n = 15) or HD (controls, n = 16) were stimulated with viral nucleic acid surrogates for 24 h. Secreted IFN-β levels were evaluated in a LEGENDplex assay after stimulation with liposome-encapsulated poly(I:C), cGAMP (STING agonist) or poly(dA:dT) (cytosolic DNA sensors), or naked CpG-A (TLR9 agonist). Freshly isolated PBMCs were used in these experiments. (D) PBMCs from PC patients or controls were stimulated for 24 h with SARS-CoV-2 (n = 8) or IAV (n = 12). Secreted IFN-β levels were evaluated in a LEGENDplex assay. Cryopreserved PBMCs were used in these experiments. (E) PBMCs from PC patients (PC, n = 12) or HD (controls, n = 12) were stimulated for 24 h with HSV-1. Secreted IFN-α and IFN-β levels were evaluated in a LEGENDplex assay. (F) Distribution of lymphoid and myeloid subsets among PBMCs from PC patients (PC, n = 12) and HD (controls, n = 14) was determined by flow cytometry. Data are represented as percentages of total CD45+ cells. CM, central memory T cells; EM, effector memory T cells; EMRA, CD45RA+ effector memory T cells; NK, natural killer cells; cDC CD1c+, CD1c+ conventional dendritic cells; cDC CD1c, CD1c conventional dendritic cells. (G) Frequency of CD123+BDCA2+ pDCs in PBMCs from PC patients (n = 12) and controls (n = 14), as analyzed in F, is shown on a separate graph. Bars represent the mean ± SD. The adjusted P values in A, C–E, and G were determined in Mann–Whitney tests with the Bonferroni correction for multiple testing. *P < 0.05; ns = nonsignificant. IMQ, imiquimod; RLA, relative luciferase activity; MFI, mean fluorescence intensity; IAV, influenza A virus.
Figure 4.
Figure 4.
Enhanced TLR7-mediated I-IFN production by pDCs in chilblain patients. (A) Intracellular levels of IFN-α (upper panel), TNF (middle panel), and IL-6 (lower panel) in leukocyte subsets were evaluated by flow cytometry after the stimulation of PBMCs for 5 h with the TLR7-selective agonist CL087 and the dual TLR7/8 agonist R848 in the presence of brefeldin A. The subsets studied were as follows: CD14+ monocytes (orange), CD123+BDCA2+ pDCs (red), CD1c+ conventional dendritic cells (DC CD1c+) (purple), CD1c conventional dendritic cells (DC CD1c) (light purple), CD19+ B cells (blue), CD3+ T cells (green). Representative FACS plots from a single patient are shown. The gating strategy is shown in Fig. S3 A. (B) Intracellular levels of IFN-α (upper panel), TNF (middle panel), and IL-6 (lower panel) in leukocyte subsets were evaluated by flow cytometry following the stimulation of PBMCs from PC patients (PC, n = 12) or HD (controls, n = 12), as described in panel A. Graphs represent the percentage of cytokine-positive cells. (C) pDCs are the primary source of IFN-α produced in response to stimulation with TLR7 agonists. The upper panel shows the expression of IFN-α by total CD45+ PBMCs stimulated with CL087 and R848. The middle panel shows the expression of pDC markers, CD123 and BDCA2, by IFN-α–producing cells. The lower graph shows the percentage of CD123+BDCA2+ pDCs among IFN-α–producing cells from the PBMCs of PC patients (n = 12) stimulated with CL087 and R848. (D and E) Intracellular levels of TLR7 (left panel), TLR8 (middle panel), and TLR9 (right panel) in leukocyte subsets were evaluated by flow cytometry on PBMCs. The histograms in D show representative data from a single patient. The graphs in E represent the MFI in PBMCs from female PC patients (PC, n = 8) or healthy female donors (controls, n = 11). Cryopreserved PBMCs were used in A–E. The adjusted P values in B and E were obtained in Mann–Whitney tests with the Bonferroni correction for multiple testing for non-normally distributed datasets, or in Student’s t tests with the Bonferroni correction for multiple testing for normally distributed datasets. Normality was assessed with Shapiro–Wilk and Kolmogorov–Smirnov tests. **P < 0.01; *P < 0.05; ns = nonsignificant; MFI, mean fluorescence intensity.
Figure S3.
Figure S3.
Related to Fig. 4 . (A) Flow cytometry gating strategy for CD14+ monocytes (orange), CD123+BDCA2+ pDCs (red), CD1c+ conventional dendritic cells (DC CD1c+) (purple), CD1c conventional dendritic cells (DC CD1c) (light purple), CD19+ B cells (blue), and CD3+ T cells (green). Related to Fig. 4, A, B, D, and E. (B) Intracellular levels of IFN-α in CD123+BDCA2+ pDCs were evaluated by flow cytometry after stimulating PBMCs from PC patients (PC, n = 12) or HD (controls, n = 12) for 5 h with the TLR7-selective agonist CL087 and the dual TLR7/8 agonist R848 in the presence of brefeldin A, as described in Fig. 4 B. The graphs represent the gMFI. (C) Intracellular levels of TLR7 in CD123+BDCA2+ pDCs were evaluated by flow cytometry in PBMCs from female PC patients (PC, n = 8) or healthy female donors (controls, n = 11). The graphs represent the geometric mean fluorescence intensity (gMFI). Adjusted P values were determined in Mann–Whitney tests with Bonferroni correction in B (non-normally distributed datasets), or Student’s t tests with the Bonferroni correction for multiple testing in C (normally distributed datasets). Normality was assessed in Shapiro–Wilk and Kolmogorov–Smirnov tests. ***P < 0.001; *P < 0.05; ns = nonsignificant.
Figure 5.
Figure 5.
Proposed model for the pathogenesis of PC. We propose a two-step model for the immunopathology of PC (COVID toes). In the first step, the pDCs of predisposed individuals with enhanced TLR7 responsiveness produce large amounts of I-IFN in response to exposure to SARS-CoV-2 at the respiratory mucosal site of infection. This may lead to prompt viral clearance, with no adaptive immune markers of infection detectable in most cases (sterilizing innate immunity). In the second step, these patients develop chilblains due to the infiltration of activated pDCs into the skin of the toes, resulting in I-IFN–mediated inflammation. The preferential influx of activated pDCs into acral skin may be linked to the activation of endothelial cells by cold stress resulting from acral coldness or exposure to cold temperatures. Seasonal (or idiopathic) chilblains, which affect otherwise healthy individuals during the winter, may be induced by similar phenomena triggered by winter-specific ssRNA viruses, such as seasonal coronaviruses, respiratory syncytial virus, and influenza A. The figure was generated in BioRender.

Similar articles

Cited by

References

    1. Adams, N.M., Das A., Yun T.J., and Reizis B.. 2024. Ontogeny and function of plasmacytoid dendritic cells. Annu. Rev. Immunol. 42:347–373. 10.1146/annurev-immunol-090122-041105 - DOI - PubMed
    1. Albarrán-Juárez, J., Iring A., Wang S., Joseph S., Grimm M., Strilic B., Wettschureck N., Althoff T.F., and Offermanns S.. 2018. Piezo1 and Gq/G11 promote endothelial inflammation depending on flow pattern and integrin activation. J. Exp. Med. 215:2655–2672. 10.1084/jem.20180483 - DOI - PMC - PubMed
    1. Arkin, L.M., Costa-da-Silva A.C., Frere J., Ng A., Sharma R., Moon J.J., Bussan H.E., Kim C.H., Javaid A., Steidl O.R., et al. 2024. Pandemic-associated pernio harbors footprints of an abortive SARS-CoV-2 infection. iScience. 27:110525. 10.1016/j.isci.2024.110525 - DOI - PMC - PubMed
    1. Arkin, L.M., Moon J.J., Tran J.M., Asgari S., O’Farrelly C., Casanova J.L., Cowen E.W., Mays J.W., Singh A.M., Drolet B.A., et al. 2021. From your nose to your toes: A review of severe acute respiratory syndrome coronavirus 2 pandemic‒associated pernio. J. Invest. Dermatol. 141:2791–2796. 10.1016/j.jid.2021.05.024 - DOI - PMC - PubMed
    1. Arora, J.S., Kesler A., and Min M.S.. 2024. A global retrospective study identifies higher rates of pernio in individuals with connective tissue disease. J. Am. Acad. Dermatol. 92:636–640. 10.1016/j.jaad.2024.11.014 - DOI - PubMed

Grants and funding