. 2025 Feb 25;14(3):260.
doi: 10.3390/antiox14030260.

Natural Antioxidants Reduce Oxidative Stress and the Toxic Effects of RNA-CUG(exp) in an Inducible Glial Myotonic Dystrophy Type 1 Cell Model

Affiliations

Natural Antioxidants Reduce Oxidative Stress and the Toxic Effects of RNA-CUG(exp) in an Inducible Glial Myotonic Dystrophy Type 1 Cell Model

Fernando Morales et al. Antioxidants (Basel). .

Abstract

The toxic gain-of-function of RNA-CUG(exp) in DM1 has been largely studied in skeletal muscle, with little focus on its effects on the central nervous system (CNS). This study aimed to study if oxidative stress is present in DM1, its relationship with the toxic RNA gain-of-function and if natural antioxidants can revert some of the RNA-CUG(exp) toxic effects. Using an inducible glial DM1 model (MIO-M1 cells), we compared OS in expanded vs. unexpanded cells and investigated whether antioxidants can mitigate OS and RNA-CUG(exp) toxicity. OS was measured via superoxide anion and lipid peroxidation assays. RNA foci were identified using FISH, and the mis-splicing of selected exons was analyzed using semi-quantitative RT-PCR. Cells were treated with natural antioxidants, and the effects on OS, foci formation, and mis-splicing were compared between treated and untreated cells. The results showed significantly higher superoxide anion and lipid peroxidation levels in untreated DM1 cells, which decreased after antioxidant treatment (ANOVA, p < 0.001). Foci were present in 51% of the untreated cells but were reduced in a dose-dependent manner following treatment (ANOVA, p < 0.001). Antioxidants also improved the splicing of selected exons (ANOVA, p < 0.001), suggesting OS plays a role in DM1, and antioxidants may offer therapeutic potential.

Keywords: RNA toxic gain-of-function; antioxidants; glial cell model; inducible model; myotonic dystrophy; treatment.


Conflict of interest statement

The authors declare no conflicts of interest.

Figures

Figure 1
Figure 1
OS in a DM1 glial cell model. Plot (A) shows the results of quantifying the levels of superoxide anion (% MitoSox Fluorescence) in MIO-M1 CTG(648) in the presence (+) or absence (−) of DOX. The plot shows that levels of superoxide anion are significantly increased in induced cells compared to uninduced cells. Plot (B) shows the results of quantifying the levels of LP (% NAO Fluorescence) in MIO-M1 CTG(648) in the presence (+) or absence (−) of DOX. The plot shows that levels of LP are significantly increased in induced cells compared to uninduced cells. * = MWU, p < 0.05.
Figure 2
Figure 2
Natural antioxidants reduce OS in a DM1 glial cell model. Plots (AC) show the results of quantifying the superoxide anion (% MitoSox Fluorescence) in MIO-M1 CTG(648) in the presence (+) or absence (−) of DOX and different concentrations of antioxidants (described in the text). As can be seen, levels of superoxide anion are significantly increased due to the CTG repeat expansion (two first columns), which are significantly decreased after treating the cells with polyphenol extracts from Rubus adenotrichos (A), from polyphenol extracts from Bactris guineensis (B), and NAC (C). A dose-dependent effect of the antioxidant is seen for all treatment conditions. Plots (DF) show the results of quantifying lipid peroxidation in the glial cell model under study. As can be seen, levels of LP are significantly increased due to the CTG repeat expansion (two first columns), which are significantly decreased after treating the cells with polyphenol extracts from Rubus adenotrichos (D), from polyphenol extracts from Bactris guineensis (E), and NAC (F). A dose-dependent effect of the antioxidant is seen for antioxidants except from NAC (F). To allow a proper comparison, data were given as a percentage. ANOVA (Tukey), * = p < 0.05, ** = p < 0.001, *** = p < 0.0001.
Figure 3
Figure 3
Foci formation and antioxidant treatment. The panel shows the percentage of cells with foci in the inducible glial DM1 cell model under study and the effect of the antioxidants on foci accumulation. MIO-M1 CTG(648)-induced cells without antioxidant treatment ((A)—top-left panel) show 51% of cells with foci, which is decreased after treating these cells with polyphenol extracts from Rubus adenotrichos ((B)—going down by up to 20%), polyphenol extracts from Bactris guineensis ((C)—going down by up to 18%), and NAC ((D)—going down by up to 28%). MIO-M1 CTG(648) uninduced cells as a negative control of antioxidant treatment (top-right) show 0% of cells with foci. A dose-dependent effect of the antioxidant is seen in each treatment condition ((BD)—a decrease in the % of cells with foci from left to right). Arrows indicate the presence of cells with foci (nuclei stained with DAPI).
Figure 4
Figure 4
Relationship between foci formation and antioxidant treatment. The three plots show a negative relationship between the percentage of cells with foci and the concentration of the antioxidant used, (A)—polyphenol extracts from Rubus adenotrichos; (B)—polyphenol extracts from Bactris guineensis; and (C)—NAC, indicating a dose-dependent effect of the antioxidant (decrease in the % of cells with foci as the concentration of the antioxidant increases). Analyses (ANOVA-Tukey) indicate a significant difference in the % of cells with foci in the treated conditions compared to untreated cells, especially with the two highest antioxidant concentrations.
Figure 5
Figure 5
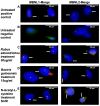
MBNL1/2 colocalization and antioxidant treatment. These panels correspond to a magnification of panels shown in Figure S3. The panels show MBNL1 (left panels) and MBNL2 (right panels) foci colocalization in different culture conditions. (A)—MIO-M1 CTG(648)-induced cells without antioxidant treatment. Colocalization is observed for both MBNL1 and MBNL2. (B)—MIO-M1 CTG(648)-uninduced cells without antioxidant treatment. Colocalization is not observed for both MBNL1 and MBNL2. (C)—MIO-M1 CTG(648)-induced cells treated with the highest concentration of polyphenol extracts from Rubus adenotrichos. Clearer colocalization is observed for MBNL1 but not for MBNL2. (D)—MIO-M1 CTG(648)-induced cells treated with the highest concentration of polyphenol extracts from Bactris guineensis. Clearer colocalization is observed for MBNL1 but not for MBNL2. (E)—MIO-M1 CTG(648)-induced cells treated with the highest concentration of NAC. Clearer colocalization is observed for MBNL1 but not for MBNL2. Arrows show some of the signals corresponding to colocalization or the absence of colocalization.
Figure 6
Figure 6
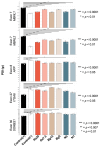
DM1 splicing rescued by antioxidant treatment. The figure shows the PSI of five different alternative exons (labeled on the left-hand side of each plot) analyzed by different culture conditions (columns labeled at the bottom of the figure). When compared to the uninduced MIO-M1 CTG(648) cells (second column–control (−)), we observed in the induced MIO-M1 CTG(648) cells (first column–control (+)) a significantly increased exon inclusion for exons in MBNL1/2 genes; while for the other three exons analyzed, we observed, in the positive control, a significantly increased exon exclusion. After treating the cells with polyphenol extracts from Rubus adenotrichos (columns Ra30 and Ra7.5), polyphenol extracts from Bactris guineensis (columns Bg15 and Bg5), and NAC (columns N5 and N1) we observed a significant rescue in the PSI for most of the exons in most of the conditions and observed a dose-dependent effect (only the highest and lowest concentration of the antioxidant were tested). Statistical analysis was carried out using ANOVA (Tukey); p-values are on the right-hand side of each plot.

Similar articles

References

    1. Harper P.S. Myotonic Dystrophy. 2nd ed. W B Saunders Company; Philadelphia, PA, USA: 1989.
    1. Buxton J., Shelbourne P., Davies J., Jones C., Van Tongeren T., Aslanidis C., de Jong P., Jansen G., Anvret M., Riley B., et al. Detection of an Unstable Fragment of DNA Specific to Individuals With Myotonic Dystrophy. Nature. 1992;355:547–548. doi: 10.1038/355547a0. - DOI - PubMed
    1. Fu Y.H., Pizzuti A., Fenwick R.G., King J., Rajnarayan S., Dunne P.W., Dubel J., Nasser G.A., Ashizawa T., de Jong P., et al. An unstable triplet repeat in a gene related to myotonic muscular dystrophy. Science. 1992;255:1256–1258. doi: 10.1126/science.1546326. - DOI - PubMed
    1. Mahadevan M., Tsilfidis C., Sabourin L., Shutler G., Amemiya C., Jansen G., Neville C., Narang M., Barcelo J., O’hoy K., et al. Myotonic dystrophy mutation: An unstable CTG repeat in the 3′ untranslated region of the gene. Science. 1992;255:1253–1255. doi: 10.1126/science.1546325. - DOI - PubMed
    1. Meola G., Cardani R. Myotonic dystrophies: An update on clinical aspects, genetic, pathology, and molecular pathomechanisms. Biochim. Biophys. Acta (BBA)-Mol. Basis Dis. 2014;1852:594–606. doi: 10.1016/j.bbadis.2014.05.019. - DOI - PubMed

LinkOut - more resources