. 2025 Apr 14;116(1):61.
doi: 10.1007/s00223-025-01369-7.

Roles of Insulin-Like Growth Factor-1 in Muscle Wasting and Osteopenia in Mice with Hyponatremia

Affiliations

Roles of Insulin-Like Growth Factor-1 in Muscle Wasting and Osteopenia in Mice with Hyponatremia

Naoyuki Kawao et al. Calcif Tissue Int. .

Abstract

Hyponatremia is associated with sarcopenia and osteoporosis in elderly individuals. Skeletal muscle releases myokines, which affect distant organs, including bone. However, the detailed mechanisms by which hyponatremia influences muscle and bone remain unclear. We herein investigated the effects of hyponatremia on muscle, bone, and myokines linking muscle to bone in mice treated with 1-desamino-8-D-arginine vasopressin (dDAVP) or furosemide, which induce hyponatremia. Muscle mass and bone mineral density (BMD) were analyzed 8 weeks after the administration of dDAVP or furosemide. dDAVP significantly reduced grip strength, but did not affect tissue weights of gastrocnemius or soleus muscles of mice. Furosemide significantly decreased muscle mass, tissue weights of gastrocnemius and soleus muscles, and grip strength in mice. dDAVP and furosemide decreased trabecular BMD, trabecular bone volume, and cortical BMD at the femurs. Among myokines linking muscle to bone, hyponatremia reduced expression of insulin-like growth factor (IGF)-1 in gastrocnemius and soleus muscles and serum IGF-1 levels in mice. In simple regression analyses, serum IGF-1 levels were positively related to muscle IGF-1 expression, trabecular bone volume, and cortical BMD in mice. The administration of sodium chloride solution to mice ameliorated the decreases in grip strength, muscle mass, trabecular bone volume, cortical BMD, and the levels of muscle and circulating IGF-1 in furosemide-treated mice. The present study demonstrated that hyponatremia induces muscle and bone loss as well as a decrease in muscle IGF-1 expression in mice. The present findings suggest that IGF-1 might be related to muscle wasting and bone loss induced by hyponatremia in mice.

Keywords: Bone loss; Hyponatremia; IGF-1; Muscle wasting.


Conflict of interest statement

Declarations. Competing interests: The authors Naoyuki Kawao, AkihitoNishikawa, Daichi Matsumura, AyakaYamada, Takashi Ohira, Yuya Mizukami and Hiroshi Kaji declare that they have no conflict of interest. Ethical Approval: Animal experiments were performed in accordance with the guidelines of ARRIVE and the institutional rules for the use and care of laboratory animals at Kindai University. All experimental procedures on animals were approved by the Experimental Animal Welfare Committee of Kindai University (Permit number: KAME-2022-079). Research Involving Human and Animal Participants and Informed Consent: All applicable international, national, and/or institutional guidelines for the care and use of animals were followed. All procedures performed in studies involving animals were in accordance with the ethical standards of the institution or practice at which the studies were conducted. This study does not contain any studies with human participants performed by any of the authors.

Figures
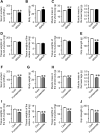
Fig. 1
Fig. 1
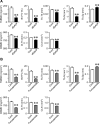
Effects of hyponatremia on muscle. A, F Serum samples were collected from mice 8 weeks after the first injection of dDAVP (A) or furosemide (F). Serum sodium levels were analyzed. B, G Data on body weight in control and hyponatremic mice. Body weight was measured 8 weeks after the first injection of dDAVP (B) or furosemide (G). C, H Muscle mass in the whole body and lower limbs were assessed by QCT 8 weeks after the first injection of dDAVP (C) or furosemide (H). D, I The gastrocnemius (GA), soleus, and tibial anterior (TA) muscles of mice were weighed 8 weeks after the first injection of dDAVP (D) or furosemide (I). E, J The grip strength of the four limbs was measured using a grip strength meter 8 weeks after the first injection of dDAVP (E) or furosemide (J). Data represent the mean ± SEM (n = 8 mice in dDAVP and its control groups, n = 5 mice in furosemide and 6 mice in its control groups). **P < 0.01 and *P < 0.05
Fig. 2
Fig. 2
Effects of hyponatremia on bone. A, B Trabecular BMD (TbBMD), trabecular bone volume fraction (BV/TV), trabecular thickness (Tb.Th), trabecular number (Tb.N), trabecular separation (Tb.Sp), cortical BMD (CtBMD), cortical thickness (Ct.Th), and cortical area (Ct.Ar) at the femurs of mice were assessed by µCT 8 weeks after the first injection of dDAVP (A) or furosemide (B). Data represent the mean ± SEM (n = 8 mice in dDAVP and its control groups, n = 5 mice in furosemide and 6 mice in its control groups). **P < 0.01 and *P < 0.05
Fig. 3
Fig. 3
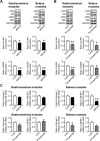
Effects of hyponatremia on protein synthesis signaling and degradation-related gene expression. A, B Total proteins were extracted from the gastrocnemius and soleus muscles of mice 8 weeks after the first injection of dDAVP (A) or furosemide (B). Western blot analyses of phosphorylated Akt (pAkt), Akt, phosphorylated p70 S6 kinase (pS6K), S6K, and GAPDH were performed. Images represent experiments performed independently at least three times. Protein levels of IGF-1 were quantified by densitometry and adjusted by GAPDH levels. Data represent the mean ± SEM (n = 5 in each group). C Total RNA was extracted from the gastrocnemius and soleus muscles of mice 8 weeks after the first injection of dDAVP or furosemide. A real-time PCR analysis of atrogin-1, MuRF1, and 18S rRNA was performed. Data represent the mean ± SEM (n = 8 mice in dDAVP and its control groups, n = 5 mice in furosemide and 6 mice in its control groups). **P < 0.01 and *P < 0.05
Fig. 4
Fig. 4
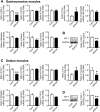
Effects of dDAVP-induced hyponatremia on the expression of myokines. A, C Total RNA was extracted from the gastrocnemius (A) and soleus (C) muscles of mice 8 weeks after the first injection of dDAVP. A real-time PCR analysis of IGF-1, FGF2, Fndc5, IL-6, myostatin, follistatin, activin, TGF-β, and 18S rRNA was performed. Data represent the mean ± SEM (n = 8 mice in each group). **P < 0.01 and *P < 0.05. B, D Total proteins were extracted from the gastrocnemius (B) and soleus (D) muscles of mice 8 weeks after the first injection of dDAVP. Western blot analyses of IGF-1 and GAPDH were performed. Images represent experiments performed independently at least three times. Protein levels of IGF-1 were quantified by densitometry and adjusted by GAPDH levels. Data represent the mean ± SEM (n = 5 in each group). **P < 0.01 and *P < 0.05
Fig. 5
Fig. 5
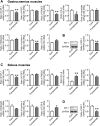
Effects of furosemide-induced hyponatremia on the expression of myokines. A, C Total RNA was extracted from the gastrocnemius (A) and soleus (C) muscles of mice 8 weeks after the first injection of furosemide. A real-time PCR analysis of IGF-1, FGF2, Fndc5, IL-6, myostatin, follistatin, activin, TGF-β, and 18S rRNA was performed. Data represent the mean ± SEM (n = 6 mice in control and 5 mice in furosemide groups). **P < 0.01 and *P < 0.05. B, D Total proteins were extracted from the gastrocnemius (B) and soleus (D) muscles of mice 8 weeks after the first injection of furosemide. Western blot analyses of IGF-1 and GAPDH were performed. Images represent experiments performed independently at least four times. Protein levels of IGF-1 were quantified by densitometry and adjusted by GAPDH levels. Data represent the mean ± SEM (n = 4 in each group). **P < 0.01 and *P < 0.05
Fig. 6
Fig. 6
Effects of hyponatremia on the circulating IGF-1 levels and expression of IGF-1 in mouse tissues. A Serum samples were collected from mice 8 weeks after the first injection of dDAVP or furosemide. Serum IGF-1 levels were analyzed. **P < 0.01 and *P < 0.05. B Total RNA was extracted from the gastrocnemius muscles (GA), femurs, liver, visceral white adipose tissue (WAT), and kidneys of mice 8 weeks after the first injection of dDAVP or furosemide. A real-time PCR analysis of IGF-1 and 18S rRNA was performed. Data represent the mean ± SEM (n = 8 mice in dDAVP and its control groups, n = 5 mice in furosemide and 6 mice in its control groups)
Fig. 7
Fig. 7
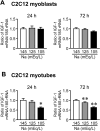
Effects of low sodium concentrations on IGF-1 expression in C2C12 cells. A, B Total RNA was extracted from C2C12 myoblasts (A) and myotubes (B) 24 or 72 h after culture in medium containing indicated concentrations of sodium, and real-time PCR analysis of IGF-1 and 18S rRNA was performed. Data represent the mean ± SEM (n = 5 sample in each group). Cont; Control. **P < 0.01 and *P < 0.05
Fig. 8
Fig. 8
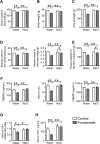
Effects of NaCl administration on muscle and bone in furosemide-induced hyponatremic mice. A Serum samples were collected from mice 8 weeks after the first injection of furosemide with or without NaCl administration. Serum sodium levels were analyzed. B Body weight was measured 8 weeks after the first injection of furosemide with or without NaCl administration. C The grip strength of the four limbs was measured using a grip strength meter in mice 8 weeks after the first injection of furosemide with or without NaCl administration. D Muscle mass in the whole body and lower limbs were assessed by QCT 8 weeks after the first injection of furosemide with or without NaCl administration. E The gastrocnemius (GA) muscles of mice were weighed 8 weeks after the first injection of furosemide with or without NaCl administration. F Trabecular BMD (TbBMD), trabecular bone volume fraction (BV/TV), and cortical BMD (CtBMD) at the femurs of mice were assessed by µCT 8 weeks after the first injection of furosemide. G Total RNA was extracted from the gastrocnemius muscles of mice 8 weeks after the first injection of furosemide with or without NaCl administration. A real-time PCR analysis of IGF-1 and 18S rRNA was performed. Data are expressed relative to the levels of 18S rRNA. H Serum IGF-1 levels were analyzed 8 weeks after the first injection of furosemide with or without NaCl administration. Data represent the mean ± SEM. n = 8 mice in each group. Cont; Control. *P < 0.05 and **P < 0.01

Similar articles

Cited by

References

    1. Verbalis JG, Goldsmith SR, Greenberg A, Korzelius C, Schrier RW, Sterns RH, Thompson CJ (2013) Diagnosis, evaluation, and treatment of hyponatremia: expert panel recommendations. Am J Med 126:S1-42 - PubMed
    1. Verbalis JG, Barsony J, Sugimura Y, Tian Y, Adams DJ, Carter EA, Resnick HE (2010) Hyponatremia-induced osteoporosis. J Bone Miner Res 25:554–563 - PMC - PubMed
    1. Barsony J, Sugimura Y, Verbalis JG (2011) Osteoclast response to low extracellular sodium and the mechanism of hyponatremia-induced bone loss. J Biol Chem 286:10864–10875 - PMC - PubMed
    1. Radvanyi Z, Yoo EJ, Kandasamy P, Salas-Bastos A, Monnerat S, Refardt J, Christ-Crain M, Hayashi H, Kondo Y, Jantsch J, Rubio-Aliaga I, Sommer L, Wagner CA, Hediger MA, Kwon HM, Loffing J, Pathare G (2024) Extracellular sodium regulates fibroblast growth factor 23 (FGF23) formation. J Biol Chem 300:105480 - PMC - PubMed
    1. Hoorn EJ, Rivadeneira F, van Meurs JB, Ziere G, Stricker BH, Hofman A, Pols HA, Zietse R, Uitterlinden AG, Zillikens MC (2011) Mild hyponatremia as a risk factor for fractures: the Rotterdam Study. J Bone Miner Res 26:1822–1828 - PubMed

LinkOut - more resources