. 2025 Mar 7;14(3):322.
doi: 10.3390/antiox14030322.

Procyanidin A1 from Peanut Skin Exerts Anti-Aging Effects and Attenuates Senescence via Antioxidative Stress and Autophagy Induction

Affiliations

Procyanidin A1 from Peanut Skin Exerts Anti-Aging Effects and Attenuates Senescence via Antioxidative Stress and Autophagy Induction

Yajing Li et al. Antioxidants (Basel). .

Abstract

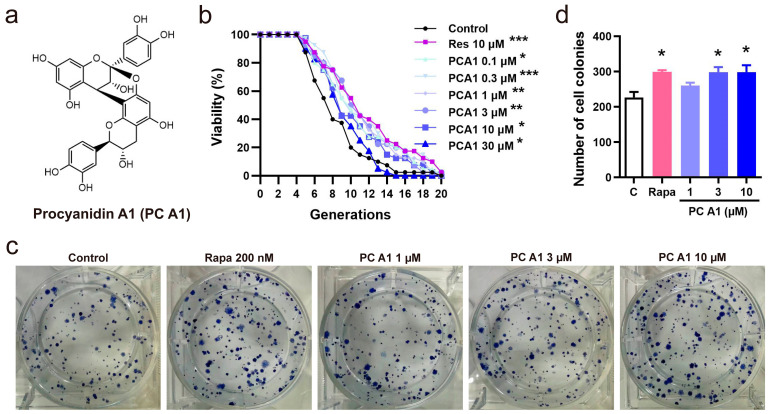
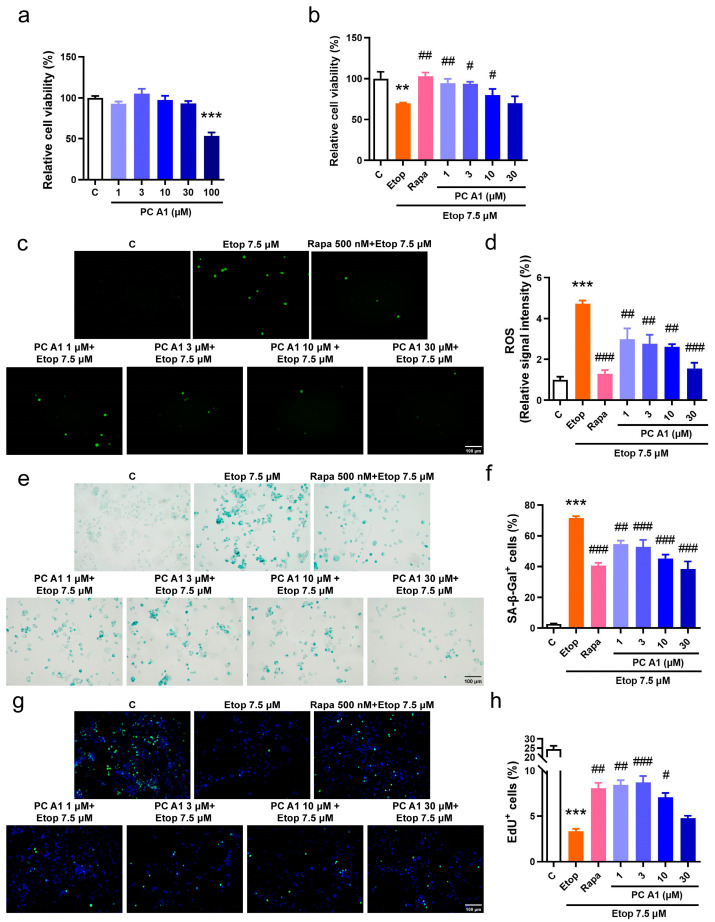
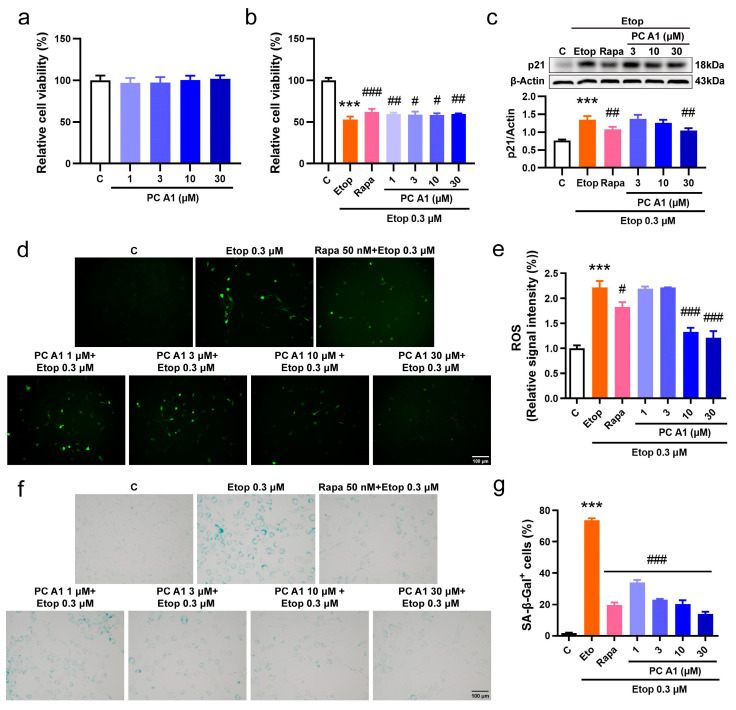
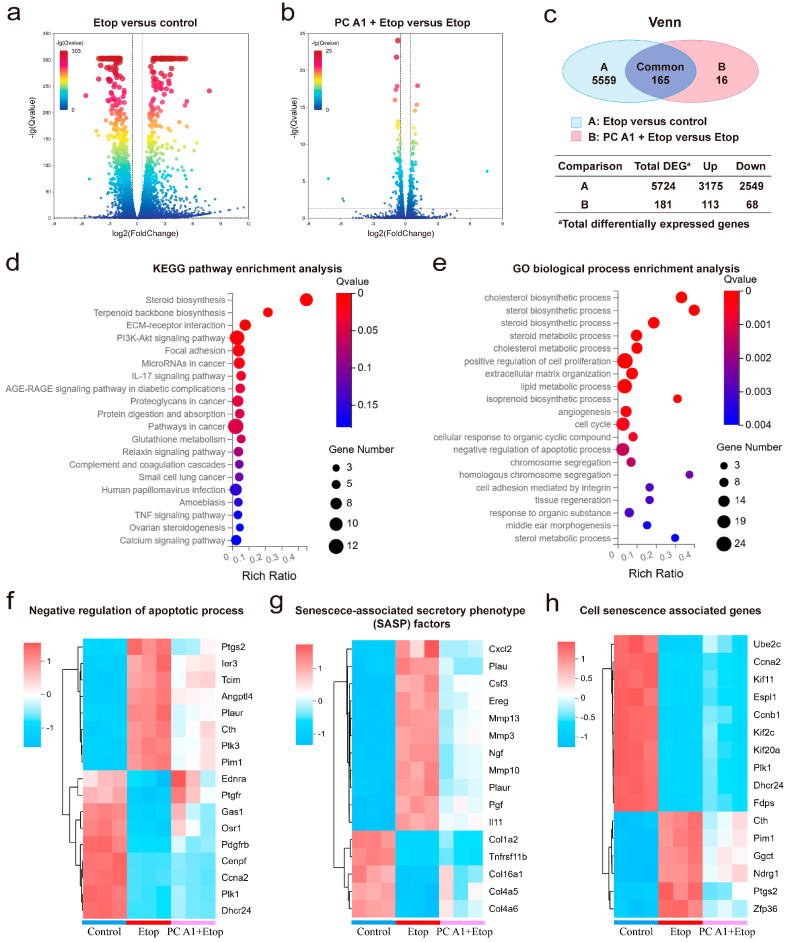
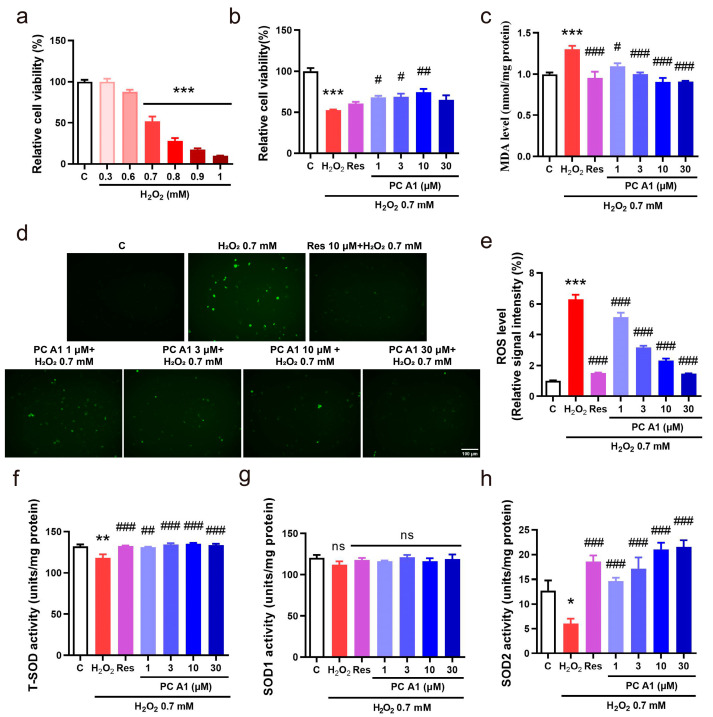
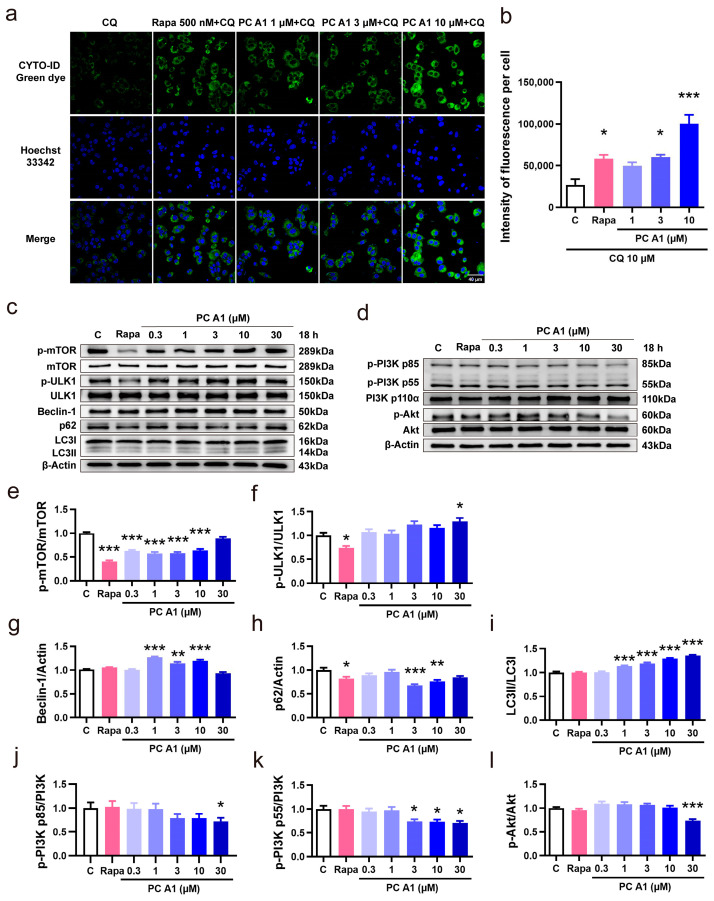
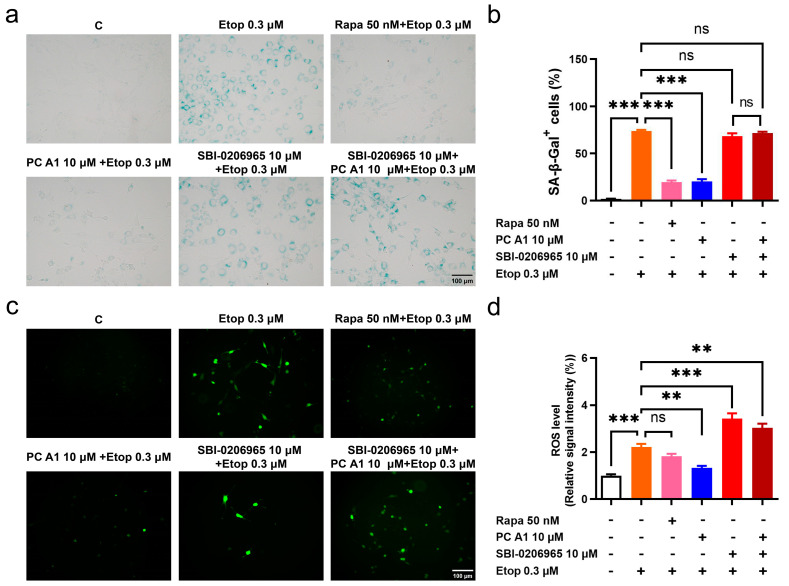
The aging population is steadily increasing, with aging and age-related diseases serving as major risk factors for morbidity, mortality, and economic burden. Peanuts, known as the "longevity nut" in China, have been shown to offer various health benefits, with peanut skin extract (PSE) emerging as a key compound of interest. This study investigates the bioactive compound in PSE with anti-aging potential and explores its underlying mechanisms of action. Procyanidin A1 (PC A1) was isolated from PSE, guided by the K6001 yeast replicative lifespan model. PC A1 prolonged the replicative lifespan of yeast and the yeast-like chronological lifespan of PC12 cells. To further confirm its anti-aging effect, cellular senescence, a hallmark of aging, was assessed. In senescent cells induced by etoposide (Etop), PC A1 alleviated senescence by reducing ROS levels, decreasing the percentage of senescent cells, and restoring proliferative capacity. Transcriptomics analysis revealed that PC A1 induced apoptosis, reduced senescence-associated secretory phenotype (SASP) factors, and modulated the phosphatidylinositol 3-kinase (PI3K)/protein kinase B (Akt) signaling pathway. The antioxidative capacity of PC A1 was also evaluated, showing enhanced resistance to oxidative stress in PC12 cells by reducing reactive oxygen species (ROS) and malondialdehyde (MDA) levels and increasing superoxide dismutase (SOD) activity. Moreover, PC A1 induced autophagy, as evidenced by an increase in fluorescence-labeled autophagic compartments and confirmation via Western blot analysis of autophagy-related proteins. In addition, the treatment of an autophagy inhibitor abolished the antioxidative stress and senescence-alleviating effects of PC A1. These findings reveal that PC A1 extended lifespans and alleviated cellular senescence by enhancing oxidative stress resistance and inducing autophagy, positioning it as a promising candidate for further exploration as a geroprotective agent.

Keywords: PI3K/Akt signaling pathway; aging; antioxidative stress; autophagy; cell senescence; peanut skin; procyanidin A1.


Conflict of interest statement

The authors declare no conflicts of interest. The funders had no role in the design of the study; in the collection, analyses, or interpretation of data; in the writing of the manuscript; or in the decision to publish the results.

Figures

Figure 1
Figure 1
Procyanidin A1 (PC A1) isolated and purified from peanut skin extended the replicative lifespan of K6001 yeast and the yeast-like chronological lifespan of PC12 cells. (a) The chemical structure of PC A1. (b) The effect of PC A1 on the replicative lifespan of K6001 yeast. Resveratrol (Res) at 10 µM was used as the positive control. The experiment was conducted three independent times, with each replicate involving 40 individual mother cells per treatment group. The replicative lifespan was determined by counting the number of daughter cells produced by each mother cell. To assess the significance of the results, a two-sided Student’s t-test was used to compare the number of daughter cells in each treatment group to the control group. (c,d) The colony formation of PC12 cells treated with PC A1 (1, 3, and 10 µM) and rapamycin (Rapa, 200 nM) for testing the yeast-like chronological lifespan of PC12 cells. The representative images of colony-forming units (CFUs) (c) and quantification (d) are shown. Rapamycin (Rapa) was used as the positive control. Experiments were repeated three times. Data represent mean ± SEM. Significant difference was obtained with ordinary one-way ANOVA followed by Dunnett’s multiple comparisons test. *, **, and *** indicate significant differences at p < 0.05, p < 0.01, and p < 0.001 compared with the control (C) group, respectively.
Figure 2
Figure 2
Procyanidin A1 (PC A1) alleviated Etop-induced senescence in PC12 cells. (a) The cell viability of PC12 cells after treatment with PC A1 (1, 3, 10, 30, and 100 µM) for 24 h. (bh) PC12 cells were pre-treated with PC A1 (1, 3, 10, and 30 µM) for 24 h followed by 7.5 µM of etoposide (Etop) for 48 h. The cellular viability was determined (b), and ROS level (c,d), senescence-associated β-galactosidase (SA-β-gal) staining (e,f), and cell proliferation (g,h) are pictured and quantified. Proliferating cells were labeled with green fluorescence, and nuclei were stained with Hoechst 33342. Scale bar: 100 µm. Data represent mean ± SEM, n = 3 for each group. ** and *** indicate significant differences at p < 0.01 and p < 0.001 compared with the control (C) group, respectively; #, ##, and ### indicate significant differences at p < 0.05, p < 0.01, and p < 0.001 compared with the etoposide (Etop) group, respectively.
Figure 3
Figure 3
Procyanidin A1 (PC A1) alleviated Etop-induced senescence in NIH/3T3 cells. (a) The cell viability of NIH/3T3 cells after treatment with PC A1 (1, 3, 10, and 30 µM) for 24 h. (bg) NIH/3T3 cells were pre-treated with PC A1 (1, 3, 10, and 30 µM) for 24 h followed by 0.3 µM of etoposide (Etop) for 48 h. The cellular viability was determined (b), the expression levels of p21 were evaluated (c), and ROS levels (d,e) and senescence-associated β-galactosidase (SA-β-gal) staining (f,g) were pictured and quantified. Scale bar: 100 µm. The experimental samples and controls used for the comparative analysis in (c) were run on the same blot/gel. Data represent mean ±SEM, n = 3. *** indicates significant differences at p < 0.001 compared with the control (C) group; #, ##, and ### indicate significant differences at p < 0.05, p < 0.01, and p < 0.001, compared with the etoposide (Etop) group, respectively.
Figure 4
Figure 4
RNA sequencing analysis on senescent NIH/3T3 cells treated with procyanidin A1 (PC A1). NIH/3T3 cells were pre-treated with PC A1 (10 µM) for 24 h followed by 0.3 µM of etoposide (Etop) for 48 h. RNA was extracted from cells lysis for RNA sequencing analysis. (a) Volcano plot of gene expression in the Etop group compared to the control group. (b) Volcano plot of gene expression in the PC A1 + Etop group compared to the Etop group. In the volcano plot, the two vertical dashed lines indicate log2(FoldChange) values of −0.5 and 0.5, while the horizontal dashed line represents a Q-value threshold of 0.05. Genes with log2(FoldChange) ≥ 0.5 or ≤−0.5 and a Q value ≤ 0.05 were identified as differentially expressed. (c) Venn diagram showing the number of differentially expressed genes (DEGs, with log2FoldChange (FC) ≥ 0.5 or ≤−0.5, Q value ≤ 0.05, calculated by raw count value) and overlapped genes between A and B (A. Etop group versus control group; B. PC A1 + Etop group versus Etop group). (d) KEGG pathway enrichment analysis of the overlapped 165 common differentially expressed genes. (e) GO biological processes associated with the 165 common differentially expressed genes. (f) Heatmaps of genes associated with negative regulation of the apoptosis process. (g) Heatmaps of genes associated with senescence associated secretory phenotype (SASP) factors in different groups. (h) Heatmaps of cell senescence-related genes according to the CellAge database. n = 3 for each group. n stands for the number of samples in a group.
Figure 5
Figure 5
Antioxidative stress effect of procyanidin A1 (PC A1). (a) PC12 cell viability change caused by different doses of H2O2. (bh) PC A1 reduced H2O2-induced toxicity and attenuated oxidative stress. PC12 cells were pre-treated with PC A1 (1, 3, 10, and 30 µM) for 24 h followed by 0.7 mM H2O2 for 2 h. Then, the cellular viability (b), MDA level (c), ROS level (d), and its digital result (e) and total SOD (f), SOD1 (g), and SOD2 activities (h) of PC12 cells were assessed. Scale bar: 100 µm. Data represent mean ± SEM, n = 3 for each group. ns, *, **, and *** indicate significant differences at p > 0.05, p < 0.05, p < 0.01, and p < 0.001 compared with the control (C) group, respectively; ns, #, ##, and ### indicate significant differences at p > 0.05, p < 0.05, p < 0.01, and p < 0.001 compared with the H2O2 group, respectively.
Figure 6
Figure 6
Procyanidin A1 (PC A1) induced autophagy in PC12 cells. (a) Staining of the autophagic vesicles with a fluorescent dye in PC12 cells after treatment with rapamycin (Rapa) and PC A1. Scale bar: 40 µm. (b) The fluorescence intensity quantification results of (a). (c) The Western blot results of p-mTOR (Ser2448), mTOR, p-ULK1 (Ser757), ULK1, Beclin-1, p62, and LC3 compared with β-Actin in PC12 cells after treatment with 500 nM of Rapa and different doses of PC A1 for 18 h. (d) The Western blot results of p-PI3K (p85 (Tyr458)/p55 (Tyr199)), PI3K, p-Akt (Ser473), and Akt in PC12 cells after treatment with 500 nM of Rapa and different doses of PC A1 for 18 h. (ei) The digital Western blot results of p-mTOR (Ser2448)/mTOR (e), p-ULK1 (Ser757)/ULK1 (f), Beclin-1 (g), p62 (h), and LC3II/I (i). (jl) The digital Western blot results of p-PI3K p85 (Tyr458)/PI3K (j), p-PI3K p55 (Tyr199)/PI3K (k), and p-Akt (Ser473)/Akt (l). The samples used for the Western blot analysis in (c,d) on different proteins are derived from the same experiment or parallel experiments and the blots are processed in parallel. *, **, and *** represent significant differences compared with the negative control (p < 0.05, p < 0.01, and p < 0.001, respectively). The experiments were repeated three times, and data from each experiment are displayed as mean ± SEM.
Figure 7
Figure 7
The autophagy inhibitor SBI-0206965 abolished antioxidative stress and the cell senescence alleviation effect of procyanidin A1 (PC A1). (ad) NIH-3T3 cells were pre-treated with PC A1 at 10 µM with or without SBI-0206965 for 24 h followed by 0.3 µM of etoposide (Etop) for 48 h. Rapa (50 nM) was used as a positive control. The senescence-associated β-galactosidase (SA-β-gal) staining (a,b) and ROS level (c,d) are pictured and quantified. Scale bar: 100 µm. Data represent mean ± SEM, n = 3 for each group. ns, **, and *** indicate significant differences at p > 0.05, p < 0.01, and p < 0.001 compared with the designated group, respectively.

Similar articles

References

    1. Guo J., Huang X., Dou L., Yan M., Shen T., Tang W., Li J. Aging and aging-related diseases: From molecular mechanisms to interventions and treatments. Signal Transduct. Target. Ther. 2022;7:391. doi: 10.1038/s41392-022-01251-0. - DOI - PMC - PubMed
    1. Shen C.-Y., Jiang J.-G., Yang L., Wang D.-W., Zhu W. Anti-ageing active ingredients from herbs and nutraceuticals used in traditional Chinese medicine: Pharmacological mechanisms and implications for drug discovery. Br. J. Pharmacol. 2017;174:1395–1425. doi: 10.1111/bph.13631. - DOI - PMC - PubMed
    1. Longo V.D., Shadel G.S., Kaeberlein M., Kennedy B. Replicative and Chronological Aging in Saccharomyces cerevisiae. Cell Metab. 2012;16:18–31. doi: 10.1016/j.cmet.2012.06.002. - DOI - PMC - PubMed
    1. Jarolim S., Millen J., Heeren G., Laun P., Goldfarb D.S., Breitenbach M. A novel assay for replicative lifespan in Saccharomyces cerevisiae. FEMS Yeast Res. 2004;5:169–177. doi: 10.1016/j.femsyr.2004.06.015. - DOI - PubMed
    1. Mirisola M.G., Braun R.J., Petranovic D. Approaches to study yeast cell aging and death. FEMS Yeast Res. 2014;14:109–118. doi: 10.1111/1567-1364.12112. - DOI - PubMed

LinkOut - more resources