

Deregulated mRNA and microRNA Expression Patterns in the Prefrontal Cortex of the BTBR Mouse Model of Autism
- PMID: 40227316
- PMCID: PMC12289737
- DOI: 10.1007/s12035-025-04900-x
Deregulated mRNA and microRNA Expression Patterns in the Prefrontal Cortex of the BTBR Mouse Model of Autism
Abstract
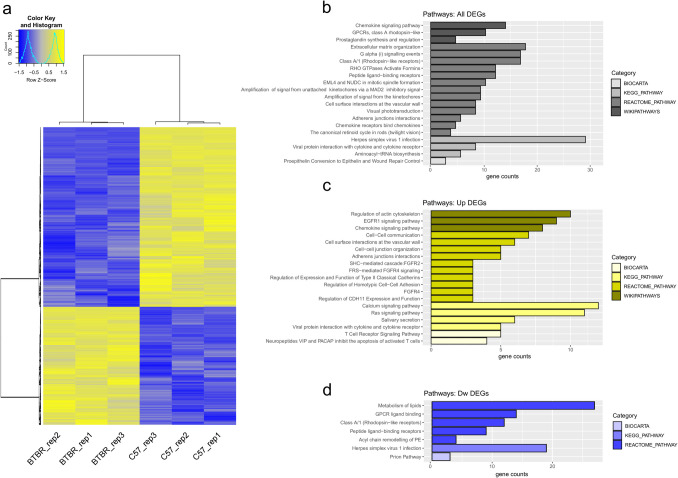
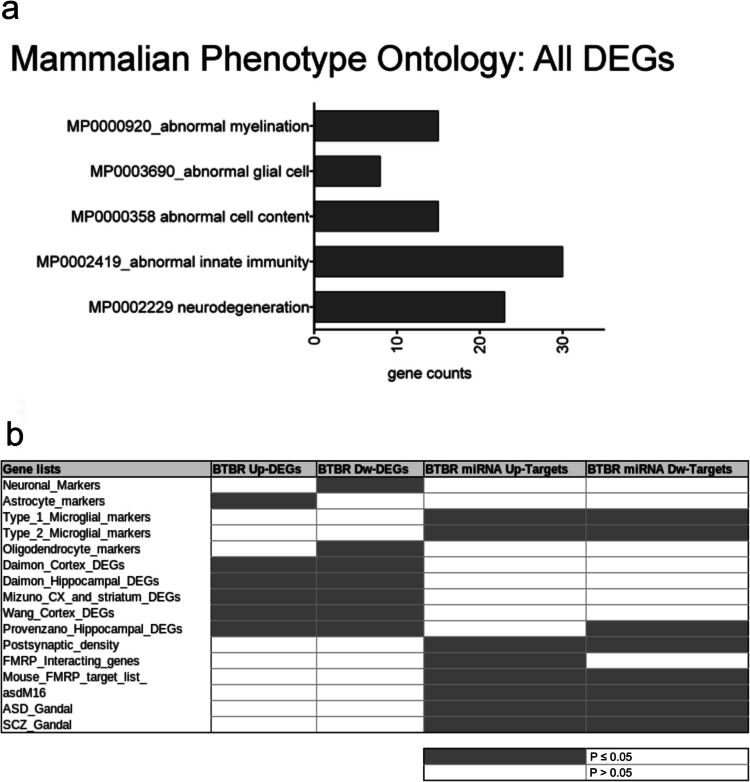
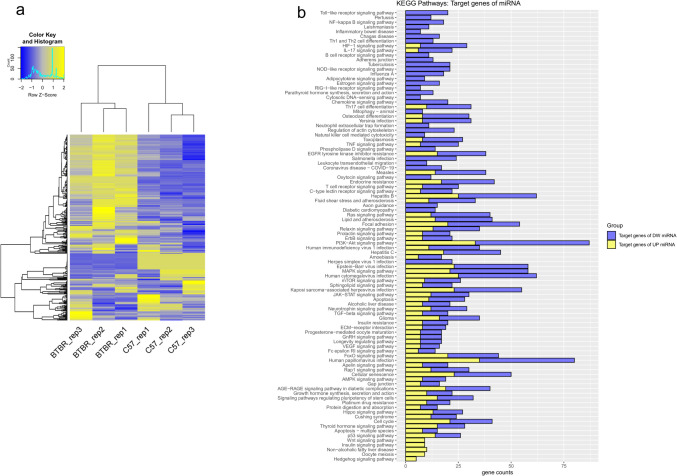
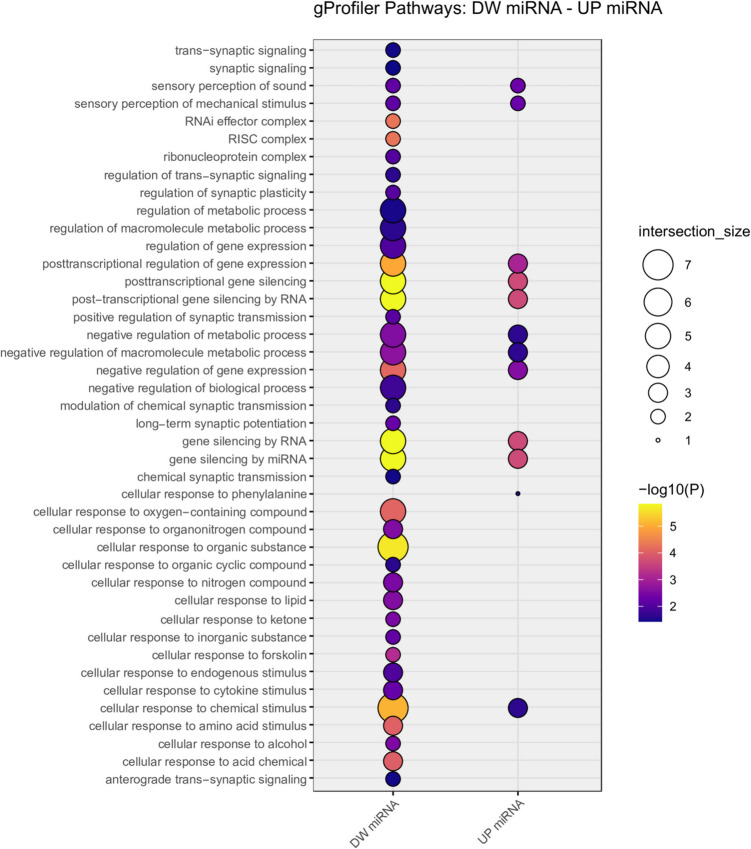
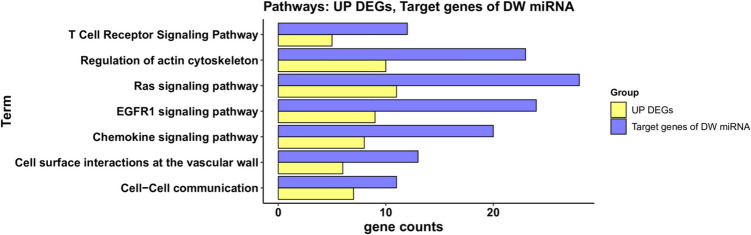
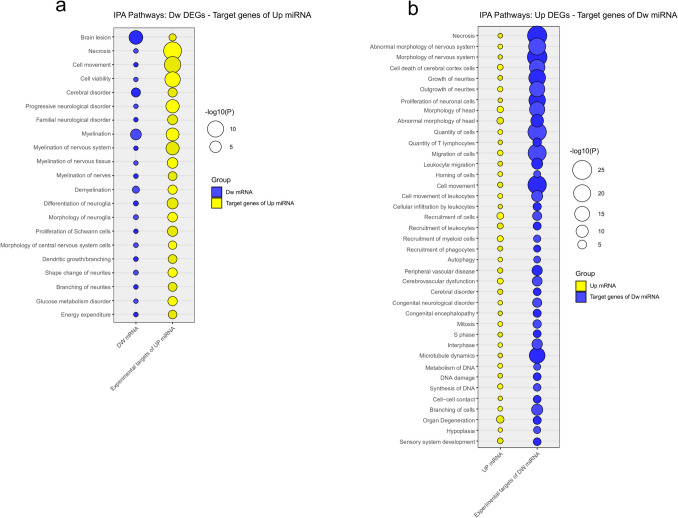
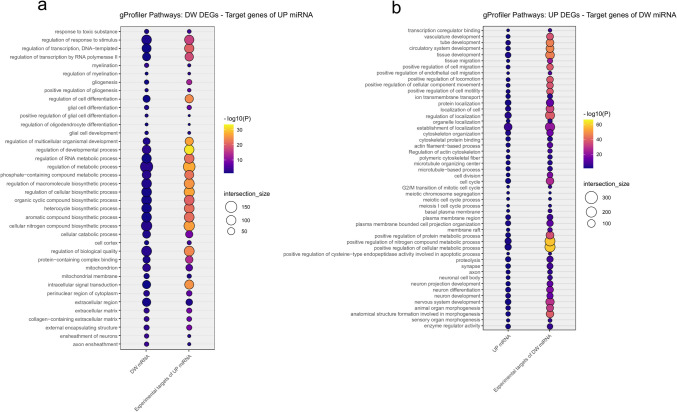
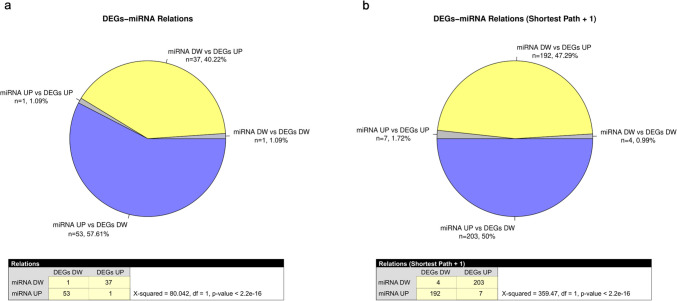
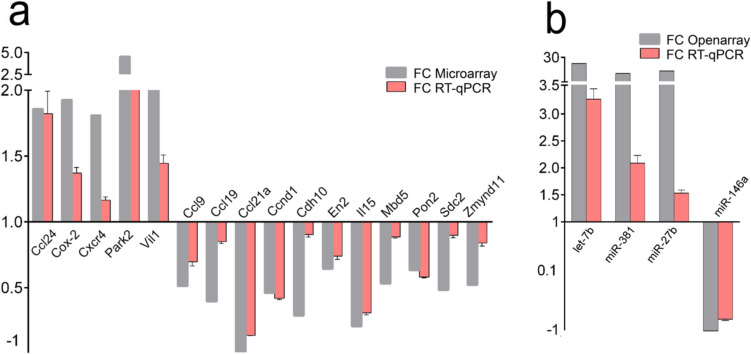
Autism spectrum disorder (ASD) is a neurodevelopmental condition caused by both genetic and environmental factors. Since no single gene variant accounts for more than 1% of the cases, the converging actions of ASD-related genes and other factors, including microRNAs (miRNAs), may contribute to ASD pathogenesis. To date, few studies have simultaneously investigated the mRNA and miRNA profiles in an ASD-relevant model. The BTBR mouse strain displays a range of behaviors with ASD-like features but little is known about the protein-coding and noncoding gene expression landscape that may underlie the ASD-like phenotype. Here we performed parallel mRNA and miRNA profiling using the prefrontal cortex (PFC) of BTBR and C57BL/6 J (B6) mice. This identified 1063 differentially expressed genes and 48 differentially expressed miRNAs. Integration of mRNA and miRNA data identified a strong inverse relationship between upregulated (DEGs) and downregulated miRNAs, and vice versa. Pathway analysis, taking account of the inverse relationship between differentially expressed miRNAs and their target mRNAs highlighted significant shared enrichment in immune signaling, myelination, and neurodevelopmental processes. Notably, miRNA changes were predicted to affect synapse-related functions but we did not find enrichment of protein-coding genes linked to cellular components or biological processes related to synapses in the PFC of BTBR mice, indicating processes may evade miRNA control. In contrast, other miRNAs were predicted to have extensive relationships with DEGs suggesting their role as potential hub coordinators of gene expression. Profiling findings were confirmed via qRT-PCR for representative protein-coding transcripts and miRNAs. Our study underscores the complex interplay between gene expression and miRNA regulation within immune and inflammatory pathways in the BTBR model, offering insights into the neurodevelopmental mechanisms of ASD. These results support the value of the BTBR mouse model and identify strategies that could adjust molecular pathways for therapeutic applications in ASD research.
Keywords: Autism spectrum disorder; Inflammatory pathways; MRNA; MiRNA; Prefrontal cortex.
© 2025. The Author(s).
Conflict of interest statement
Declarations. Competing interests: The authors declare no competing interests.
Figures
Similar articles
-
A MicroRNA Screen Identifies the Wnt Signaling Pathway as a Regulator of the Interferon Response during Flavivirus Infection.J Virol. 2017 Mar 29;91(8):e02388-16. doi: 10.1128/JVI.02388-16. Print 2017 Apr 15. J Virol. 2017. PMID: 28148804 Free PMC article.
-
Deficiency of calretinin in prefrontal cortex causes behavioral deficits relevant to autism spectrum disorder in mice.Mol Brain. 2025 Jul 12;18(1):61. doi: 10.1186/s13041-025-01233-7. Mol Brain. 2025. PMID: 40652246 Free PMC article.
-
Long-term exposure to intranasal oxytocin in a mouse autism model.Transl Psychiatry. 2014 Nov 11;4(11):e480. doi: 10.1038/tp.2014.117. Transl Psychiatry. 2014. PMID: 25386957 Free PMC article.
-
Behavioural and cognitive behavioural therapy for obsessive compulsive disorder (OCD) in individuals with autism spectrum disorder (ASD).Cochrane Database Syst Rev. 2021 Sep 3;9(9):CD013173. doi: 10.1002/14651858.CD013173.pub2. Cochrane Database Syst Rev. 2021. PMID: 34693989 Free PMC article.
-
How lived experiences of illness trajectories, burdens of treatment, and social inequalities shape service user and caregiver participation in health and social care: a theory-informed qualitative evidence synthesis.Health Soc Care Deliv Res. 2025 Jun;13(24):1-120. doi: 10.3310/HGTQ8159. Health Soc Care Deliv Res. 2025. PMID: 40548558
Cited by
-
Therapeutic Horizons: Gut Microbiome, Neuroinflammation, and Epigenetics in Neuropsychiatric Disorders.Cells. 2025 Jul 4;14(13):1027. doi: 10.3390/cells14131027. Cells. 2025. PMID: 40643545 Free PMC article. Review.
-
Autistic Traits in Schizophrenia: Immune Mechanisms and Inflammatory Biomarkers.Int J Mol Sci. 2025 Jul 10;26(14):6619. doi: 10.3390/ijms26146619. Int J Mol Sci. 2025. PMID: 40724876 Free PMC article. Review.
References
-
- Bozzi Y, Provenzano G, Casarosa S (2018) Neurobiological bases of autism-epilepsy comorbidity: a focus on excitation/inhibition imbalance. Eur J Neurosci 47(6):534–548. 10.1111/ejn.13595 - PubMed
MeSH terms
Substances
Grants and funding
- NARSAD Young Investigator Grant, ID: 26617/Brain and Behavior Research Foundation
- Starting Grant for Young Researchers 2019/University of Trento
- 16/RC/3948 and 21/RC/10294_P2, FutureNeuro/SFI_/Science Foundation Ireland/Ireland
- 16/RC/3948 and 21/RC/10294_P2, FutureNeuro/SFI_/Science Foundation Ireland/Ireland
- 16/RC/3948 and 21/RC/10294_P2, FutureNeuro/SFI_/Science Foundation Ireland/Ireland
LinkOut - more resources
Full Text Sources
Miscellaneous
