Clinical Outcomes and Genomic Alterations in Gleason Score 10 Prostate Cancer
- PMID: 40227503
- PMCID: PMC11987802
- DOI: 10.3390/cancers17071055
Clinical Outcomes and Genomic Alterations in Gleason Score 10 Prostate Cancer
Abstract
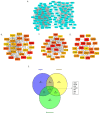
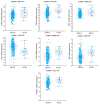
Background: Gleason score (GS) 10 prostate cancer (PC) is a highly aggressive localized disease. Despite advances in treating high-risk PC, the clinical outcomes and molecular underpinnings of GS 10 remain unclear. This study aimed to determine whether GS 10 PC has distinct clinical outcomes from other "high-risk" cancers (i.e., Gleason 8-9) and identify genomic alterations driving its aggressive phenotype. Methods: A retrospective review of The Cancer Genome Atlas database identified patients with GS 8-10 PC who underwent radical prostatectomy. Clinical factors were compared between GS 10 and GS 8-9 cohorts. Time to biochemical recurrence (BCR) was analyzed using Kaplan-Meier and Cox regression. RNA sequencing identified differentially expressed genes, and protein-protein interaction networks identified hub genes. Results: Of 192 patients, 13 (6.8%) had GS 10 PC. After median follow-up of 37.87 months, GS 10 status was associated with significantly lower time to BCR (AHR, 2.67; 95% CI, 1.18-6.02; p = 0.018) compared to GS 8-9. Multiple genes (e.g., RAD54L, FAAH, AATK, MAST2) showed higher alteration frequencies, and high expression of RAD54L, MAST2, and CCHCR1 correlated with shorter disease-free survival. Six overlapping hub genes (CD8A, CDC20, E2F1, IL10, TNF, VCAM1) were overexpressed in GS 10 tumors, reflecting key pathways in tumor progression. Conclusions: GS 10 PC confers inferior time to BCR and displays a distinct genomic landscape compared to GS 8-9 disease, highlighting the need for biomarker-driven therapeutic strategies. Further studies are needed to validate these genomic targets and improve management for this very high-risk population.
Keywords: Gleason score; biomarkers; disease-free survival; gene expression profiling; prostate cancer.
Conflict of interest statement
The authors declare that the research was conducted without any commercial or financial relationships that could be construed as potential conflicts of interest.
Figures


References
-
- Epstein J.I., Egevad L., Amin M.B., Delahunt B., Srigley J.R., Humphrey P.A. The 2014 International Society of Urological Pathology (ISUP) Consensus Conference on Gleason Grading of Prostatic Carcinoma: Definition of Grading Patterns and Proposal for a New Grading System. Am. J. Surg. Pathol. 2016;40:244–252. doi: 10.1097/pas.0000000000000530. - DOI - PubMed
-
- Ham W.S., Chalfin H.J., Feng Z., Trock B.J., Epstein J.I., Cheung C., Humphreys E., Partin A.W., Han M. New Prostate Cancer Grading System Predicts Long-term Survival Following Surgery for Gleason Score 8-10 Prostate Cancer. Eur. Urol. 2017;71:907–912. doi: 10.1016/j.eururo.2016.11.006. - DOI - PubMed
-
- Dayes I.S., Parpia S., Gilbert J., Julian J.A., Davis I.R., Levine M.N., Sathya J. Long-Term Results of a Randomized Trial Comparing Iridium Implant Plus External Beam Radiation Therapy With External Beam Radiation Therapy Alone in Node-Negative Locally Advanced Cancer of the Prostate. Int. J. Radiat. Oncol. Biol. Phys. 2017;99:90–93. doi: 10.1016/j.ijrobp.2017.05.013. - DOI - PubMed
LinkOut - more resources
Full Text Sources
Research Materials
Miscellaneous

