. 2025 Aug;48(4):943-959.
doi: 10.1007/s13402-025-01055-8. Epub 2025 Apr 14.

HBO1 determines epithelial-mesenchymal transition and promotes immunotherapy resistance in ovarian cancer cells

Affiliations

HBO1 determines epithelial-mesenchymal transition and promotes immunotherapy resistance in ovarian cancer cells

Cong Zhang et al. Cell Oncol (Dordr). 2025 Aug.

Abstract

Purpose: Epithelial-mesenchymal transition (EMT) plays critical roles in tumor progress and treatment resistance of ovarian cancer (OC), resulting in the most deadly gynecological cancer in women. However, the cell-intrinsic mechanism underlying EMT in OC remains less illuminated.

Method: SKOV3, the OC cell line, was treated with TGF-β to induce EMT or with SB431542, an inhibitor of the TGF-β signaling pathway, to reduce migration. The function of HBO1 in EMT was confirmed by knock-down or overexpression of HBO1 in SKOV3 cells. The role of HBO1 in cell proliferation and apoptosis of SKOV3 cells was analyzed by flow cytometry. The whole-genome transcriptome was used to compare significantly different genes in control and HBO1-KD SKOV3 cells. T-cell cytotoxicity assays were measured by an IVIS spectrum. The chromatin binding of HBO1 was investigated using CUT&Tag-seq.

Results: Here, we show that HBO1, a MYST histone acetyltransferase (HAT), is a cell-intrinsic determinant for EMT in OC cells. HBO1 is greatly elevated during TGF-β-triggered EMT in SKOV3 OC cells as well as in later stages of clinical OC samples. HBO1 Knock-down (KD) in SKOV3 cells blocks TGF-β-triggered EMT, migration, invasion and tumor formation in vivo. Interestingly, HBO1 KD in SKOV3 cells suppresses their resistance to CAR-T cells. Mechanistically, HBO1 co-binds the gene sets responsible for EMT with SMAD4 and orchestrates a gene regulatory network critical for tumor progression in SKOV3 cells.

Conclusion: HBO1 plays an essential onco-factor to drive EMT and promote the immunotherapy resistance in ovarian cancer cells. Together, we reveal a critical role of HBO1 mediated epigenetic mechanism in OC progression, providing an insight into designing new therapy strategies.

Keywords: Epithelial-mesenchymal transition; HBO1; Oncogene; Ovarian cancer; TGF-β signaling.


Conflict of interest statement

Declarations. Ethical approval consent to publish: All animal experiments were conducted in accordance with an approved protocol by the Institutional Animal Care and Use Committee (IACUC) at the Guangzhou Institutes of Biomedicine and Health, Chinese academy of science. Competing interests: The authors declare no competing interests.

Figures
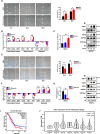
Fig. 1
Fig. 1
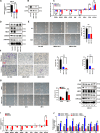
HBO1 expression is positively correlated with EMT progression and later stages of OC samples. (A) The cell morphology was shown from representative images of wound healing in SKOV3 with or without TGF-β1 (scale bars: 200 μm). Specific doses and durations of treatments were indicated. Quantitative analysis of the wound healing assay (n = 3, *p < 0.05). (B and C) Expression of TGFB1, EMT-TF (SNAI2, ZEB1), mesenchymal markers (CDH2, VIM, FN1), epithelial markers (CDH1, CGN, KLK10) and HBO1 were detected in the indicated cells by quantitative reverse transcription PCR (RT-PCR) (n = 3, **p < 0.01). (D) Western blot analysis of the expression of HBO1, epithelial marker (CDH1), mesenchymal marker (CDH2) and H3K14ac in the indicated cell lines. GAPDH and H3 were used as loading controls. (E) The cell morphology was shown from representative images of wound healing in SKOV3 with or without SB431542 (scale bars: 200 μm). Specific doses and durations of treatments were indicated. Quantitative analysis of the wound healing assay (n = 3, **p < 0.01). (F and G) The expression of TGFB1, EMT-associated transcriptional factors (EMT-TF) (SNAI2, ZEB1), mesenchymal markers (CDH2, VIM, FN1), epithelial markers (CDH1, CGN, KLK10) and HBO1 were detected in the indicated cells by RT-PCR (n = 3, **p < 0.01). (H) Western blot analysis of the expression of HBO1, epithelial marker (CDH1), mesenchymal marker (CDH2) and H3K14ac in the indicated cell lines. GAPDH and H3 were used as loading controls. (I) GEPIA analysis of overall survival was based on HBO1 expression (high group vs. low group) in ovarian cancer patients. The dotted lines stand for 95% confidence interval. (J) GEPIA analysis of HBO1 expression for the pathological stages in ovarian cancer patients
Fig. 2
Fig. 2
Knock-down of HBO1 impairs cell migration and invasiveness in SKOV3 cells. (A) HBO1 Expression was detected in the indicated cells by RT-PCR (n = 3, **p < 0.01). (B) HBO1 expression was analyzed in the indicated cells using western blot. GAPDH was used as a loading control. (C) RT-PCR was used to detect the expression of TGFB1, EMT-TF (SNAI2, ZEB1), mesenchymal markers (CDH2, VIM, FN1) and epithelial markers (CDH1, CGN, KLK10) in the indicated cells (n = 3, **p < 0.01). (D) Western blot analysis of the expression of HBO1, epithelial marker (CDH1), mesenchymal marker (CDH2) and H3K14ac in the indicated cells. GAPDH and H3 were used as loading controls. (E) The cell morphology was shown from representative images of wound healing in the indicated cells (scale bars: 200 μm). Quantitative analysis of the wound healing assay (n = 3, *p < 0.05). (F) Transwell migration (top) and invasion (bottom) assays were applied to the indicated cells. Quantitative analysis of the transwell migration (left) and invasion (right) assays (n = 3, **p < 0.01). (G) The cell morphology was displayed in representative images of wound healing in SKOV3 with or without WM3835 (scale bars: 200 μm). Specific doses and durations of treatments were indicated. Quantitative analysis of the wound healing assay (n = 3, **p < 0.01). (H) Western blot analysis of the expression of HBO1, epithelial marker (CDH1), mesenchymal marker (CDH2) and H3K14ac in the indicated cells. GAPDH and H3 were used as loading controls. (I) Expression of TGFB1, EMT-TF (SNAI2, ZEB1), mesenchymal markers (CDH2, VIM, FN1), and epithelial markers (CDH1, CGN, KLK10) were detected in the indicated cells by RT-PCR (n = 3, **p < 0.01). (J) Expression of HBO1, TGFB1, EMT-TF (SNAI2, ZEB1), and mesenchymal markers (CDH2, VIM, FN1) were detected in the indicated cells by RT-PCR (n = 3, *p < 0.05, **p < 0.01)
Fig. 3
Fig. 3
HBO1 is an essential factor for cell proliferation and tumor formation in SKOV3 cells. (A) The EdU incorporation assay was performed in the indicated cells. Quantitative analysis of the EdU incorporation assay in the indicated cells (n = 3, **p < 0.01). (B) The apoptosis assay was performed in the indicated cells. PI – or Annexin V-positive cells were analyzed by FACS. Quantitative analysis of the apoptosis assay in the indicated cells (n = 3, **p < 0.01). (C) The cell proliferation curve was drawn in the indicated cells (n = 3, **p < 0.01). (D) HBO1-KD cells or control SKOV3 cells were s.c. injected into the flanks of SCID mice (day 0). The indicated tumors were separated on day 28 and photographed (n = 3 animals/group). (E) Tumors were separated on day 28, and quantitative analysis of the tumor volume (n = 6, **p < 0.01)
Fig. 4.
Fig. 4.
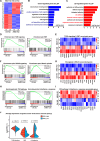
HBO1 maintains oncogene sets in SKOV3 cells. (A) Heatmap analysis of the gene expression showing significant differences between control cells and HBO1-KD cells. The data were from RNA-seq. (B) Gene ontology analysis of biological processes enriched for significantly down-regulated genes in HBO1-KD cells compared with control cells. (C) Gene ontology analysis of biological processes enriched for significantly up-regulated genes in HBO1-KD cells compared with control cells. (D) GSEA analysis of gene sets for the TGF-β signaling pathway and EMT in control cells and HBO1-KD cells. (E) Heatmap analysis of the indicated gene expression for the TGF-β signaling pathway and EMT in control cells and HBO1-KD cells. (F) GSEA analysis of gene sets for the KRAS signaling pathway and mitotic in control cells and HBO1-KD cells. (G) Heatmap analysis of the indicated gene expression for oncogenes and mitotic in control cells and HBO1-KD cells. (H) GSEA analysis of gene sets for the P53 pathway and the interferon γ response in control cells and HBO1-KD cells. (I) Heatmap analysis of the indicated gene expression for the P53 pathway and the interferon γ response in control cells and HBO1-KD cells. (J) Analysis of the highlighted pathways in a varied panel of 1,516 human cancer cell lines (CCLE). Symmetric violin graphs show the stratification of HBO1 high and low cell lines based on median expression levels
Fig. 5
Fig. 5
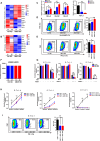
Knock-down of HBO1 reduces immunotherapy resistance in SKOV3 cells. (A) Heatmap analysis of the indicated gene expression for MHC class I and regulators in control and HBO1-KD cells. (B) Heatmap analysis of the indicated gene expression for CD274 (PD–L1) and regulators in control cells and HBO1-KD cells. (C) Expression of HLA-A/B/C and PD–L1 were detected in the indicated cells by RT-PCR (n = 3, *p < 0.05, **p < 0.01). (D) FACS analysis of HLA-A/B/C expression was performed in the indicated cells. Quantitative analysis of the HLA-A/B/C positive rate in the indicated cells (n = 3, **p < 0.01). (E) FACS analysis of PD–L1 expression was performed in the indicated cells. Quantitative analysis of the PD–L1 positive rate in the indicated cells (n = 3, **p < 0.01). (F) Based on the RNA-seq data, analysis of HER2 expression in control and HBO1-KD cells. (G) Cell killing assays were performed in the control SKOV3-OE-Luc cells or HBO1-KD SKOV3-OE-Luc cells co-cultured with WT T cells or HER2 CAR-T cells. The co-cultured rate was indicated. After 48 hours of co-culture, the remaining tumor cells were measured by luciferase assay. The same number of control SKOV3-OE-Luc cells or HBO1-KD SKOV3-OE-Luc cells were cultured alone for 48 hours and detected by luciferase assay as controls. (H) Three continuous rounds of cell killing assays were performed in the control SKOV3-OE-Luc cells or HBO1-KD SKOV3-OE-Luc cells co-cultured with HER2 CAR-T cells. The co-cultured rate was indicated. After 48 hours of co-culture, the supernatant (containing HER2 CAR-T cells) was transferred to the same number of control SKOV3-OE-Luc cells or HBO1-KD SKOV3-OE-Luc cells for 48 hours, repeated twice, and the surviving tumor cells were detected by luciferase assay each time. The same amount of control SKOV3-OE-Luc cells or HBO1-KD SKOV3-OE-Luc cells were cultured alone for 48 hours and detected by luciferase assay as controls. (I) FACS analysis of PD-1 expression was performed in the HER2 CAR-T cells, which were co-cultured with control SKOV3-OE-Luc cells or HBO1-KD SKOV3-OE-Luc cells for three days. The co-cultured rate was indicated. Quantitative analysis of the rate of PD-1 positive HER2 CAR-T cells (n = 3, **p < 0.01)
Fig. 6
Fig. 6
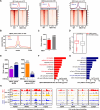
HBO1 co-localizes with SMAD4 on EMT-associated genes in SKOV3 cells. (A) Heatmap and signal densities analysis of HBO1, H3K14ac, and SMAD4 at their peak centers, respectively, in control and HBO1-KD cells. (B) Signal densities analysis of HBO1, H3K14ac, and SMAD4 at HBO1 peak center around ± 3 kb in control cells. (C) Quantitative analysis of the number of HBO1 binding (HBO1+) and no-HBO1 binding (HBO1-) genes in control cells. (D) The box-plot analysis of the transcription levels of HBO1 binding and no-HBO1 binding genes in control cells. The data were from RNA-seq. (E) Left: the number of H3K14ac binding (H3K14ac+) and no-H3K14ac binding (H3K14ac-) genes in HBO1 binding (HBO1+) genes in control cells. Right: the number of SMAD4 binding (SMAD4+) and no-SMAD4 binding (SMAD4-) genes in HBO1+/H3K14ac+ genes in control cells. (F) Gene ontology analysis of biological processes enriched for HBO1/H3K14ac/SMAD4 all-binding genes in control cells. (G) Gene ontology analysis of biological processes enriched for only HBO1 binding genes in control cells. (H) Integrative genomics viewer analysis of HBO1, H3K14ac, and SMAD4 binding on the chromatin of the EMT and the cell cycle phase transition associated genes in the indicated cell lines
Fig. 7
Fig. 7
HBO1 orchestrates a gene regulatory network critical for tumor progression in SKOV3 cells. (A) The figure listed the genes that were bound by HBO1 on its chromatin in control SKOV3 cells and significantly down-regulated (orange) or up-regulated (purple) compared with HBO1-KD cells. Node size, relative to the absolute value of log 2 fold change. (B and C) Gene ontology analysis of biological processes for down- or up-regulated gene groups. The wiring indicated that both genes appear in the same GO term (the frequency > 4), and the line’s color darkens with increasing frequency. Node size, relative to the number of wires

Similar articles

References

    1. L.E. Kandalaft, D. Dangaj Laniti, G. Coukos, Nat. Rev. Cancer 22, 640–656 (2022). 10.1038/s41568-022-00503-z - PubMed
    1. L.A. Torre, B. Trabert, C.E. DeSantis, K.D. Miller, G. Samimi, C.D. Runowicz, M.M. Gaudet, A. Jemal, R.L. Siegel, CA-Cancer J. Clin. 68, 284–296 (2018). 10.3322/caac.21456 - PMC - PubMed
    1. S. Vaughan, J.I. Coward, R.C. Bast Jr, A. Berchuck, J.S. Berek, J.D. Brenton, G. Coukos, C.C. Crum, R. Drapkin, D. Etemadmoghadam, M. Friedlander, H. Gabra, S.B. Kaye, C.J. Lord, E. Lengyel, D.A. Levine, I.A. McNeish, U. Menon, G.B. Mills, K.P. Nephew, A.M. Oza, A.K. Sood, E.A. Stronach, H. Walczak, D.D. Bowtell, F.R. Balkwill, Nat. Rev. Cancer 11, 719–725 (2011). 10.1038/nrc3144 - PMC - PubMed
    1. M. Selvakumaran, D.A. Pisarcik, R. Bao, A.T. Yeung, T.C. Hamilton, Cancer Res. 63, 1311–1316 (2003) - PubMed
    1. B.G. Matthews, N.A. Bowden, M.W. Wong-Brown, Cancers (Basel) 13 (2021). 10.3390/cancers13235993 - PMC - PubMed

MeSH terms

Substances

LinkOut - more resources