. 2025 Apr 5;17(7):1234.
doi: 10.3390/cancers17071234.

Pro-Inflammatory Cytokines Transactivate Glycosylated Cytokine Receptors on Cancer Cells to Induce Epithelial-Mesenchymal Transition to the Metastatic Phenotype

Affiliations

Pro-Inflammatory Cytokines Transactivate Glycosylated Cytokine Receptors on Cancer Cells to Induce Epithelial-Mesenchymal Transition to the Metastatic Phenotype

Leili Baghaie et al. Cancers (Basel). .

Abstract

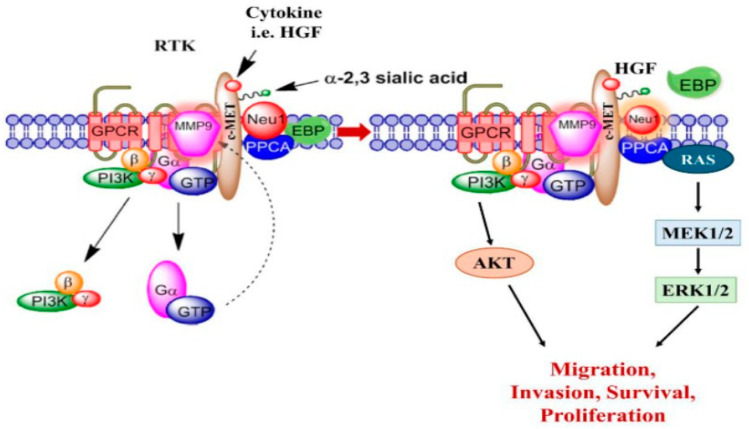
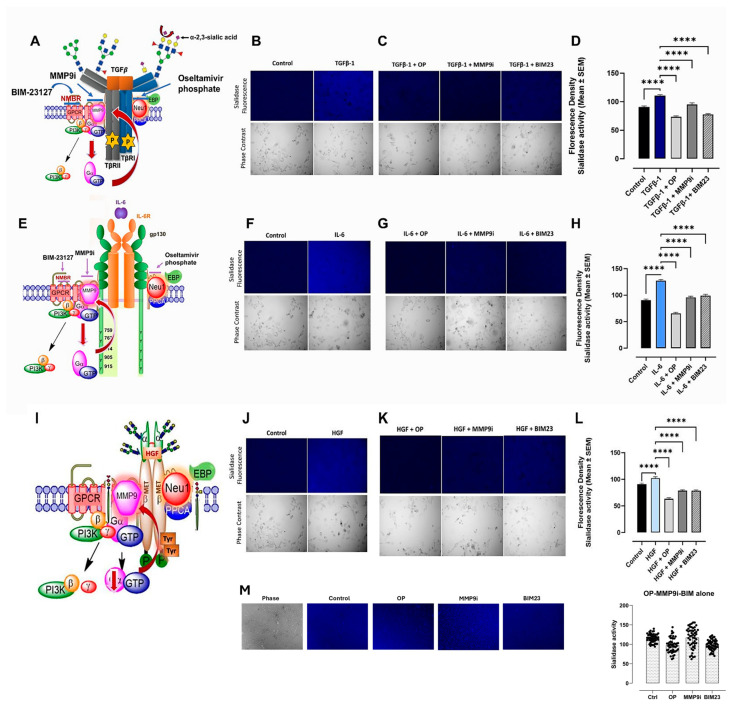
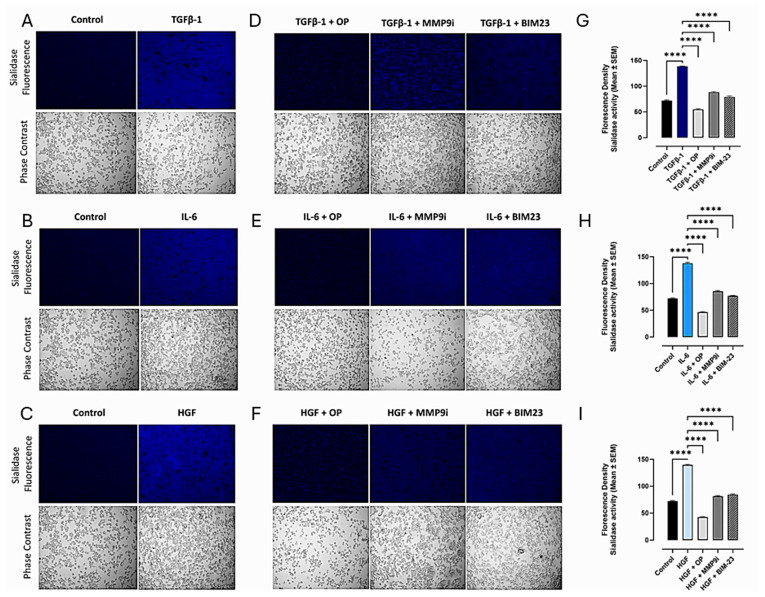
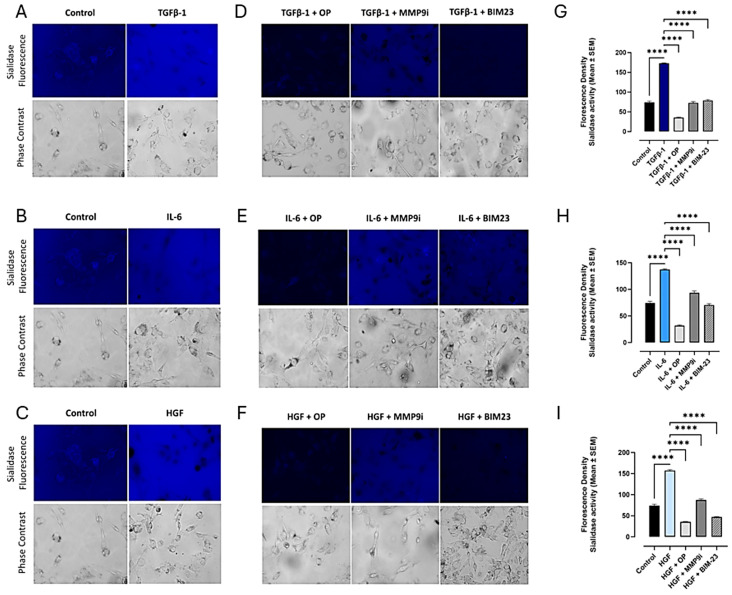
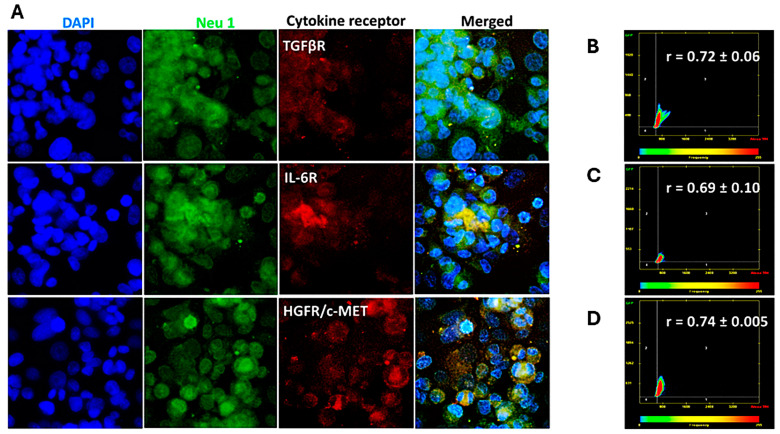
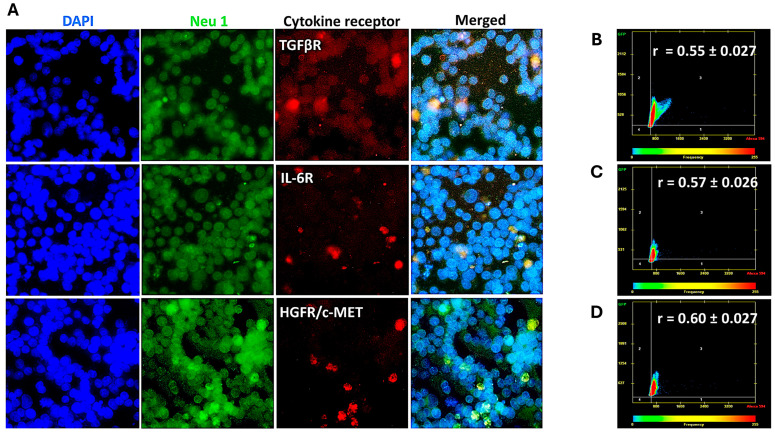
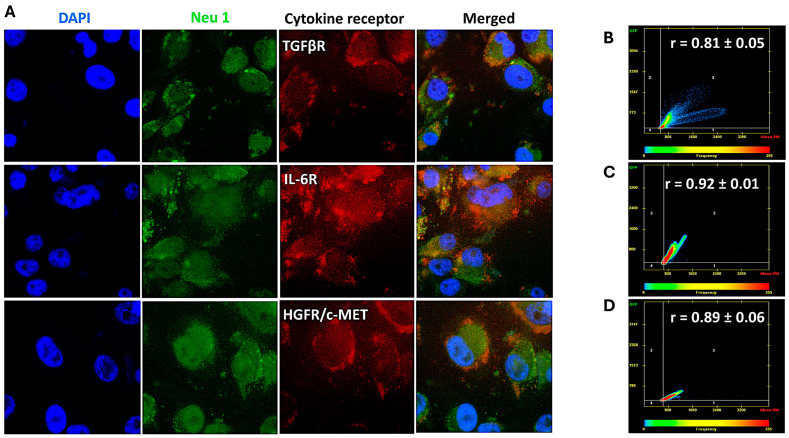
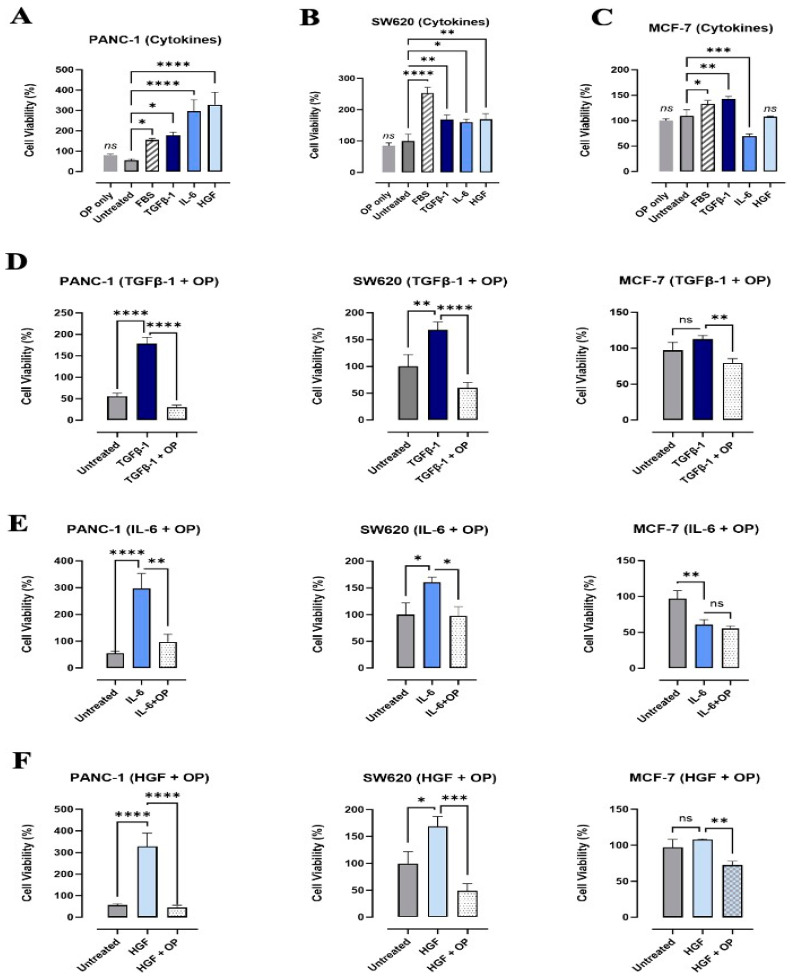
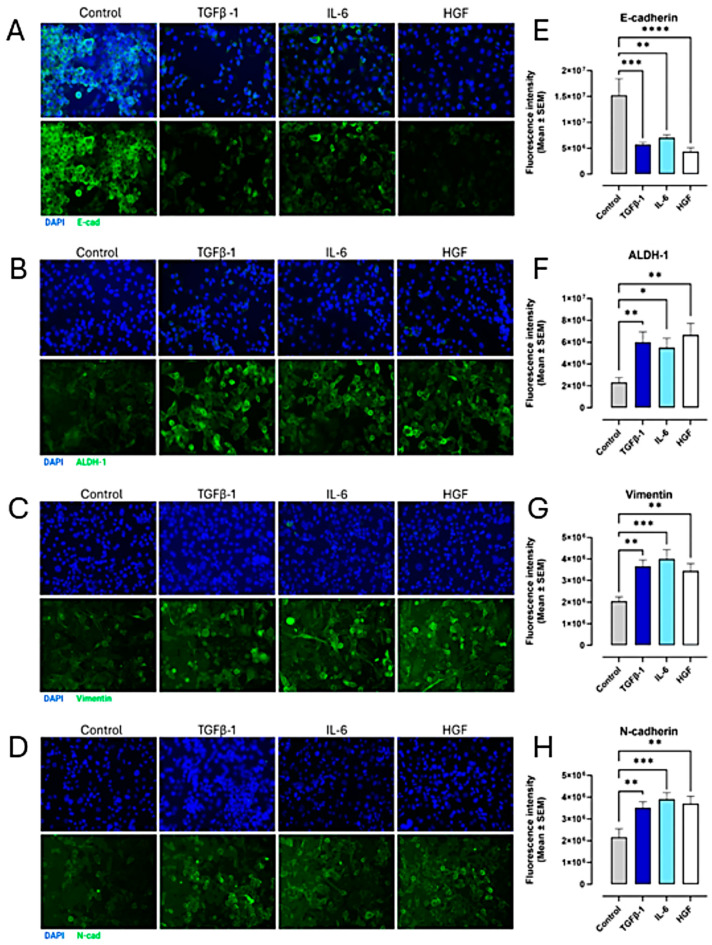
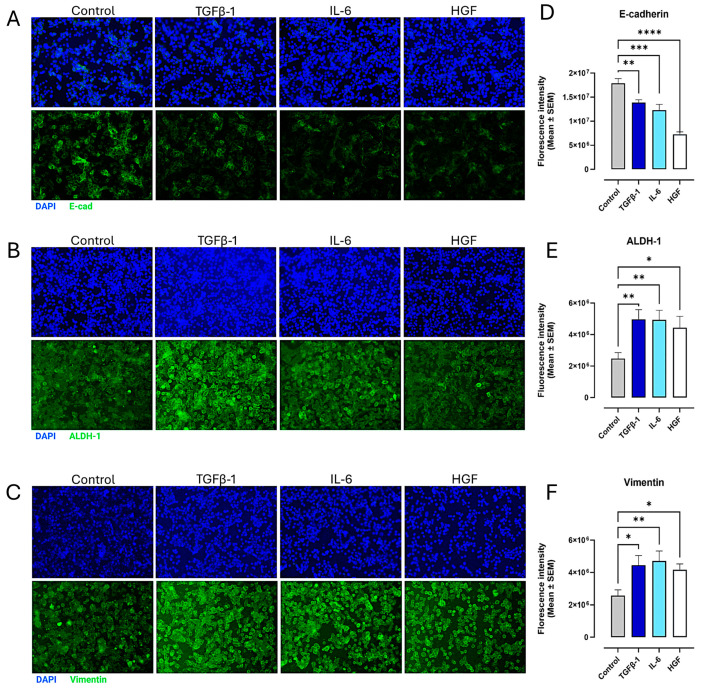
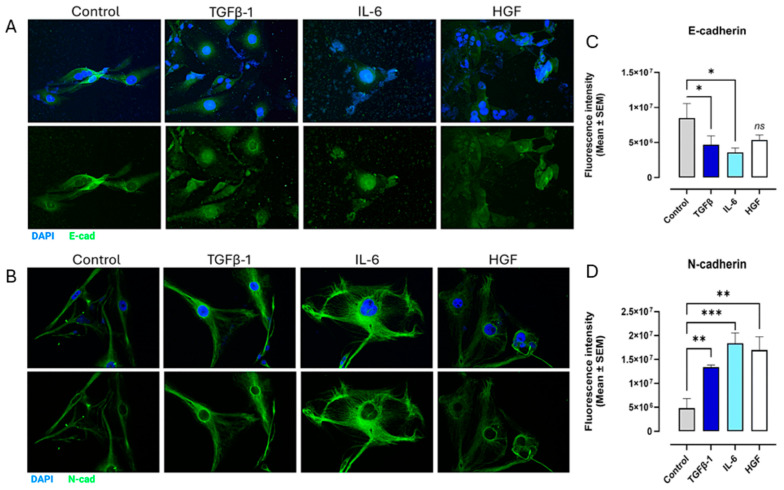
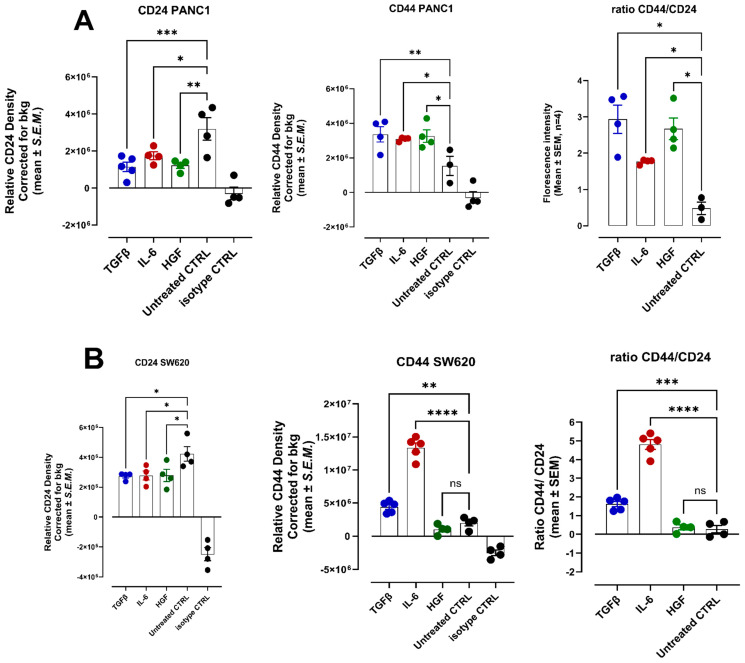
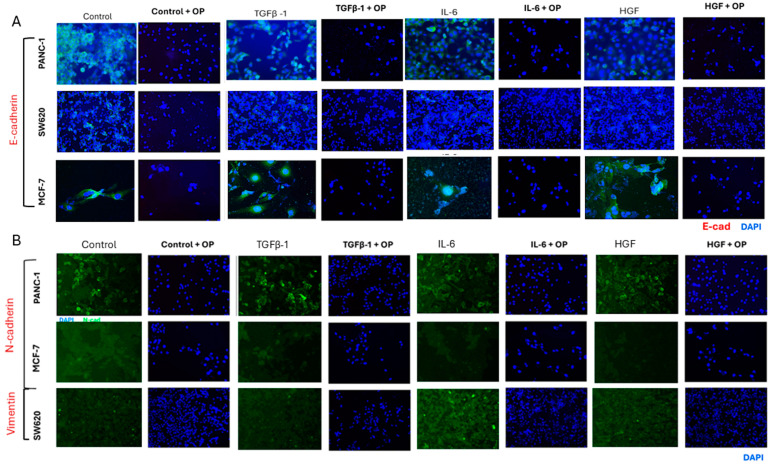
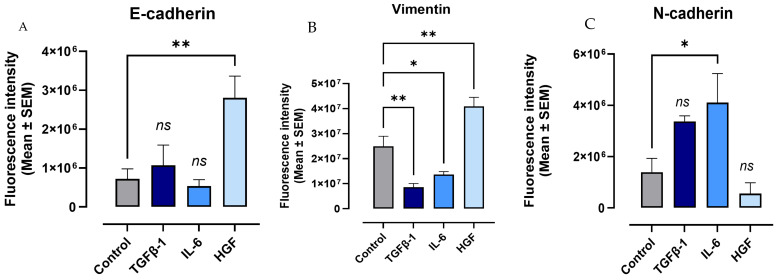
Background/Objectives: The significance of cytokine signaling on cancer progression and metastasis has raised interest in cancer research over the last few decades. Here, we analyzed the effects of three cytokines that we previously reported are significantly upregulated rapidly after the surgical removal of primary breast, colorectal, and prostate cancer. We also investigated the regulation of their cognate receptors. Methods: All experiments were conducted using the PANC-1, SW620, and MCF-7 cell lines, treated with three different cytokines (TGF-β1, HGF, and IL-6). The effect of these cytokines on the expression of epithelial-mesenchymal transition (EMT) cell surface markers and neuraminidase-1 activity was measured via fluorescent microscopy and image analysis software. Results: The findings show that these cytokines increase the expression of mesenchymal markers while reducing epithelial markers, corresponding to the EMT process. A strong link between cytokine receptor signaling and the Neu-1-MMP-9-GPCR crosstalk was identified, suggesting that cytokine receptor binding leads to increased Neu-1 activity and subsequent signaling pathway activation. Oseltamivir phosphate (OP) prevented sialic acid hydrolysis by neuraminidase-1 (Neu-1), leading to the downregulation of these signaling cascades. Conclusions: In concert with the previous work revealing the role of Neu-1 in regulating other glycosylated receptors implicated in cancer cell proliferation and EMT, targeting Neu-1 may provide effective treatment against a variety of malignancies. Most significantly, the treatment of patients with specific inhibitors of Neu-1 soon after primary cancer surgery may improve our ability to cure early-stage cancer by inhibiting the EMT process and disrupting the ability of any residual cancer cell population to metastasize.

Keywords: EMT; glycosylated cytokine receptors; neuraminidase-1; oseltamivir phosphate; pro-inflammatory cytokines.


Conflict of interest statement

William W. Harless owns shares in ENCYT and has a commercial interest and/or patents in the work under consideration.

Figures

Figure 1
Figure 1
Cytokine receptor binding is implicated in the Neu-1-MMP-9-GPCR crosstalk. The binding of a cytokine to its receptor, a receptor tyrosine kinase (RTK), induces conformational changes in the associated GPCR, which in turn activates MMP-9 through the Gα subunit. This change activates Neu-1 by releasing the elastin-binding protein (EBP) from its complex with Neu-1 and protective protein cathepsin A (PPCA). Neu-1 cleaves α-2,3 sialic acid from the terminal glycosyl residue of the receptor, removing steric hindrance, which in turn induces the cytokine-dependent signal from the cytokine-binding receptor. Inhibitors of various components of this signaling paradigm are oseltamivir phosphate (OP; inhibitor of Neu-1), MMP9i (MMP-9 inhibitor), and BIM 23127 (NMBR inhibitor). Abbreviations: RTK: receptor tyrosine kinase; GPCR: G-protein-coupled receptor; MMP-9: matrix metalloprotease-9; Neu-1: neuraminidase-1; PPCA: protective protein cathepsin A; EBP: elastin-binding protein; HGF: hepatocyte growth factor; c-MET: HGF receptor. Citation. Modified in part from Research and Reports in Biochemistry 2013:3 17–30© 2013 Abdulkhalek et al., https://doi.org/10.2147/RRBC.S28430 (accessed on 7 January 2013) [29], publisher and licensee Dove Medical Press Ltd. This is an open-access article that permits unrestricted non-commercial use, provided the original work is properly cited.
Figure 2
Figure 2
Cytokines increase sialidase activity in PANC-1 cells, while inhibitors of signaling paradigm OP, MMP9i, and BIM23 reverse cytokine activity. Pancreatic cancer cells (PANC-1) were treated with either TGFβ-1 (4.0 × 10⁻³ µg/mL) (AD), IL-6 (4.1 × 10⁻⁵ µg/mL) (EH), HGF (5.97 × 10⁻⁴ µg/mL) (IL), and cells treated with inhibitors alone (M) for one minute. 4-MUNANA substrate was added to live cells to measure sialidase activity (emission 450 nm, excitation 365 nm). The addition of (AD) TGFβ-1, (EH) IL-6, and (IL) HGF increased the sialidase fluorescence compared to the untreated control. In contrast, the use of inhibitors of Neu-1 (OP), MMP-9 (MMP9i), and NMBR/GPCR (BIM23) significantly decreased sialidase fluorescence in TGFβ-1 (D), IL-6 (H), and HGF (L) treatment groups. The mean ± SEM (biological replicates: 5, technical replicates: 50) fluorescence density of sialidase activity demonstrates a highly significant (p < 0.0001) downregulation of sialidase activity with all three inhibitors. Abbreviations: TGFβ-1: transforming growth factor beta-1; IL-6: interleukin-6; HGF: hepatocyte growth factor; OP: oseltamivir phosphate; MMP9i: MMP9 inhibitor; BIM23: BIM-23127. **** p < 0.0001.
Figure 3
Figure 3
Cytokines increase sialidase activity in colorectal SW620 cells, while inhibitors of signaling paradigm OP, MMP9i, and BIM23 reverse cytokine activity. Colorectal cancer cells (SW620) were treated with either TGFβ-1 (4.0 × 10⁻³ µg/mL), IL-6 (4.1 × 10⁻⁵ µg/mL), or HGF (5.97 × 10⁻⁴ µg/mL). 4- MUNANA substrate was added to live cells to measure sialidase activity (emission 450 nm, excitation 365 nm). The addition of (A) TGFβ-1, (B) IL-6, and (C) HGF increased the sialidase fluorescence compared to the untreated control. In contrast, the use of inhibitors of Neu-1 (OP), MMP-9 (MMP9i), and NMBR/GPCR (BIM23) significantly decreased sialidase fluorescence in TGFβ-1, IL-6, and HGF treatment groups (DF). The mean ± SEM (biological replicates: 5, technical replicates: 50) fluorescence density of sialidase activity (GI) demonstrates a highly significant (p < 0.0001) downregulation of sialidase activity with all three inhibitors. Abbreviations: TGFβ-1: transforming growth factor beta-1; IL-6: interleukin-6; HGF: hepatocyte growth factor; OP: oseltamivir phosphate; MMP9i: MMP9 inhibitor; BIM23: BIM-23127. **** p < 0.0001.
Figure 4
Figure 4
Cytokines increase sialidase activity in breast MCF-7 cells, while inhibitors of signaling paradigm OP, MMP9i, and BIM23 reverse cytokine activity. Breast cancer cells (MCF-7) were treated with either TGFβ-1 (4.0 × 10⁻³ µg/mL), IL-6 (4.1 × 10⁻⁵ µg/mL), or HGF (5.97 × 10⁻⁴ µg/mL). 4-MUNANA substrate was added to live cells to measure sialidase activity (emission 450 nm, excitation 365 nm). The addition of (A) TGFβ-1, (B) IL-6, and (C) HGF increased the sialidase fluorescence compared to the untreated control. In contrast, the use of inhibitors of Neu-1 (OP), MMP-9 (MMP9i), and NMBR/GCPR (BIM23) significantly decreased sialidase fluorescence in TGFβ-1, IL-6, and HGF treatment groups (DF). The mean ± SEM (biological replicates: 5, technical replicates: 50) fluorescence density of sialidase activity (GI) demonstrates a highly significant (p < 0.0001) downregulation of sialidase activity with all three inhibitors. Abbreviations: TGFβ-1: transforming growth factor beta-1; IL-6: interleukin-6; HGF: hepatocyte growth factor; OP: oseltamivir phosphate; MMP9i: MMP9 inhibitor; BIM23: BIM-23127. **** p < 0.0001.
Figure 5
Figure 5
Receptors of TGFβ-1, IL-6, and HGF colocalize with neuraminidase-1 in PANC-1 cancer cells. Cells were fixed, permeabilized, blocked, and immunostained with the specific antibodies. PANC-1 cells were treated with Alexa Fluor™ 594-conjugated antibodies for the cytokine receptors TGFβR, IL-6R, and HGFR/c-MET and Alexa Fluor™ 488-conjugated Neu-1 antibody. (A) Merging of fluorescent images acquired from Zeiss M2 epi-fluorescent microscope (40× objective magnification) shows areas of colocalization through yellow fluorescence. Pearson correlation coefficient (R-value) measured a significant positive correlation (0.69 < r < 0.74) between the cytokine receptors (B) TGFβR, (C) IL-6R, and (D) HGFR/c-MET and Neu-1 (biological replicates: 4, technical replicates: 1). Abbreviations: TGFβR: transforming growth factor beta receptor; IL-6R: interleukin-6 receptor; HGFR/c-MET: hepatocyte growth factor receptor; Neu-1: neuraminidase-1.
Figure 6
Figure 6
Receptors of TGFβ-1, IL-6, and HGF moderately colocalize with neuraminidase-1 in SW620 cancer cells. Cells were fixed, permeabilized, blocked, and immunostained with the specific antibodies. SW620 cells were treated with Alexa Fluor™ 594-conjugated antibodies for the cytokine receptors TGFβR, IL-6R, and HGFR/c-MET and Alexa Fluor™ 488-conjugated Neu-1 antibody. (A) Merging of fluorescent images acquired from Zeiss M2 epi-fluorescent microscope (40× objective magnification) shows areas of colocalization through yellow fluorescence. Pearson correlation coefficient (R-value) measured a moderate correlation (0.55 < r < 0.60) between the cytokine receptors (B) TGFβR, (C) IL-6R, and (D) HGFR/c-MET and Neu-1 (biological replicates: 4, technical replicates: 1). Abbreviations: TGFβR: transforming growth factor beta receptor; IL-6R: interleukin-6 receptor; HGFR/c-MET: hepatocyte growth factor receptor; Neu-1: neuraminidase-1.
Figure 7
Figure 7
Receptors of TGFβ-1, IL-6, and HGF markedly colocalize with neuraminidase-1 in MCF-7 cancer cells. Cells were fixed, permeabilized, blocked, and immunostained with the specific antibodies. MCF-7 cells were treated with Alexa Fluor™ 594-conjugated antibodies for the cytokine receptors TGFβR, IL-6R, and HGFR/c-MET and Alexa Fluor™ 488-conjugated Neu-1 antibody. (A) Merging of fluorescent images acquired from Zeiss M2 epi-fluorescent microscope (40× objective magnification) shows areas of colocalization (yellow) fluorescence. Pearson correlation coefficient (R-value) measured a strong positive correlation (0.81 < r < 0.92) between the cytokine receptors (B) TGFβR, (C) IL-6R, and (D) HGFR/c-MET and Neu-1 (biological replicates: 4, technical replicates: 1). Abbreviations: TGFβR: transforming growth factor beta receptor; IL-6R: interleukin-6 receptor; HGFR/c-MET: hepatocyte growth factor receptor; Neu-1: neuraminidase-1.
Figure 8
Figure 8
Cytokine treatment enhances the viability of cancer cells, whereas oseltamivir phosphate reduces viability in cytokine-treated cells but does not induce cell death. AlamarBlue cell viability assay tested changes in the viability of (A) PANC-1, (B) SW620, and (C) MCF-7 with the addition of cytokines and OP. In all three cell lines, FBS (medium) increased cell viability, while the addition of OP without any other factors did not impact cell viability compared to untreated control. In PANC-1 and SW620 cells, the addition of TGFβ-1, IL-6, and HGF significantly increased cell viability, whereas in MCF-7 cells, TGFβ-1 increased cell viability, IL-6 decreased cell viability, and HGF did not significantly impact cell viability. In all three cell lines, the combination of (D) TGFβ-1+ OP and (F) HGF + OP decreased cell viability compared to cytokine-treated cells. It brought the overall cell viability down to approximately untreated cell viability. IL-6 combination with OP (E) did not have an impact on cell viability in MCF-7; however, it did decrease cell viability to untreated levels in PANC-1 and SW620 cells. Statistical significance: * p < 0.0404; ** p < 0.0065; *** p < 0.0006; **** p < 0.0001 (biological replicates: 3, technical replicates: 12). Abbreviations: TGFβ-1: transforming growth factor beta-1; IL-6: interleukin-6; HGF: hepatocyte growth factor; OP: oseltamivir phosphate; FBS: fetal bovine serum.
Figure 9
Figure 9
Cytokines upregulate the expression of mesenchymal markers and decrease the expression of epithelial markers in the immunofluorescence of pancreatic cancer cells (PANC-1). PANC-1 cells were treated with either TGFβ-1 (4.0 × 10⁻³ µg/mL), IL-6 (4.1 × 10⁻⁵ µg/mL), or HGF (5.97 × 10⁻⁴ µg/mL) for 24 h. Control cells were untreated. Cells were fixed, permeabilized, blocked, and immunostained with the specific antibodies for EMT markers. Fluorescent imaging of EMT cell markers (A) E-cadherin, (B) ALDH-1, (C) vimentin, and (D) N-cadherin stained with specific monoclonal antibody conjugated with Alexa Fluor 488TM were acquired using Zeiss M2 epi-fluorescent microscope at 20× objective magnification. The nuclear stain used DAPI in the mounting medium, as shown in blue. Fluorescent intensity was measured and graphed for each maker (EH). Each bar represents the mean with error bars denoting SEM (biological replicates: 8, technical replicates: 1). Statistical significance: * p < 0.0147; ** p < 0.0069; *** p <0.0008; **** p < 0.0001. Abbreviations: TGFβ-1: transforming growth factor beta-1; IL-6: interleukin-6; HGF: hepatocyte growth factor; E-cad: E-cadherin; N-cad: N-cadherin.
Figure 10
Figure 10
Cytokines upregulate the expression of mesenchymal markers and decrease the expression of epithelial markers in the immunofluorescence of colorectal cancer cells (SW620). SW620 cells were treated with either TGFβ-1 (4.0 × 10⁻³ µg/mL), IL-6 (4.1 × 10⁻⁵ µg/mL), or HGF (5.97 × 10⁻⁴ µg/mL) for 24 h. Control cells were untreated. Cells were fixed, permeabilized, blocked, and immunostained with the specific antibodies for EMT markers. Fluorescent imaging of EMT cell markers (A) E-cadherin, (B) ALDH-1, and (C) vimentin stained with specific antibody conjugated with Alexa Fluor™ 488 were acquired using Zeiss M2 epi-fluorescent microscope at 20× objective magnification. The nuclear staining used DAPI in the mounting medium, as shown in blue. Fluorescent intensity was measured and graphed for each maker (DF). Each bar represents the mean with error bars denoting SEM (biological replicates: 8, technical replicates: 1). Statistical significance: * p < 0.028; ** p < 0.0071; *** p = 0.0001; **** p < 0.0001. Abbreviations: TGFβ-1: transforming growth factor beta-1; IL-6: interleukin-6; HGF: hepatocyte growth factor; E-cad: E-cadherin; N-cad: N-cadherin.
Figure 11
Figure 11
Cytokines upregulate the expression of mesenchymal marker N-cadherin and decrease epithelial marker E-cadherin in breast cancer cells (MCF-7). MCF-7 cells were treated with either TGFβ-1 (4.0 × 10⁻³ µg/mL), IL-6 (4.1 × 10⁻⁵ µg/mL), or HGF (5.97 × 10⁻⁴ µg/mL) for 24 h. Control cells were untreated. Cells were fixed, permeabilized, blocked, and immunostained with the specific antibodies for EMT markers. Fluorescent imaging of EMT cell markers (A) E-cadherin and (B) N-cadherin stained with specific antibody conjugated with Alexa Fluor™ 488 were acquired using Zeiss M2 epi-fluorescent microscope at 20× objective magnification. The nuclear staining used DAPI, as shown in blue. (C,D) Fluorescent intensity was measured and graphed for each maker. Each bar represents the mean with error bars denoting SEM (biological replicates: 8, technical replicates: 1). Statistical significance: * p < 0.045; ** p < 0.0059; *** p = 0.0003. Abbreviations: TGFβ-1: transforming growth factor beta-1; IL-6: interleukin-6; HGF: hepatocyte growth factor; E-cad: E-cadherin; N-cad: N-cadherin; ns: not significant.
Figure 12
Figure 12
TGFβ-1, IL-6, and HGF induce CD44 and CD24 as markers for identifying and characterizing cancer stem cells (CSCs) in PANC-1 and SW620 cancer cells. Expression of CD44, CD24, and ratio CD44/24 on (A) PANC-1 and (B) SW620 cells following treatment with TGFβ-1 (4.0 × 10⁻³ µg/mL), IL-6 (4.1 × 10⁻⁵ µg/mL), or HGF (5.97 × 10⁻⁴ µg/mL) for 24 h. Relative density is reported as a mean ± SEM of 5 images of stained cells per treatment. Fluorescent imaging of EMT cell markers CD44 and CD24 stained with specific antibodies conjugated with Alexa Fluor™ 488 was acquired using a Zeiss M2 epi-fluorescent microscope at 20× objective magnification. Each bar represents the mean with error bars denoting SEM (biological replicates: 5, technical replicates: 1). Statistical significance: * p < 0.045; ** p < 0.0059; *** p = 0.0003; **** p < 0.0001; and ns = non-significance. Abbreviations: TGFβ-1: transforming growth factor beta-1; IL-6: interleukin-6; HGF: hepatocyte growth factor.
Figure 13
Figure 13
Immunofluorescence with the addition of OP does not show expression of any EMT markers. An immunofluorescence assay was conducted to determine the impact of OP on markers of EMT. The same protocol was used with the change in an Alexa Fluor 488™ conjugated antibody for EMT markers. Cells (200,000 cells/well) were treated with OP for 15 min. Cells were fixed, permeabilized, blocked, and immunostained with the specific antibodies for EMT markers. Fluorescent imaging of EMT cell markers E-cadherin, vimentin, and N-cadherin stained with Alexa Fluor™ 488 conjugated antibody was acquired using Zeiss M2 epi-fluorescent microscope at 20× objective magnification. (A) No fluorescence was noted for E-cadherin following OP treatment in the three cell lines compared to the cytokine-treated controls. (B) Similar findings were seen with mesenchymal markers N-cadherin and vimentin. DAPI nuclear staining shows an intact nucleus, indicating that the cells are intact; they do not express cell surface markers for EMT (biological replicates: 3, technical replicates: 1). Abbreviations: TGFβ-1: transforming growth factor beta-1; IL-6: interleukin-6; HGF: hepatocyte growth factor; OP: oseltamivir phosphate; E-cad: E-cadherin; N-cad: N-cadherin.
Figure 14
Figure 14
Immunofluorescence for EMT markers in RAW-Blue macrophages. RAW-Blue macrophages were treated with cytokines following the same protocol as in Figure 8, Figure 9 and Figure 10. Fluorescent imaging of EMT cell surface markers (A) E-cadherin, (B) vimentin, and (C) N-cadherin stained with Alexa Fluor™ 488 were acquired using Zeiss M2 epi-fluorescent microscope at 20× objective magnification. The findings show contrasting findings to those seen in the cancer cells (PANC-1, SW620, and MCF-7). The epithelial marker E-cadherin (A) demonstrated a significant increase (** p = 0.0038) in HGF-treated cells, while TGFβ-1 and IL-6 were insignificant. Mesenchymal vimentin (B) demonstrated a downregulated expression in TGFβ (** p = 0.0012) and IL-6 (* p = 0.0122) and an increased expression in HGF (p = 0.0024)-treated macrophages. The other mesenchymal marker, N-cadherin (C), also had significantly upregulated levels in IL-6 (* p = 0.0149), while TGFβ-1, even though it is higher than untreated cells, was insignificantly higher. HGF-treated cells saw a decreased expression of N-cadherin, although it was also insignificant. Data are represented as mean ± SEM (biological replicates: 4, technical replicates: 1). Abbreviations: TGFβ-1: transforming growth factor beta-1; IL-6: interleukin-6; HGF: hepatocyte growth factor; ns: not significant.

Similar articles

References

    1. Liu C., Chu D., Kalantar-Zadeh K., George J., Young H.A., Liu G. Cytokines: From clinical significance to quantification. Adv. Sci. 2021;8:2004433. doi: 10.1002/advs.202004433. - DOI - PMC - PubMed
    1. Conlon K.C., Miljkovic M.D., Waldmann T.A. Cytokines in the treatment of cancer. J. Interferon Cytokine Res. 2019;39:6–21. doi: 10.1089/jir.2018.0019. - DOI - PMC - PubMed
    1. Owen J.A., Punt J., Stranford S.A., Jones P.P., Kuby J. Kuby Immunology. 7th ed. W.H. Freeman; New York, NY, USA: 2013.
    1. Liang L., Kaufmann A.M. The significance of cancer stem cells and epithelial-mesenchymal transition in metastasis and anti-cancer therapy. Int. J. Mol. Sci. 2023;24:2555. doi: 10.3390/ijms24032555. - DOI - PMC - PubMed
    1. Grivennikov S.I., Karin M. Inflammation and oncogenesis: A vicious connection. Curr. Opin. Genet. Dev. 2010;20:65–71. doi: 10.1016/j.gde.2009.11.004. - DOI - PMC - PubMed

LinkOut - more resources