. 2025 Apr 7;17(7):1251.
doi: 10.3390/cancers17071251.

Innovative qPCR Algorithm Using Platelet-Derived RNA for High-Specificity and Cost-Effective Ovarian Cancer Detection

Affiliations

Innovative qPCR Algorithm Using Platelet-Derived RNA for High-Specificity and Cost-Effective Ovarian Cancer Detection

Eunyong Ahn et al. Cancers (Basel). .

Abstract

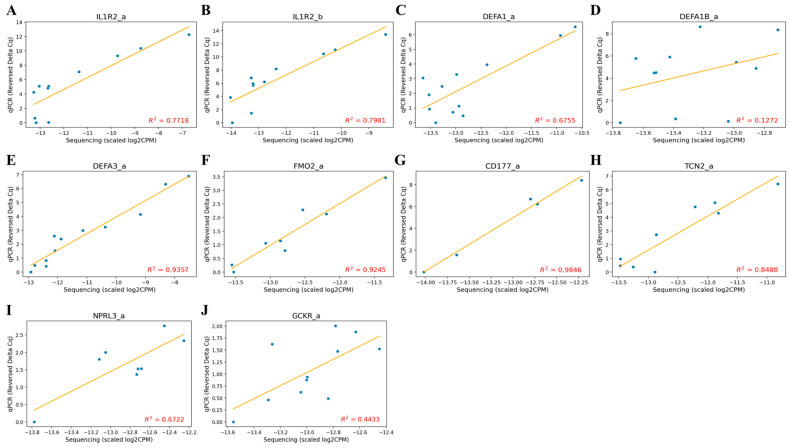
Background/Objectives: Ovarian cancer (OC) remains one of the most lethal gynecologic malignancies, largely due to the challenges of early detection. While next-generation sequencing (NGS) has been explored for screening, its high cost limits large-scale implementation. To develop a more accessible diagnostic solution, we designed a qPCR-based algorithm optimized for early OC detection, with a focus on high-grade serous ovarian cancer (HGSOC), the most aggressive subtype. Methods: Peripheral blood samples from 19 ovarian cancer patients, 37 benign tumor patients, and 34 asymptomatic controls were analyzed using RNA sequencing to identify splice junction-based biomarkers with minimal expression in benign samples but elevated in OC. Results: A final panel of 10 markers was validated via qPCR, demonstrating strong agreement with sequencing data (R2 = 0.44-0.98). The classification algorithm achieved 94.1% sensitivity and 94.4% specificity (AUC = 0.933). Conclusions: By leveraging platelet RNA profiling, this approach offers high specificity, accessibility, and potential for early OC detection. Future studies will focus on expanding histologic diversity and refining biomarker panels to further enhance diagnostic performance.

Keywords: early detection; inflammation; ovarian cancer; platelet RNA; qPCR algorithm.


Conflict of interest statement

Eunyong Ahn, Se Ik Kim, Sungmin Park, Sarah Kim, TaeJin Ahn, and Yong-Sang Song are stockholders of Foretell My Health, Inc. Eunyong Ahn, Sungmin Park, Sarah Kim, Hyunjung Kim, Hyejin Lee, Eun Ji Song, TaeJin Ahn are affiliated with the company Foretell My Health, Inc. We affirm that this conflict of interest does not affect the integrity, objectivity, or validity of the research conducted. All efforts have been made to ensure that the research is conducted impartially and accurately. Patent applications related to some parts of these findings in this study have been filed by the authors.

Figures

Figure 1
Figure 1
Boxplots of the expression levels of ACTB for institutions. The log2CPM and Cq values of samples from Handong Global University Boaz Medical Center (HGU), Seoul National University Hospital (SNUH), Myongji Hospital (MJH) are shown. p-values from Wilcoxon tests: ns = not significant. (A) The log2CPM values of ACTB in training dataset (B) The Cq values of ACTB in a total of 90 samples.
Figure 2
Figure 2
Marker analysis of log2CPM values in the training dataset. Log2CPM values of RNA sequencing data from Asymptomatic control (AC), Benign gynecological tumor (Benign), and Ovarian cancer (OC) group in training dataset are shown. p-values from Wilcoxon tests: ns = not significant, * ≤ 0.05, ** ≤ 0.01, **** ≤ 0.0001. (A) The expression levels of IL1R2_a marker (B) The expression levels of IL1R2_b marker (C) The expression levels of DEFA1_a marker (D) The expression levels of DEFA1B_a marker (E) The expression levels of DEFA3_a marker (F) The expression levels of FMO2_a marker (G) The expression levels of CD177_a marker (H) The expression levels of TCN2_a marker (I) The expression levels of NPRL3_a marker (J) The expression levels of GCKR_a marker.
Figure 3
Figure 3
Marker correlation plot of scaled log2CPM values and reversed ΔCq values. Correlation plots of RNA sequencing data and qPCR data are shown. The orange line represents the linear regression line, and the R-squared value is displayed for each marker. Scaled log2CPM values are calculated as the marker log2CPM values minus the ACTB log2CPM values. Reversed ΔCq values are derived by subtracting the marker ΔCq values from the maximum ΔCq value of the marker. Only samples with non-NA raw Cq values are included. (A) The correlation plot of IL1R2_a marker (B) The correlation plot of IL1R2_b marker (C) The correlation plot of DEFA1_a marker (D) The correlation plot of DEFA1B_a marker (E) The correlation plot of DEFA3_a marker (F) The correlation plot of FMO2_a marker (G) The correlation plot of CD177_a marker (H) The correlation plot of TCN2_a marker (I) The correlation plot of NPRL3_a marker (J) The correlation plot of GCKR_a marker.
Figure 4
Figure 4
Marker analysis of ΔCq values in training dataset. ΔCq values of qPCR data from Benign gynecological tumor (Benign), and Ovarian cancer (OC) group in training dataset are shown. p-values from Wilcoxon tests: ns = not significant, * ≤ 0.05. (A) The expression levels of IL1R2_a marker (B) The expression levels of IL1R2_b marker (C) The expression levels of DEFA1_a marker (D) The expression levels of DEFA1B_a marker (E) The expression levels of DEFA3_a marker (F) The expression levels of FMO2_a marker (G) The expression levels of CD177_a marker (H) The expression levels of TCN2_a marker (I) The expression levels of NPRL3_a marker (J) The expression levels of GCKR_a marker.
Figure 5
Figure 5
Boxplots of the classification score in training, test, and total dataset. Separate boxplots show the classification scores generated by the algorithm for (A) training, (B) test, and (C) total samples. The groups—Asymptomatic Controls (AC), Benign Gynecological Tumors (Benign), and Ovarian Cancer (OC)—are indicated. The score threshold is represented by a red line.
Figure 6
Figure 6
Receiver operating characteristic (ROC) curves of the algorithm.

References

    1. Torre L.A., Trabert B., DeSantis C.E., Miller K.D., Samimi G., Runowicz C.D., Gaudet M.M., Jemal A., Siegel R.L. Ovarian cancer statistics, 2018. CA Cancer J. Clin. Wiley. 2018;68:284–296. - PMC - PubMed
    1. Menon U., Gentry-Maharaj A., Burnell M., Singh N., Ryan A., Karpinskyj C., Carlino G., Taylor J., Massingham S.K., Raikou M., et al. Ovarian cancer population screening and mortality after long-term follow-up in the UK Collaborative Trial of Ovarian Cancer Screening (UKCTOCS): A randomised controlled trial. Lancet. 2021;397:2182–2193. doi: 10.1016/S0140-6736(21)00731-5. - DOI - PMC - PubMed
    1. Jacobs I.J., Menon U., Ryan A., Gentry-Maharaj A., Burnell M., Kalsi J.K., Amso N.N., Apostolidou S., Benjamin E., Cruickshank D., et al. Ovarian cancer screening and mortality in the UK Collaborative Trial of Ovarian Cancer Screening (UKCTOCS): A randomised controlled trial. Lancet. 2016;387:945–956. - PMC - PubMed
    1. Han C.Y., Lu K.H., Corrigan G., Perez A., Kohring S.D., Celestino J., Bedi D., Bedia E., Bevers T., Boruta D., et al. Normal Risk Ovarian Screening Study: 21-Year Update. J. Clin. Oncol. 2024;42:1102–1109. - PMC - PubMed
    1. Barrett J.E., Jones A., Evans I., Reisel D., Herzog C., Chindera K., Kristiansen M., Leavy O.C., Manchanda R., Bjørge L., et al. The DNA methylome of cervical cells can predict the presence of ovarian cancer. Nat. Commun. 2022;13:448. - PMC - PubMed

LinkOut - more resources