. 2025 Apr 22;122(16):e2426385122.
doi: 10.1073/pnas.2426385122. Epub 2025 Apr 14.

The multifaceted roles of the transcriptional coactivator TAZ in extravillous trophoblast development of the human placenta

Affiliations

The multifaceted roles of the transcriptional coactivator TAZ in extravillous trophoblast development of the human placenta

Gudrun Meinhardt et al. Proc Natl Acad Sci U S A. .

Abstract

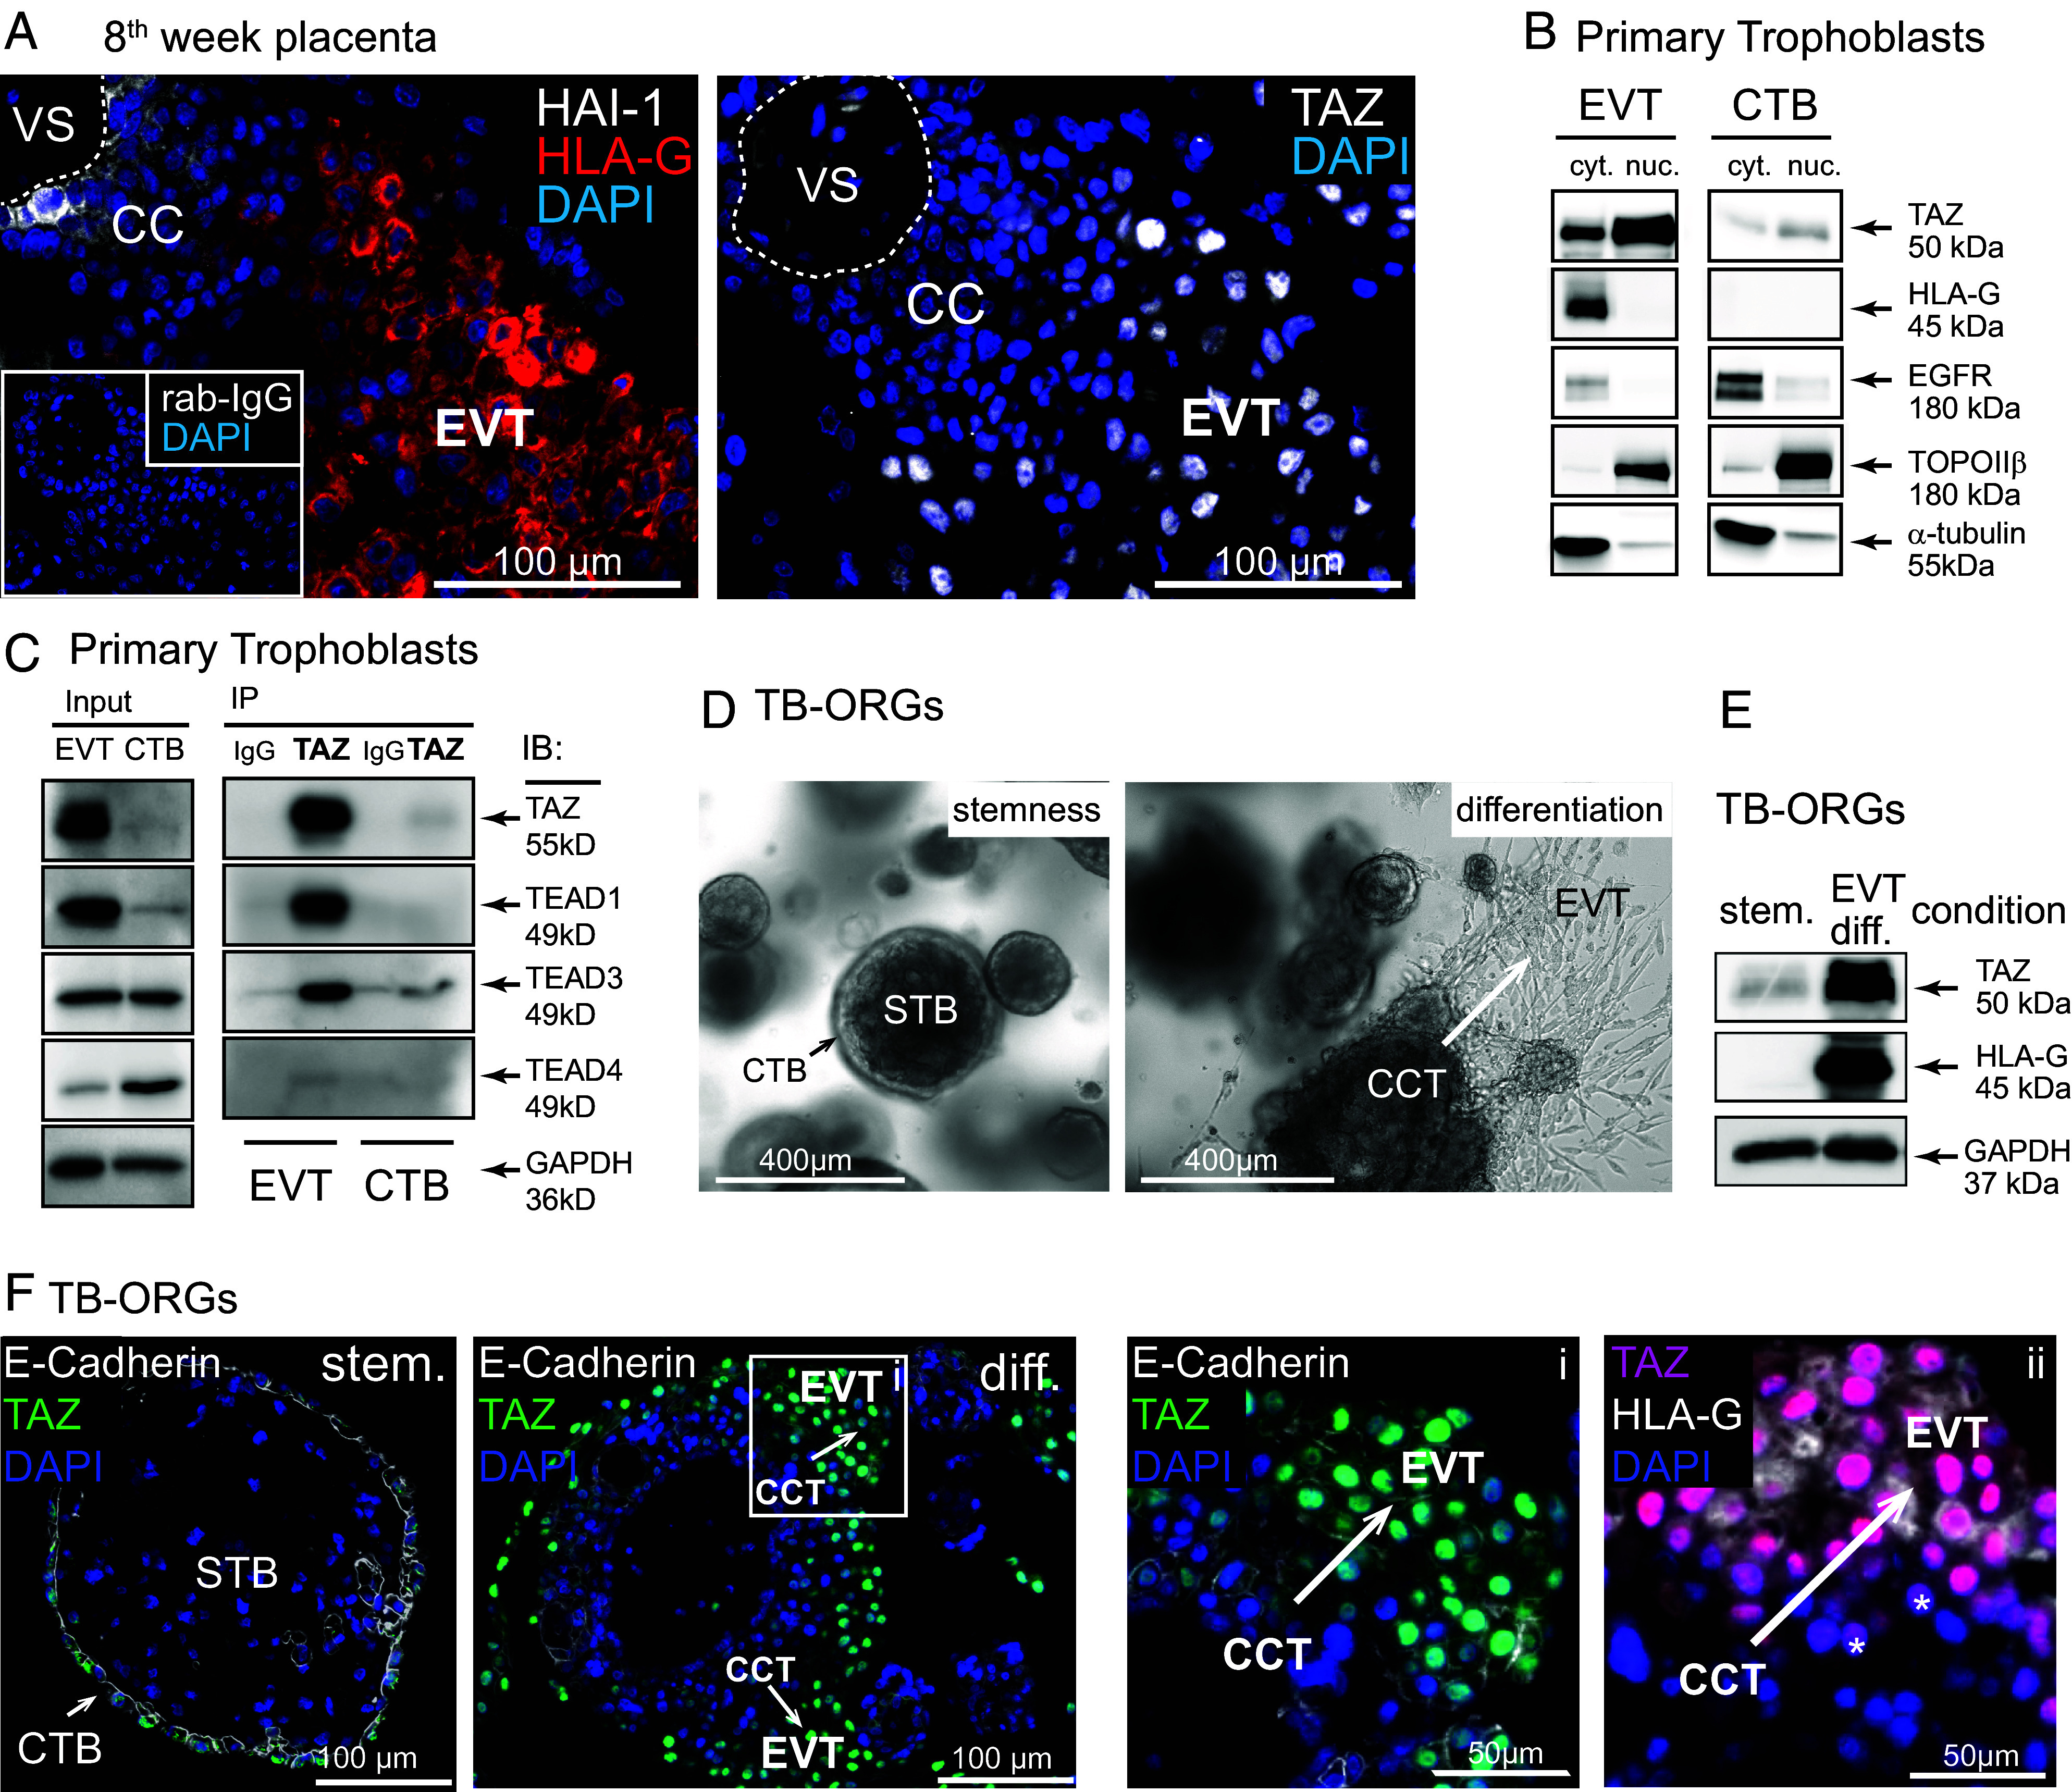
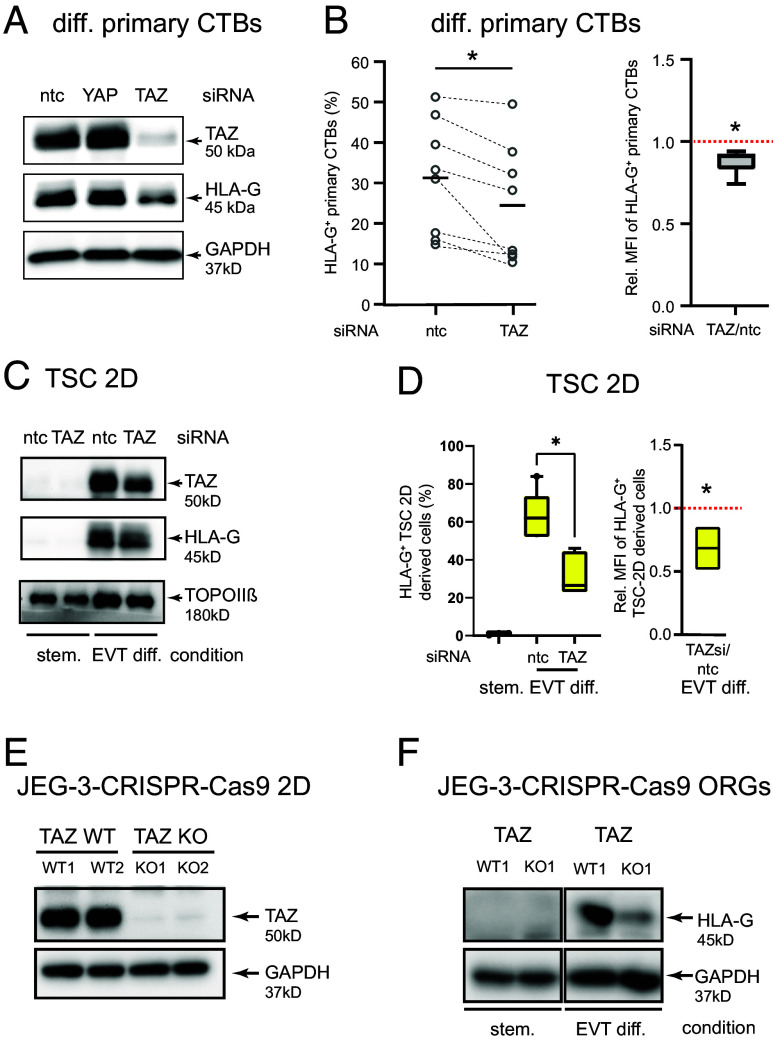
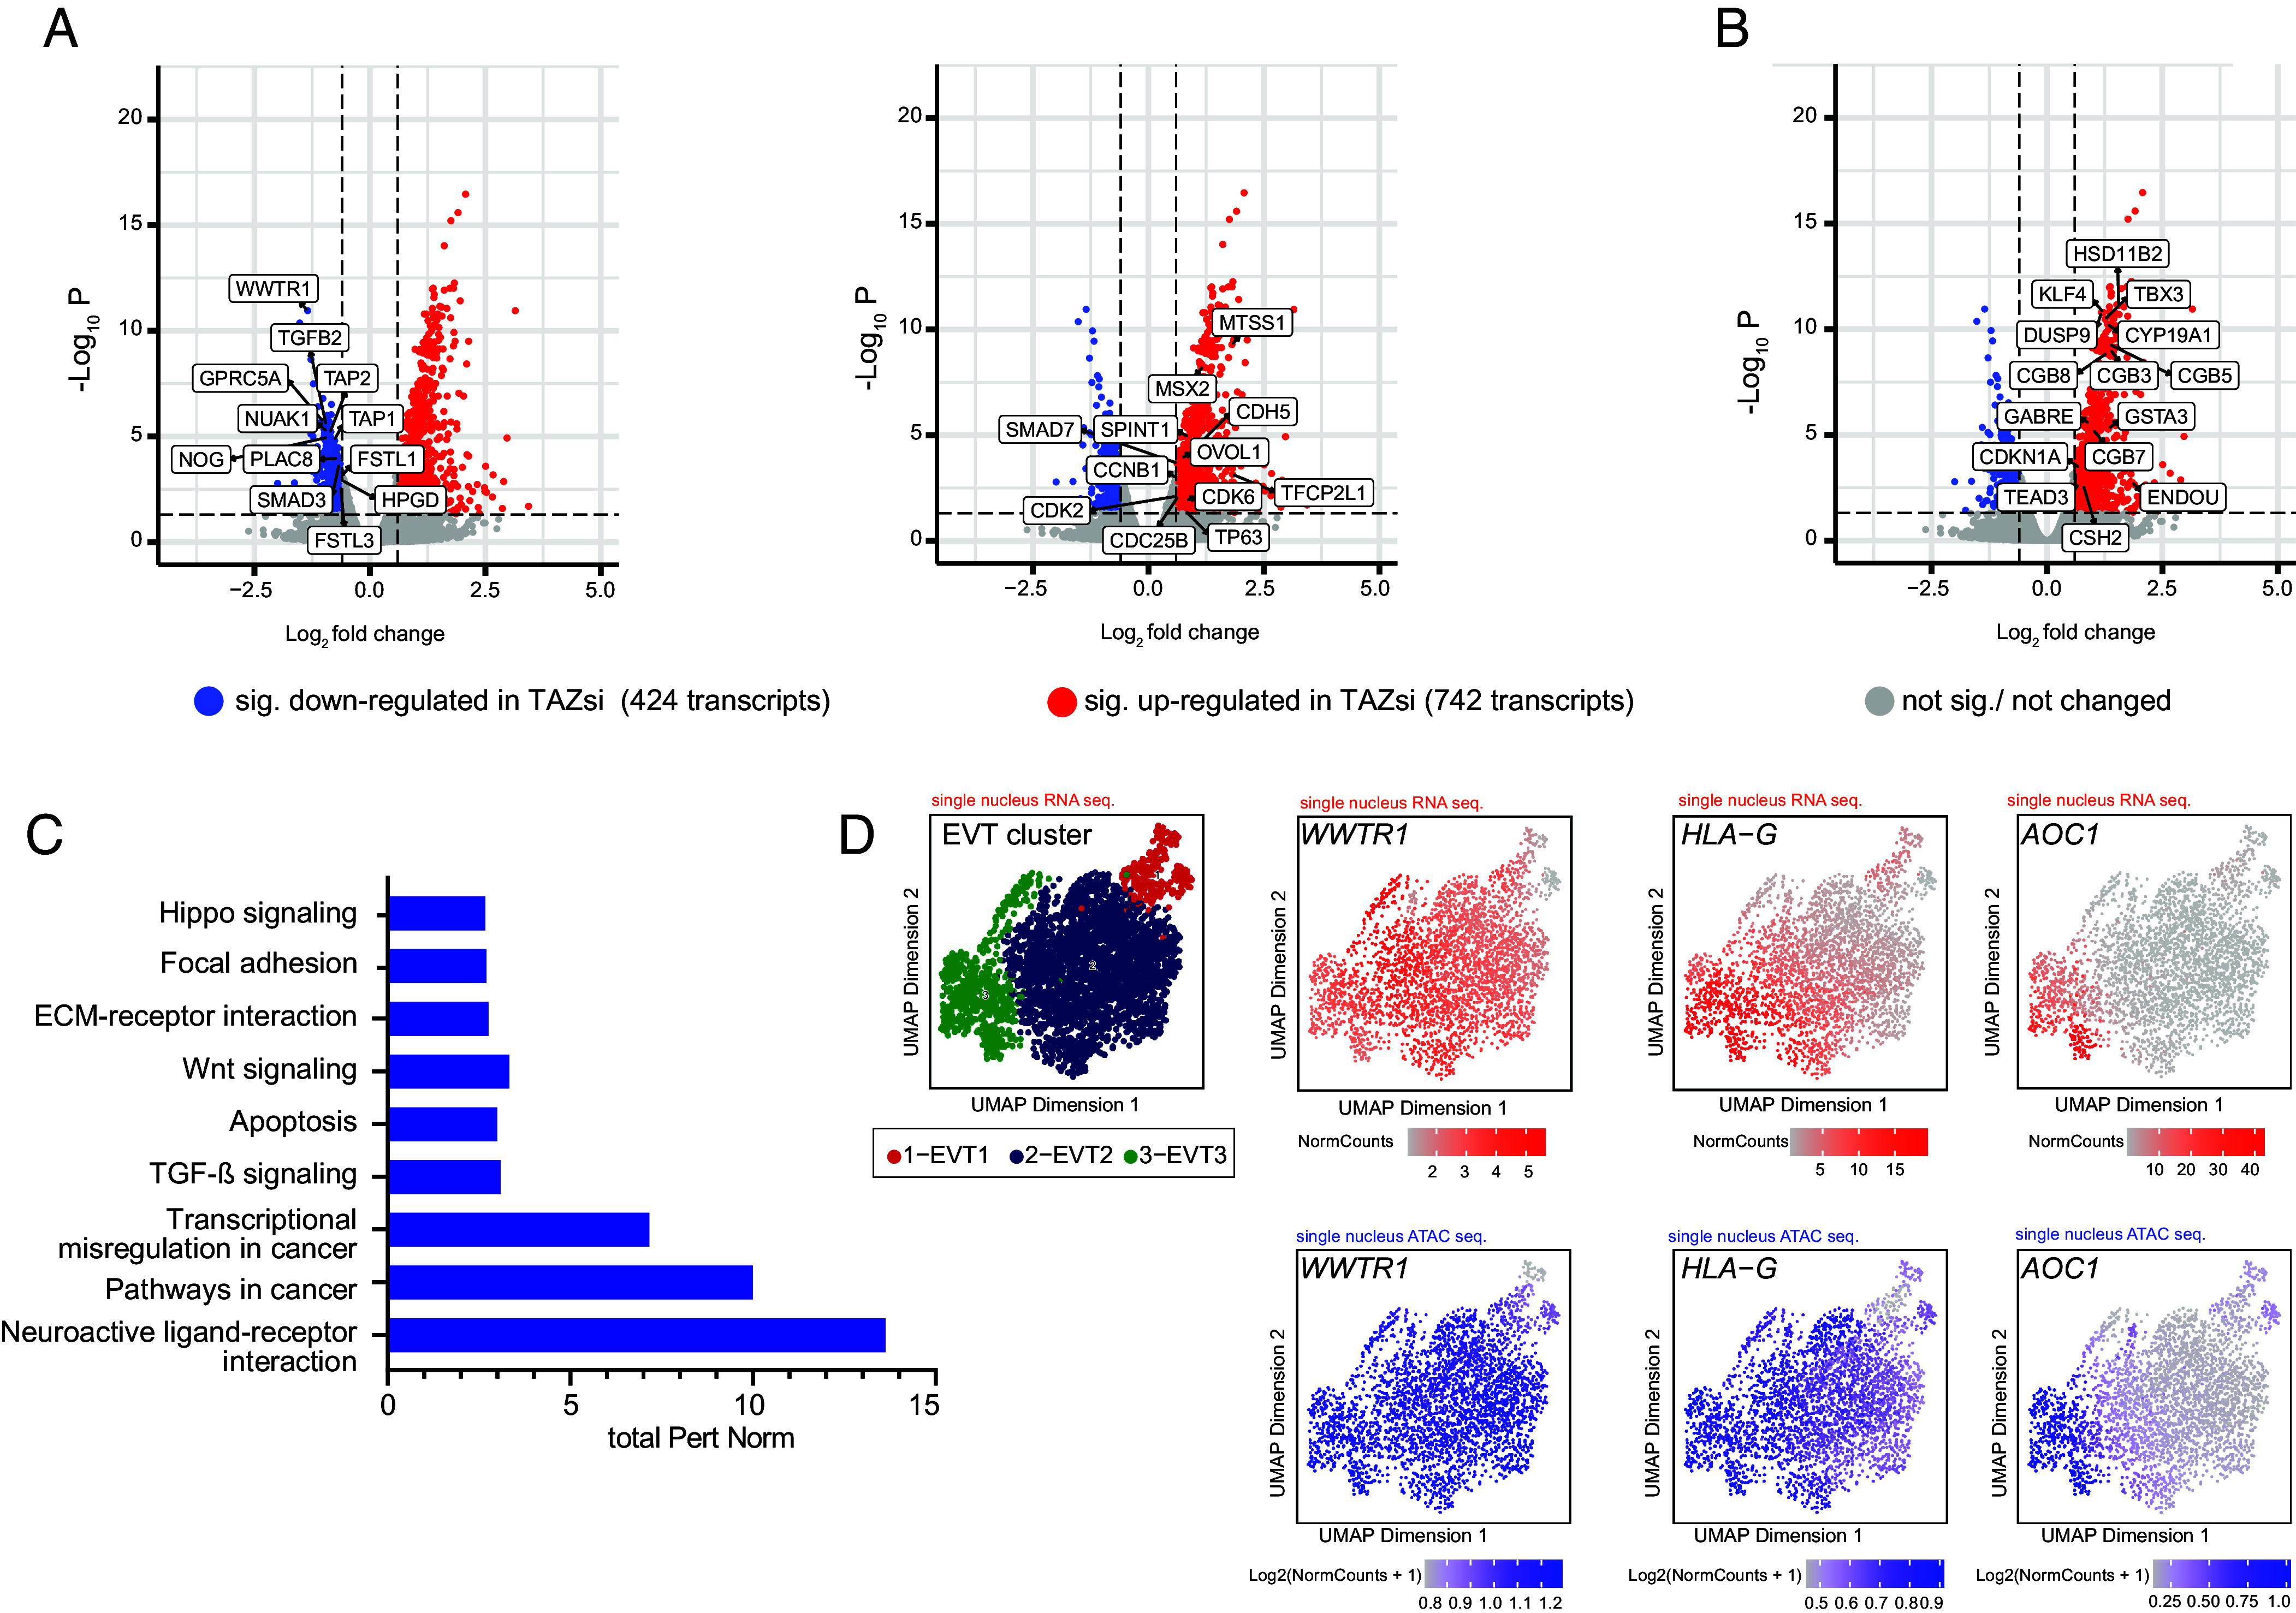
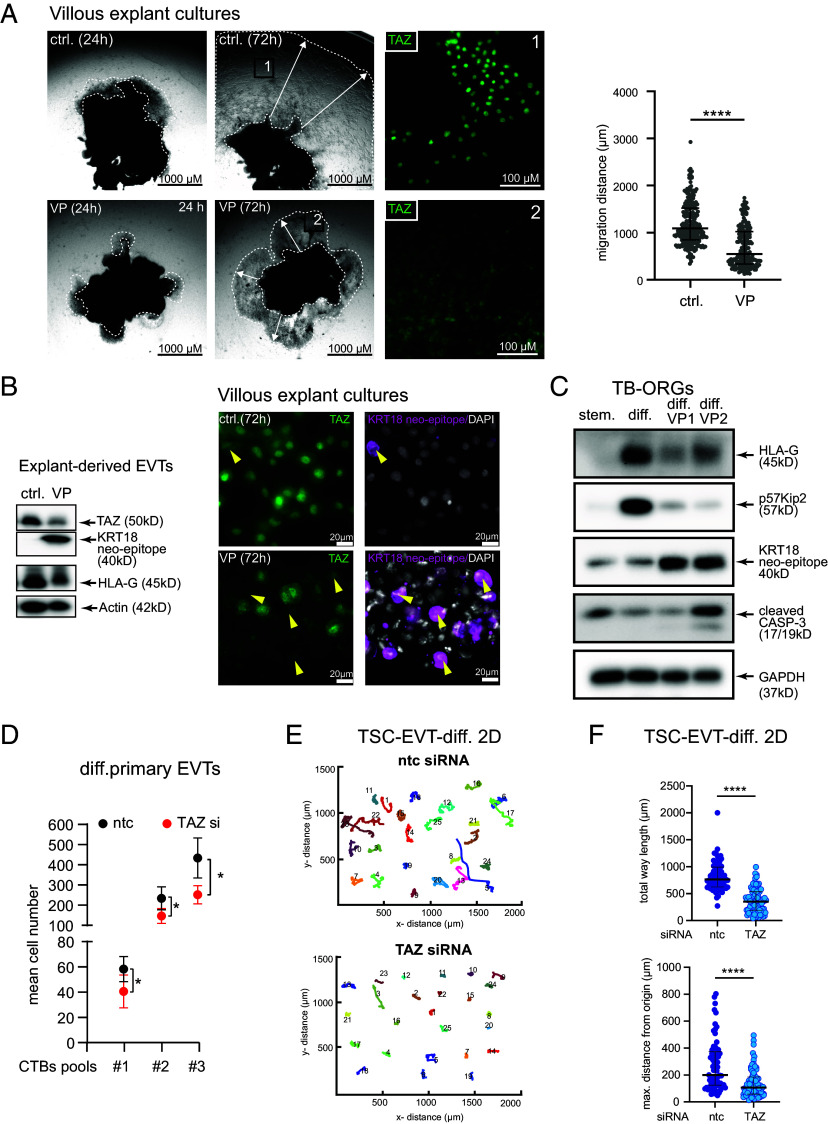
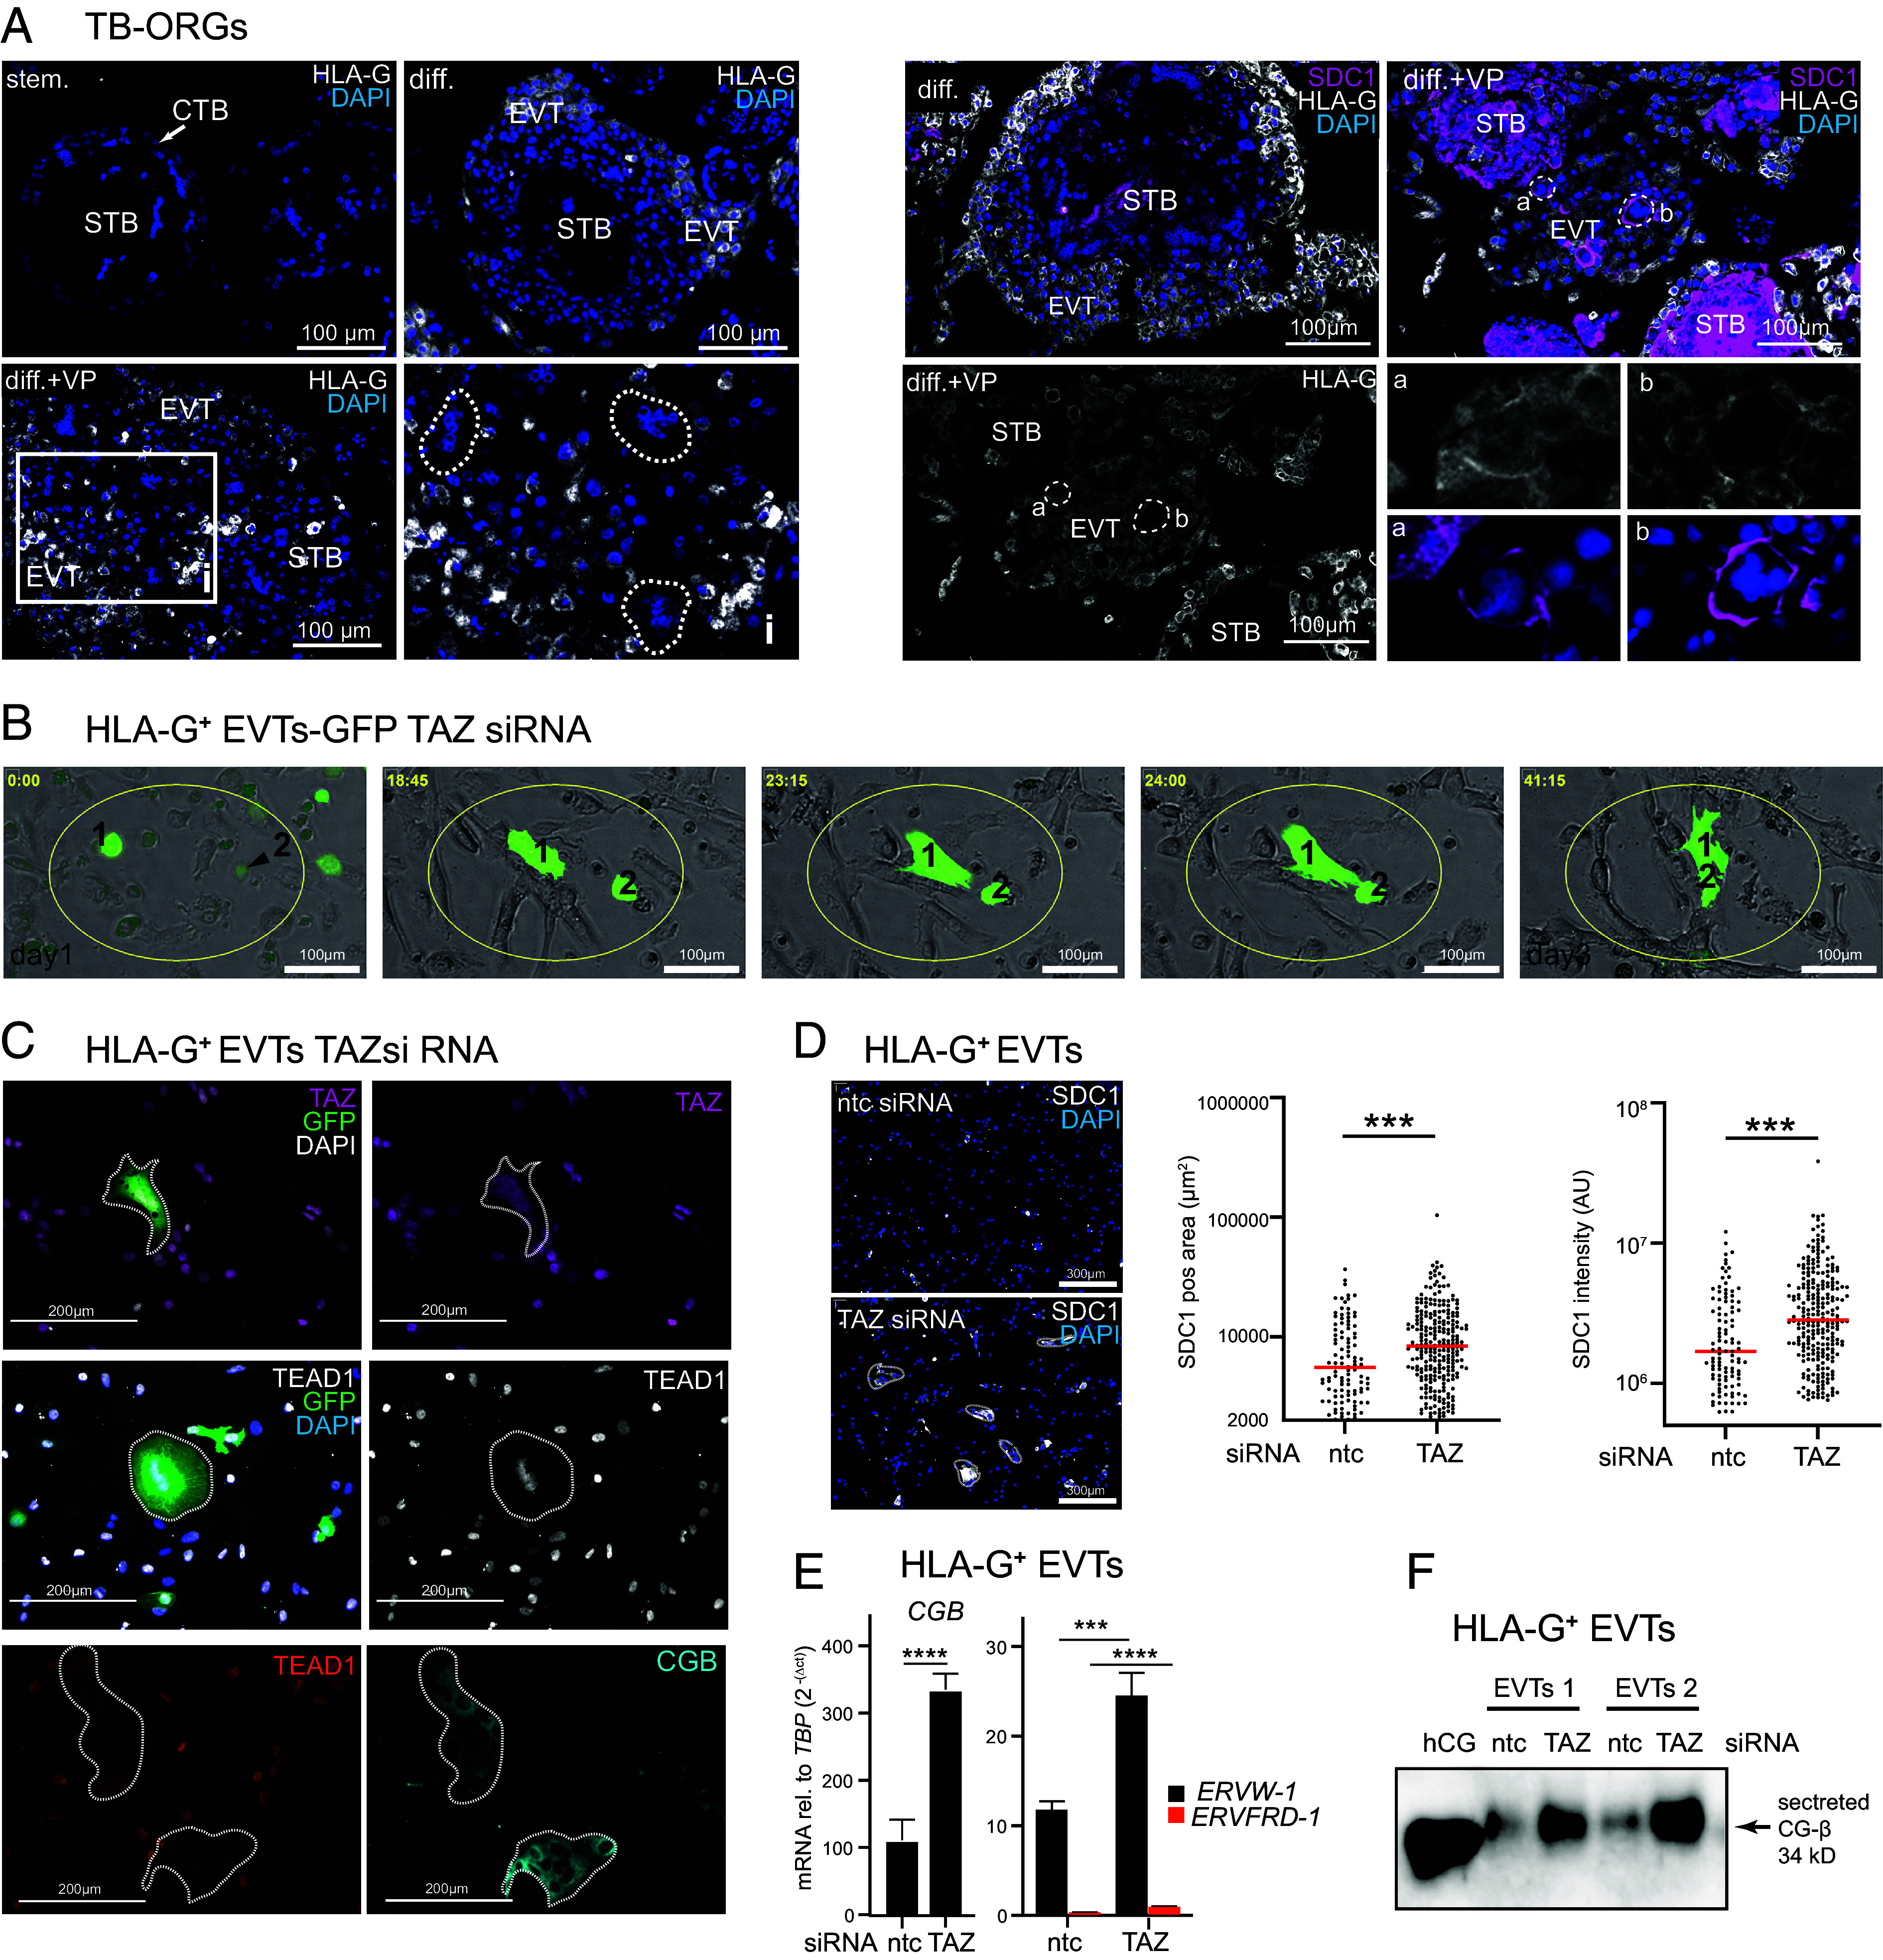
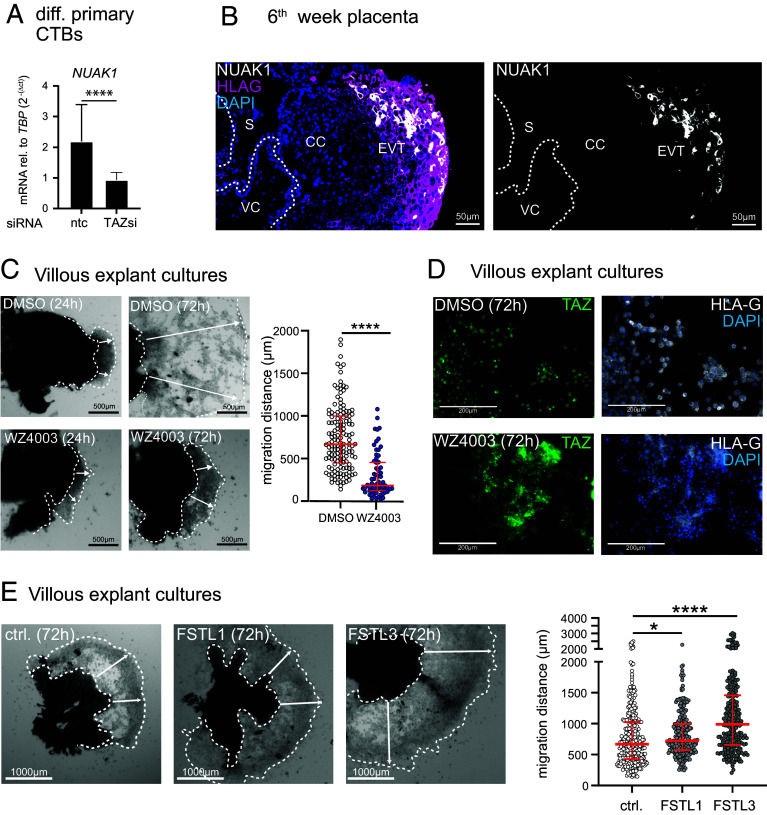
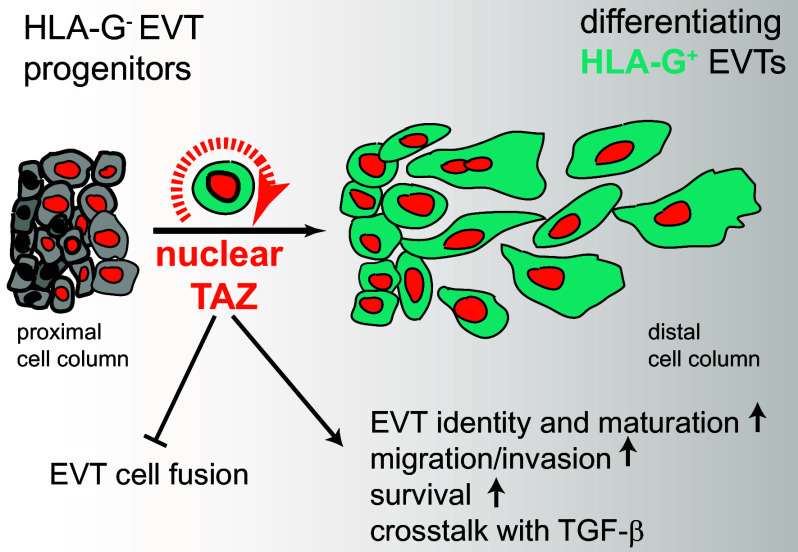
Insights into the molecular processes that drive early development of the human placenta is crucial for our understanding of pregnancy complications such as preeclampsia and fetal growth restriction, since defects in maturation of its epithelial cell, the trophoblast, have been detected in the severe forms of these diseases. However, key regulators specifying the differentiated trophoblast subtypes of the placenta are only slowly emerging. By using diverse trophoblast cell models, we herein show that the transcriptional coactivator of HIPPO signaling, TAZ, plays a pivotal role in the development of invasive extravillous trophoblasts (EVTs), cells that are essential for decidual vessel remodeling and adaption of maternal blood flow to the placenta. Ribonucleic acid sequencing (RNA-seq) or protein analyses upon TAZ gene silencing or CRISPR-Cas9-mediated knockout in differentiating trophoblast stem cells, organoids, primary EVTs, choriocarcinoma cells, or villous explant cultures unraveled that the coactivator promoted expression of genes associated with EVT identity, motility, and survival. Accordingly, depletion or chemical inhibition of TAZ, interacting with TEA domain family member 1 (TEAD1), impaired EVT differentiation, invasion, and migration and triggered apoptosis in the different trophoblast models. Notably, the coactivator also suppressed cell cycle genes and regulators of trophoblast self-renewal and prevented EVTs from cell fusion in organoids and primary cultures. Moreover, TAZ promoted human leukocyte antigen G (HLA-G) surface expression and increased NUAK1 kinase in EVTs thereby maintaining its own expression. In summary, the transcriptional coactivator TAZ plays a multifaceted role in the development of the EVT cell lineage by controlling different biological processes that initiate and preserve differentiation.

Keywords: TAZ; differentiation; extravillous trophoblast; human placenta; trophoblast organoid.


Conflict of interest statement

Competing interests statement:The authors declare no competing interest.

Figures

Fig. 1.
Fig. 1.
Expression pattern of TAZ in first-trimester placental tissues, primary trophoblasts, and TB-ORGs and its interaction with TEAD proteins. (A) TAZ IF in 8th week placenta. Representative serial sections of early placentae (6th to 9th week, n = 7) are shown. Inset picture depicts negative control staining using a primary rabbit IgG (rab-IgG). HAI-1 and HLA-G were used as markers of the proximal cell column (CC)/CTB and EVT, respectively. DAPI marks nuclei. The dashed line demarcates the villous stroma (VS). (B) Representative western blot showing cytoplasmic (cyt.) and nuclear (nuc.) distribution of TAZ in CTBs and HLA-G+ EVTs purified from first-trimester placenta (n = 3 different preparations, each isolated from 3 to 4 pooled 6th- to 9th-week tissues). Distribution of TOPOIIβ and α-tubulin indicate purity of nuclear and cytoplasmic extracts, respectively. (C) Representative coimmunoprecipitation of TAZ with TEAD proteins in CTB and EVT lysates of first-trimester placenta (n = 3, prepared from 4 to 5 pooled 6th- to 9th-week tissues). Immunoblots (IB) show expression of TAZ and TEADs in extracts before (input) and after immunoprecipitation (IP) with TAZ antibody or negative control IgG. GAPDH was used as a loading control for input extracts. (D) Light microscopy images of TB-ORGs (prepared from a single 6th-week placenta) grown under stemness or differentiation condition (absence of CHIR99021 for 10 d). (E) Representative western blot showing TAZ and HLA-G expression in lysates of self-renewing and differentiated TB-ORGs (derived from n = 3 single 6th- to 7th-week placentae). GAPDH was used as loading control. (F) Representative IF images detecting TAZ, E-cadherin, and HLA-G localization in sections of TB-ORGs (n = 3, prepared from single 6th- to 7th-week placentae) cultivated under stemness (stem.) and differentiation (diff.) condition. Inset picture (i) is shown at a higher magnification to the Right. (ii) is derived from the same region on a serial section. TAZ+/HLA-G EVTs are marked with stars. CCT, cell column trophoblast; CTB, cytotrophoblast; EVT, extravillous trophoblast; STB, syncytiotrophoblast.
Fig. 2.
Fig. 2.
Genetic manipulation of TAZ in different trophoblast models affects HLA-G expression. (A) Representative western blot showing TAZ and HLA-G in protein lysates isolated from TAZ or YAP siRNA-treated primary CTBs after cultivation on fibronectin for 72 h (n = 5 different preparations, each isolated from 3 to 4 pooled 6th- to 9th-week placentae). GAPDH was used as a loading control. ntc, nontargeting control; (B) Flow cytometry analyses of TAZ siRNA-treated CTBs (n = 8, purified from 2 to 4 pooled 6th- to 9th-week tissues) cultivated for 72 h on fibronectin. Percentage of HLA-G+ cells (Left graph; values of each experiment connected with dashed lines) and the mean HLA-G fluorescence intensity (MFI) per cell (Right graph, box-whiskers plot; ratio TAZ siRNA/ntc) are shown. Median values are depicted. ntc, nontargeting control. *P < 0.05. (C) Immunodetection of TAZ and HLA-G in TAZ siRNA- or ntc-treated self-renewing (stem.) TSCs and TSCs differentiating into EVTs in 2D upon depletion (6 d) of the WNT activator CHIR99021 from the stem cell medium (EVT diff.). A representative western blot of n = 3 different cultures is shown. TOPOIIβ was used as loading control. (D) Flow cytometry analysis of TAZ siRNA-treated differentiating TSCs. Box whiskers blots show the percentage of HLA-G+ cells (Left graph) and their mean HLA-G fluorescence intensity (Right graph, ratio of TAZ siRNA/ntc) before (stem.) and after EVT differentiation of TSCs incubated with the different siRNAs. Median values of n = 3 different TSC preparations are depicted. *P < 0.05. (E) Representative immunoblot (n = 3) showing TAZ protein expression in the two JEG-3 CRISPR-Cas9 TAZ KO clones and the two WT clones cultivated in 2D. GAPDH was used as loading control. (F) Representative western blot (n = 3) depicting HLA-G expression in JEG-3 TAZ KO organoids cultivated under stemness conditions or in EVT differentiation medium (absence of CHIR99021 for 7 d). GAPDH was used as loading control.
Fig. 3.
Fig. 3.
Bioinformatic analyses showing genes and pathways controlled by TAZ in different trophoblast cell models. (AC) DEGs were evaluated by using bulk RNA-seq analyses of primary CTBs (n = 3, derived from 2 to 3 pooled 8th- to 10th-week placentae) after cultivation on fibronectin and treatment with TAZ siRNA or ntc for 72 h. (A) Volcano plots showing DEGs (dots illustrate individual transcripts, colored according to P values and log2 fold change (DESeq2, standard parameters, Padj < 0.05, DE: fold change > 1.5). Left graph shows a selection of EVT markers that were significantly downregulated by TAZ siRNAs, whereas Right graph highlights upregulated CTB progenitor markers and cell cycle genes. (B) Volcano plot depicting selected STB markers (DEGs) that were upregulated in TAZ-siRNA-treated primary CTBs. (C) Barplot of significantly affected KEGG pathways after gene silencing of TAZ in differentiating primary CTBs. Enrichment analysis was performed using the Pathway Express algorithm. (D) Uniform Manifold Approximation and Projection analyses of single-cell (sc) nuclear RNA-seq and sc nuclear ATAC-seq data showing expression and open chromatin of WWTR1 and HLA-G in previously identified EVT clusters of first-trimester placentae (54). Please note that of all cell populations identified in the study of Ounadjela et al. only the EVT clusters are shown. The iEVT marker AOC1, encoding diamine oxidase (33, 55), is specifically expressed in EVT cluster 3 representing highly matured EVTs of the distal cell column. EVT clusters 1 and 2 depict EVT progenitors and differentiating pEVTs, respectively.
Fig. 4.
Fig. 4.
TAZ preserves EVT migration, differentiation, and survival. (A) Representative light microscopy pictures of villous explants seeded on collagen I for 24 and 72 h in the presence of VP. As control (ctrl.) Dimethyl sulfoxide (DMSO) was utilized. After whole-mount IF with TAZ antibodies two specific EVT areas of VP-treated and ctrl explants were photographed. Inset pictures with higher magnification depicting TAZ localization are shown to the Right. Scatter plot illustrates the migration distances of individual explants (ctrl., n = 27; VP, n = 24) derived from three first-trimester placentae (6th to 8th week). Each dot represents the distance between the outer rim of the migration zone and the position of the anchoring villus where EVTs detach from the column. Median values of 237 (ctrl.) and 187 (VP) measurements are shown. ****P < 0.0001. (B) Representative immunoblot (n = 3, left-hand side) depicting protein expression in lysates of EVTs, purified from villous explant cultures. Whole-mount IF pictures of explant cultures (n = 3) illustrating apoptosis in VP-treated EVTs (right-hand side). Arrowheads mark cells with high KRT18 neoepitope and low TAZ expression. (C) Representative western blot (n = 3) depicting expression of EVT- and apoptosis markers in self-renewing (stem.) and differentiating (diff.) TB-ORGs cultivated in the absence of presence of two different concentrations of VP (VP1: 0,14 µM, VP2: 0,28 µM). GAPDH was used as loading control. (D) Migration of primary EVTs through fibronectin-coated transwells. CTBs (n = 3, isolated from 3 to 4 pooled 6th- to 8th-week placentae), spontaneously differentiating into EVTs, were treated with TAZ siRNAs or ntc for 48 h before seeding on transwells. Mean values ± SD were obtained by counting five different KRT7 IF pictures, taken from the underside of membranes. Data of three individual experiments are depicted. *P < 0.05. (E) Cell tracking of TSCs that were differentiated into EVTs and incubated in parallel with ntc or TAZ-siRNAs for up to 6 d. 2D Migration was monitored for 48 h (between days 3 and 5 of differentiation) in each 25 single ntc and TAZ-siRNA-treated cells. A representative TSC experiment of n = 3 is shown. (F) Graphs show total way length and maximal distance from origin of 75 migratory TSCs derived from n = 3 cell tracking experiments. Median values are depicted. ****P < 0.0001.
Fig. 5.
Fig. 5.
TAZ inhibits EVT cell fusion. (A) Representative IF pictures showing HLA-G (Left side) and SDC1/HLA-G (Right side) expression in TB-ORGs (n = 5, prepared from single 6th- to 8th-week placentae) grown under stemness (stem.) and EVT differentiation (diff.) condition in the absence or presence of VP. Directed EVT differentiation was performed as outlined in SI Appendix, Fig. S1B. Multinuclear cells within the HLA-G+ region are encircled by dashed lines. Inset picture (i, Left side) is shown at a higher magnification. Images on the Right side depict coexpression of HLA-G and SDC1 in selected multinucleated cells (a, b) of TB-ORGs. Magnified pictures (a and b) display single stainings of HLA-G and SDC1 demonstrating their colocalization at the membrane of the syncytial-like structures. DAPI marks nuclei. CTB, cytotrophoblast; EVT, extravillous trophoblast; STB, syncytiotrophoblast; (B) Selected microscopy images of HLA-G purified primary EVTs (n = 3, 6th- to 8th-week placenta) transfected with GFP plasmids and TAZ siRNAs for 72 h as outlined in SI Appendix, Fig. S5E. Pictures were taken between 24 and 72 h. (C) Representative IF images demonstrating multinucleated GFP+ cells coexpressing the EVT marker TEAD1 in TAZ siRNA-treated (72 h) HLA-G+ cultures. The TEAD1+ syncytial-like structures coexpressed CG-β. (D) IF showing SDC1 staining in ntc and TAZ siRNA-treated HLA-G+ EVTs (Left side). For quantification (n = 3 primary EVT preparations) SDC1 intensity and area of individual multinuclear structures, containing >2 nuclei per cell, were counted. Median values are shown ***P < 0.05. (E) qPCR showing CGB, ERVW-1, and ERVFRD-1 transcript levels in HLA-G+ EVTs after incubation with ntc or TAZ siRNAs for 72 h. Mean values ± SEM of n = 5 cultures, measured in duplicates (normalized to TBP), are depicted. ****P < 0.0001; ***P < 0.0002. (F) Representative western blot (n = 4) showing secreted CG-β levels in ntc and TAZ siRNA-treated (72 h) primary EVTs. Urinary human CG (hu CG) was used as positive control.
Fig. 6.
Fig. 6.
Identification of TEAD1–TAZ targets and their roles in TAZ expression and EVT migration. (A) qPCR showing NUAK1 mRNA expression in differentiating primary CTBs after supplementation of ntc or TAZ siRNAs for 72 h. Mean values ± SEM of n = 5 cultures, measured in duplicates (normalized to TBP), are shown. ****P < 0.0001; (B) IF depicting NUAK1 expression, colocalizing with HLA-G+, in a subset of pEVTs. Representative images of early placentae (6th to 9th week, n = 3) are shown. DAPI marks nuclei. The dashed line encircles the villous core (VC). CC, cell column, S, syncytium. (C) Light microscopy images of villous explants, seeded on collagen I for 24 and 72 h in the absence (DMSO ctrl.) or presence of the NUAK inhibitor WZ4003. Scatter plot shows the migration distances (indicated by arrows) of explants at 72 h (DMSO, n = 21; WZ4003, n = 12) prepared from three first-trimester placentae (6th to 8th week). Median values of 145 (DMSO) and 66 (WZ4003) measurements are shown. ****P < 0.0001. (D) Representative whole-mount IF stainings (n = 3) illustrating the localization of TAZ and HLA-G in the DMSO and WZ4003-treated villous explants. (E) Light microscopy pictures of villous explant on collagen I, in the absence (ctrl.) or presence of 100 ng/mL human recombinant FSTL1 or FSTL3. Migration distances of cultures (ctrl, n = 36; FSTL1, n = 34; FSTL3, n = 34) prepared from three first-trimester placentae (6th week) were evaluated as mentioned above. Median values of scatter plots are based on different measures at 72 h (ctrl, n = 312; FSTL1, n = 249; FSTL3, n = 258). *P < 0.05, ****P < 0.0001.
Fig. 7.
Fig. 7.
Schematic illustration of the role of TAZ in human EVT development. The coactivator promotes EVT differentiation, suppresses EVT cell fusion, and supports EVT migration, invasion, and survival.

Similar articles

References

    1. Knöfler M., et al. , Human placenta and trophoblast development: Key molecular mechanisms and model systems. Cell Mol. Life Sci. 76, 3479–3496 (2019), 10.1007/s00018-019-03104-6. - DOI - PMC - PubMed
    1. Turco M. Y., Moffett A., Development of the human placenta. Development 146, 1–14 (2019). - PubMed
    1. Maltepe E., Fisher S. J., Placenta: The forgotten organ. Annu. Rev. Cell Dev. Biol. 31, 523–552 (2015). - PubMed
    1. James J. L., Saghian R., Perwick R., Clark A. R., Trophoblast plugs: Impact on utero-placental haemodynamics and spiral artery remodelling. Hum. Reprod. 33, 1430–1441 (2018), 10.1093/humrep/dey225. - DOI - PubMed
    1. Hamilton W. J., Boyd J. D., Development of the human placenta in the first three months of gestation. J. Anat. 94, 297–328 (1960). - PMC - PubMed

Substances

LinkOut - more resources