. 2025 Apr 14;21(4):e1012880.
doi: 10.1371/journal.pcbi.1012880. eCollection 2025 Apr.

Limitations and optimizations of cellular lineages tracking

Affiliations

Limitations and optimizations of cellular lineages tracking

Nava Leibovich et al. PLoS Comput Biol. .

Abstract

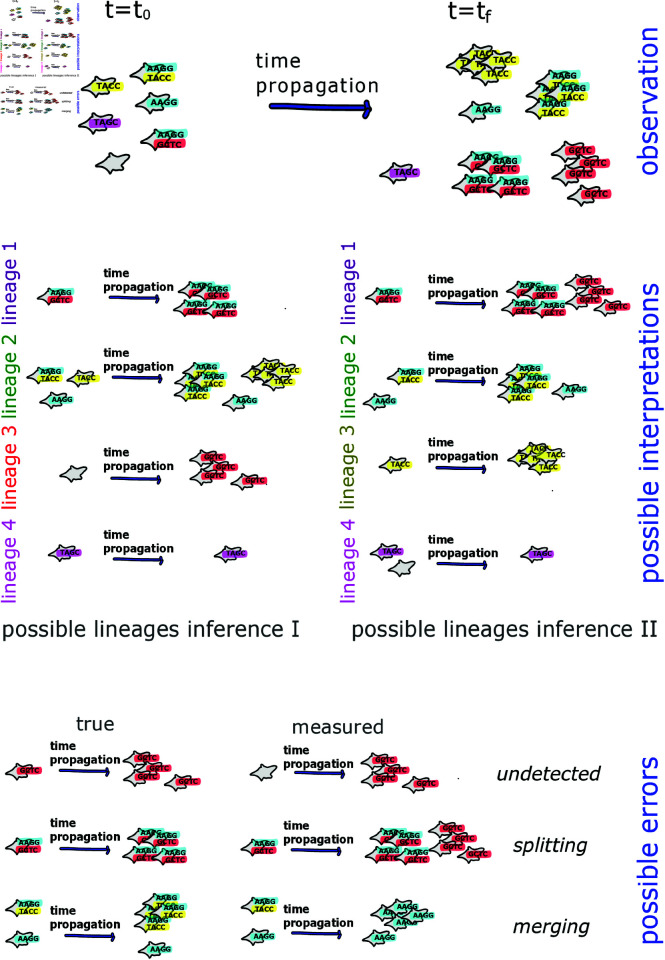
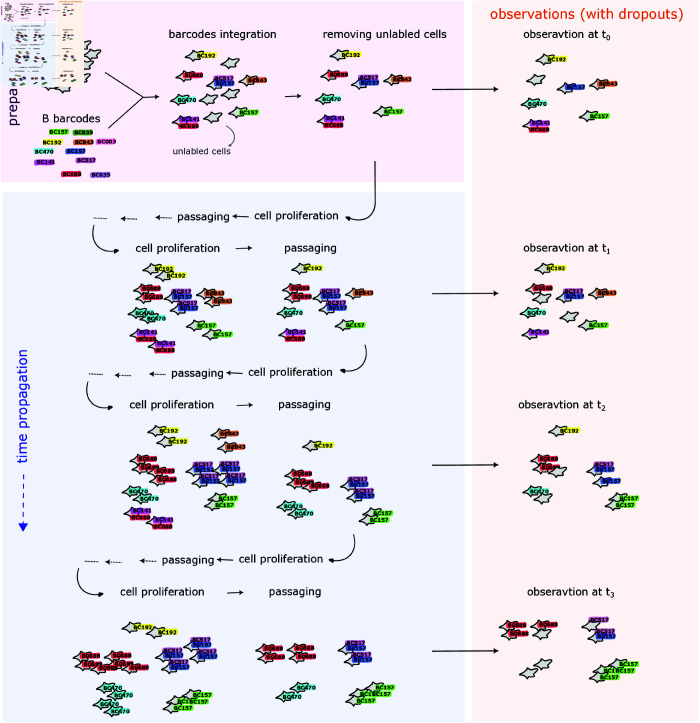
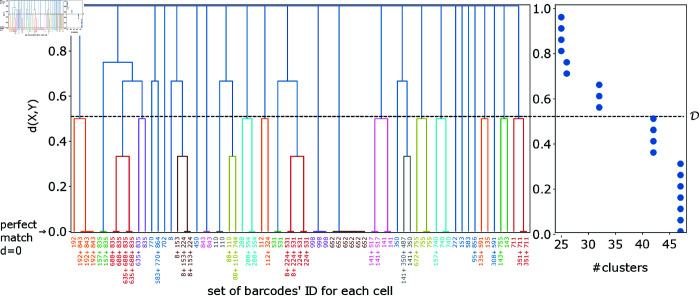
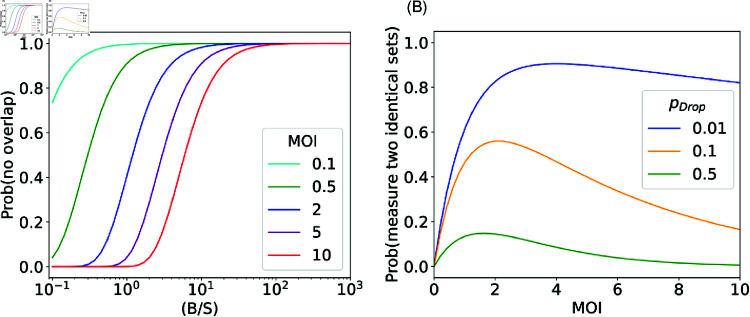
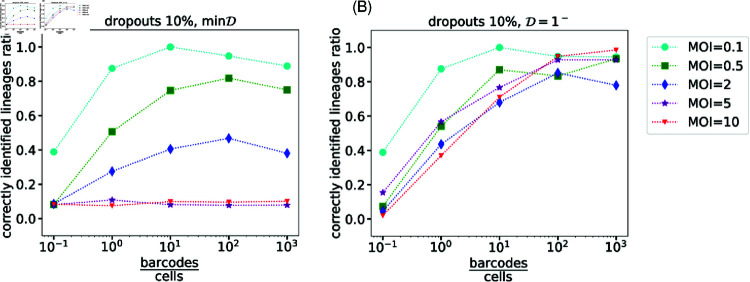
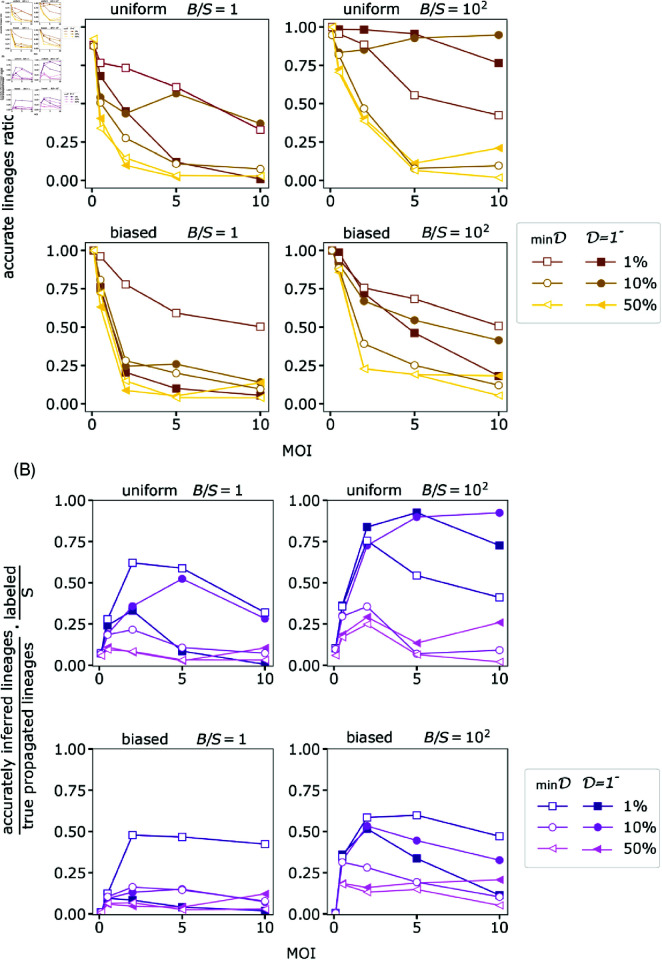
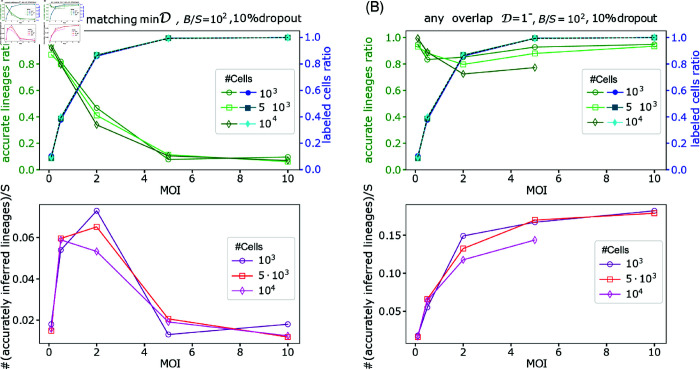
Tracking cellular lineages using genetic barcodes provides insights across biology and has become an important tool. However, barcoding strategies remain ad hoc. We show that elevating barcode insertion probability and thus increasing the average number of barcodes within the cells, adds to the number of traceable lineages but may decrease the accuracy of lineages inference due to reading errors. We establish the trade-off between accuracy in tracing lineages and the total number of traceable lineages, and find optimal experimental parameters under limited resources concerning the populations size of tracked cells and barcode pool complexity.


Conflict of interest statement

The authors have declared that no competing interests exist.

Figures

Fig 1
Fig 1. Single-cell barcoding allows tracking cell lineages with space and time.
However, dropouts of barcodes throughout the observation complicate this task, even when the seeded barcode sets are unique (upper panel). The presence of dropouts gives rise to several lineage-structure interpretations that can be inferred from the measured barcoded cells. Here we illustrate only two possibilities of lineage inference, although other lineage inferences are possible as well (middle panel). Wrongly or unidentified lineages may occur due to unmeasured barcodes in one or more snapshots, associating two lineages as a single lineage, or identifying a single lineage as two separate ones (lower panel).
Fig 2
Fig 2. Scheme of the model: Begin with S prepared cells and a barcode pool containing B unique barcodes identified by nominal numbers.
Barcodes integrate into cells based on the infection probability ps,b,In. The labeled cells undergo multiple proliferation and passaging events over time. At specific times, the clone population is observed subject to barcode reading errors governed by the dropout probability of pDrop.
Fig 3
Fig 3. An illustration for the lineages identification procedure. Left panel: Each leaf represents a cell, characterized by its measured set of barcodes, denoted as {bIn}. Each individual barcode bIn is identified and named by a unique integer number. A distance matrix d ( X , Y )  is computed for all cells to measure the dissimilarity between their barcode sets, see Eq. (6). This distance matrix is used to construct a dendrogram through agglomerative clustering. Right panel: We vary the threshold and count the number of inferred clusters. That value determines the required matching threshold for the lineages’ construction. Note that the data and threshold values shown in this illustration are for demonstration and visualization purposes only. The presented data set is truncated and small, whereas the actual systems examined in the manuscript involve thousands of cells.
Fig 4
Fig 4. Analytic examination of the uniform integration model.
(A) the probability of no overlapping between barcode sets follows Eq. (7). (B) the probability that two barcode sets are measured exactly the same after dropout events, following Eq. (9).
Fig 5
Fig 5. The dependence of barcode library complexity.
We have examined the barcodes’ pool complexity using two lineages-construction approaches - minD and D=1 [panels (A) and (B) respectively]. Simulations suggest that increasing the diversity of potential seeded barcodes up to some complexity indeed implies improvements in the lineage tracking quality. Yet, saturation in the lineage tracking quality emerges beyond that required complexity, regardless of the lineages’ deduction strategies we examined. Here the number of cells is S=103 with 10% dropouts.
Fig 6
Fig 6. The dependence of MOI.
(A) The accurately identified lineages ratio versus the MOI for various system features. The ratio is defined by the number of accurately inferred lineages over the number of true propagated lineages. (B) The percentage of accurately identified propagated lineages times the percent of labeled cells. For both panels, we present simulation results for diversities B ∕ S = 1 and BS=102 (left and right columns respectively), the uniform and biased integration (upper and lower rows correspondingly). We also examine the two lineages reconstruction strategies with a minimal dissimilarity matching D = minD (empty markers) and D=1 (full markers).
Fig 7
Fig 7. The dependence of MOI on the percentages of labeled cells and accurately identified lineages.
Increasing the MOI results in increasing the number of infected cells (upper panels, blue shades, full markers), while the ratio of accurately identified lineages may decrease, depending on the system properties and the analysis strategy - minimal matching threshold D = minD and any non-zero overlap D=1 (green shades, open markers, shown in upper-left and upper-right panels correspondingly). Lower row: The ratio of lineages accurately observed. We show simulation results for D = minD (lower-left panel) and D=1 (lower-right panel). In here we use the number of cells as S=103,5103,104, and the number of barcodes is 100-fold larger than the initial number of cells with 10% dropouts.

Similar articles

Cited by

References

    1. Woodworth MB, Girskis KM, Walsh CA. Building a lineage from single cells: genetic techniques for cell lineage tracking. Nat Rev Genet 2017;18(4):230–44. doi: 10.1038/nrg.2016.159 - DOI - PMC - PubMed
    1. Kebschull JM, Zador AM. Cellular barcoding: lineage tracing, screening and beyond. Nat Methods 2018;15(11):871–9. doi: 10.1038/s41592-018-0185-x - DOI - PubMed
    1. Schepers K, Swart E, van Heijst JW, Gerlach C, Castrucci M, Sie D, et al.. Dissecting T cell lineage relationships by cellular barcoding. J Exp Med 2008;205(10):2309–18. doi: 10.1084/jem.20072462 - DOI - PMC - PubMed
    1. Gerrits A, Dykstra B, Kalmykowa OJ, Klauke K, Verovskaya E, Broekhuis MJ, et al.. Cellular barcoding tool for clonal analysis in the hematopoietic system. Blood 2010;115(13):2610–8. doi: 10.1182/blood-2009-06-229757 - DOI - PubMed
    1. Lu R, Neff NF, Quake SR, Weissman IL. Tracking single hematopoietic stem cells in vivo using high-throughput sequencing in conjunction with viral genetic barcoding. Nat Biotechnol 2011;29(10):928–33. doi: 10.1038/nbt.1977 - DOI - PMC - PubMed

LinkOut - more resources