. 2025 Apr 13:80:100641.
doi: 10.1016/j.clinsp.2025.100641. eCollection 2025.

The supramolecular polymer-related signature predicts prognosis and indicates immune microenvironment infiltration in gastric cancer

Affiliations

The supramolecular polymer-related signature predicts prognosis and indicates immune microenvironment infiltration in gastric cancer

Yan Liu et al. Clinics (Sao Paulo). .

Abstract

Background: Gastric Cancer (GC) remains a leading global cause of cancer mortality, underscoring the urgent need for advanced prognostic tools. This study aimed to construct and evaluate a prognostic risk signature based on Supramolecular Polymer-Related Genes (SPRGs) in gastric cancer.

Methods: The authors downloaded data from TCGA-STAD, GEO, and CCLE databases for patients with GC and validation cohorts. Through consensus clustering, Cox proportional hazards models, LASSO Cox regression, and nomogram development, the authors identified and constructed a GC Prognostic risk Index (SPI). Additionally, the authors conducted drug sensitivity analysis and immune landscape assessment. Functional evaluations were conducted through colony formation, transwell invasion, and wound healing assays.

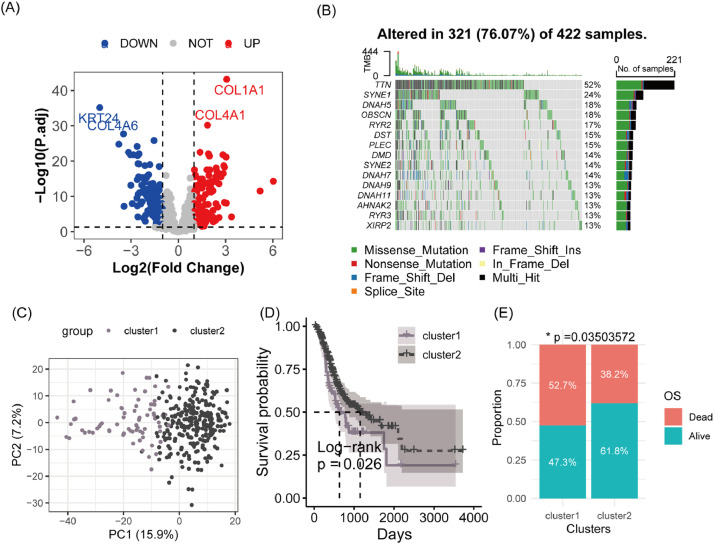
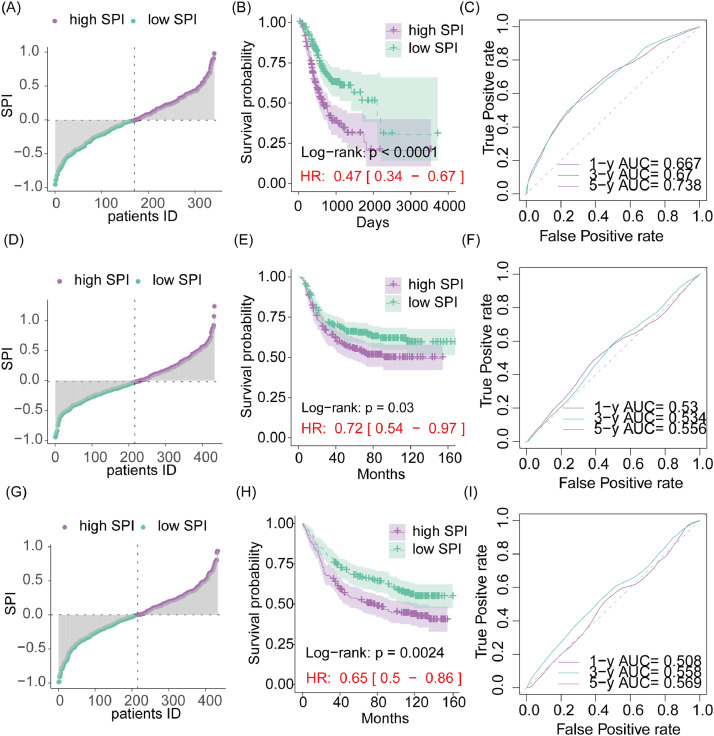
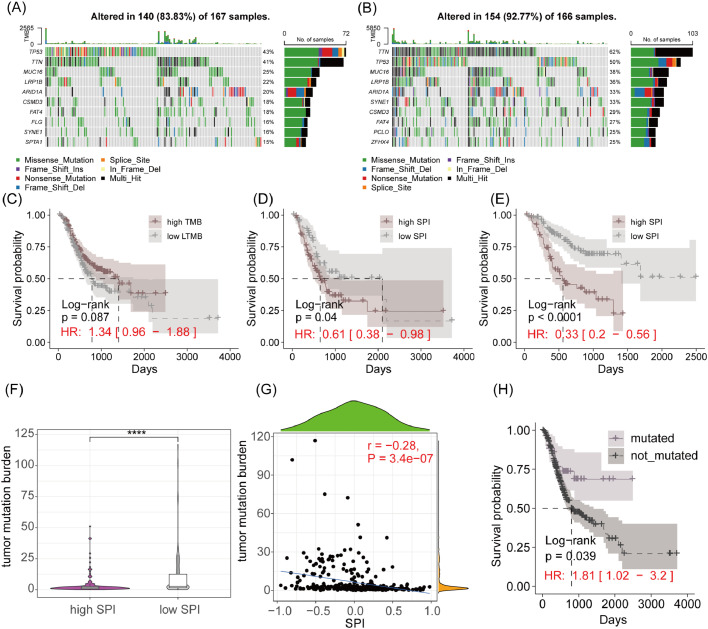
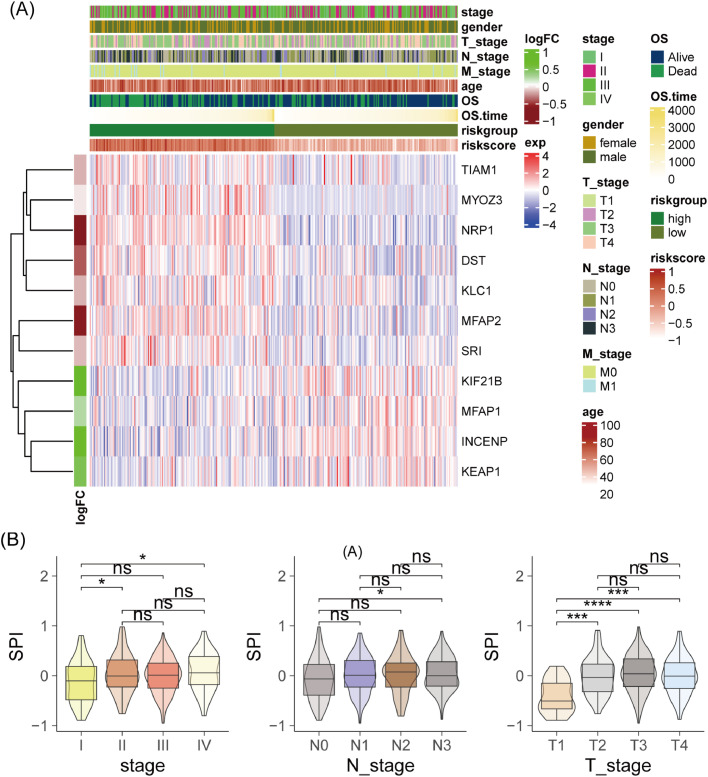
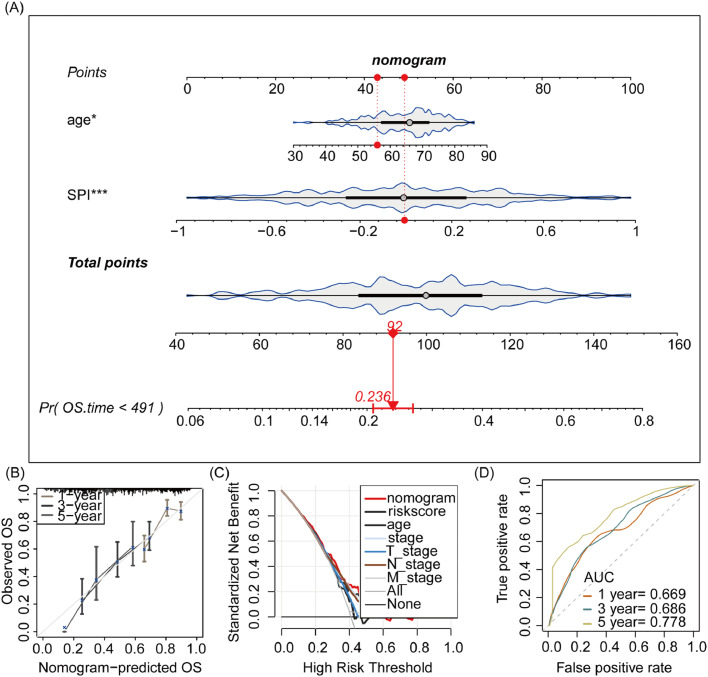
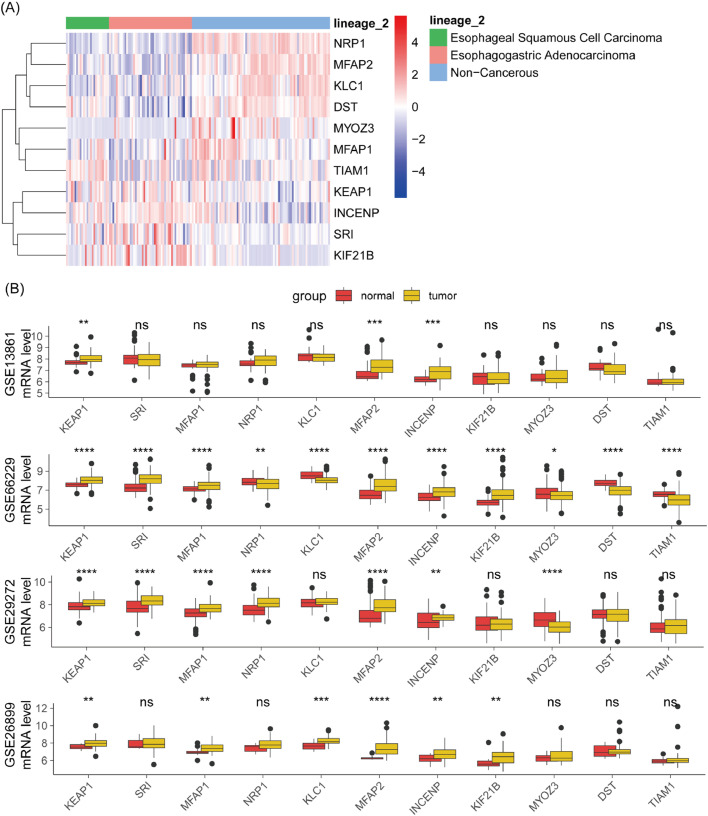
Results: The authors identified that 182 SPRGs were significantly upregulated and 226 were downregulated in gastric cancer. Consensus clustering revealed two molecular subtypes, with cluster 1 having significantly lower overall survival compared to cluster 2. SPI effectively distinguished high-risk and low-risk patients across all cohorts. Furthermore, SPI was associated with tumor stage, lymph node metastasis, and tumor size, and could predict drug sensitivity in GC patients. Immune landscape analysis showed higher infiltration of naïve B cells, M2 macrophages, and activated NK cells in high-SPI patients. A nomogram model for GC prognosis using SPI and patient age was developed. KLC1 knockdown significantly suppressed GC cell proliferation, while markedly attenuating metastatic potential and invasion capacity.

Conclusion: This study constructed a prognostic risk signature based on SPRGs in gastric cancer, which is closely related to clinical pathological features, drug sensitivity, and immune landscape, providing new insights for personalized treatment.

Keywords: Gastric cancer; Immune landscape; LASSO; Nomogram; Supramolecular polymer.


Conflict of interest statement

Conflicts of interest The authors declare no conflicts of interest.

Figures

Fig. 1
Fig. 1
Analysis of molecular heterogeneity of gastric cancer associated with SPRGs. (A) Volcano plot of differential expression of SPRGs in the TCGA-STAD cohort. This plot highlights genes that are significantly up- or downregulated. (B) Somatic mutation characteristics of SPRGs in the TCGA-STAD cohort. A summary of the mutation frequencies and types observed in SPRGs. (C) Principal Component Analysis (PCA) plot comparing cluster 1 and cluster 2 subtypes. PCA is used to visualize the variance between the two clusters. (D) Kaplan-Meier survival curves for cluster 1 and cluster 2. These curves compare the overall survival between the identified molecular subtypes. (E) Comparison of survival outcomes between cluster 1 and cluster 2 subtypes. Statistical analysis demonstrating differences in patient outcomes between the two clusters.
Fig. 2
Fig. 2
Risk signature constructed by lasso cox regression using SPRGs for gastric cancer patients. (A) Stratification of the TCGA-STAD cohort according to risk score. Patients are divided into high-risk and low-risk groups based on their risk scores. (B) Kaplan-Meier survival curve analysis between groups. Comparison of survival outcomes between the high-risk and low-risk groups. (C) Receiver Operating Characteristic (ROC) analysis of the risk score. Evaluation of the predictive accuracy of the risk score for overall survival. (D‒F) Similar analyses as (A‒C) but performed on the GSE26253 and GSE84437 cohorts.
Fig. 3
Fig. 3
Gene expression patterns driven by the SPRGs-related risk signature. (A) Gene Set Enrichment Analysis (GSEA) plot. It displays the enrichment scores of various Hallmark gene sets in gastric cancer. (B) Volcano plot of differential gene expression. This plot identifies genes that are significantly differentially expressed between high-risk and low-risk groups. (C) Bubble chart of pathway enrichment analysis. It visualizes the pathways enriched among differentially expressed genes. (D) Bubble chart of GO enrichment analysis. It presents the Gene Ontology terms enriched among differentially expressed genes.
Fig. 4
Fig. 4
Somatic mutation landscape associated with risk scores. (A‒B) Top 10 Most Mutated Genes in High-Risk and Low-Risk Groups. Bar plots showing the frequency of mutations in the top 10 genes for each group. (C) Kaplan-Meier Survival curve analysis between high and low Tumor Mutational Burden (TMB) Groups. Comparison of survival outcomes based on TMB levels. (D‒E) Kaplan-Meier survival curve analysis within high and low TMB groups. Further stratification of survival outcomes within each TMB category by risk score. (F) Comparison of TMB differences between high-risk and low-risk groups. Box plot illustrating the distribution of TMB in the two risk groups. (G) Pearson correlation analysis between risk score and TMB. Scatter plot showing the relationship between the risk score and TMB. (H) Kaplan-Meier survival curve analysis for mutated vs. Non-mutated NRXN1 gene. Comparison of survival outcomes based on the mutation status of a specific gene. **** p < 0.0001.
Fig. 5
Fig. 5
Correlation analysis between risk score and clinicopathological features. (A) Heatmap of SPRG expression related to risk score. Visualization of the expression patterns of SPRGs associated with the risk score. (B) Comparison of risk scores among different stages, N Stages, and T Stages. Box plots showing the distribution of risk scores across various clinical stages. ns, not significant; * p < 0.05; *** p < 0.001; **** p < 0.0001.
Fig. 6
Fig. 6
Indication of drug sensitivity by risk score in gastric cancer patients. (A) Comparison of chemotherapy drug sensitivity between high-risk and low-risk groups in the TCGA-STAD cohort. Bar plots representing the IC50 values or other measures of drug sensitivity. (B) Correlation between drug sensitivity and risk score. Scatter plot or correlation matrix illustrating the association between drug sensitivity and the risk score. ns, not significant; * p < 0.05; ** p < 0.01; *** p < 0.001; **** p < 0.0001.
Fig. 7
Fig. 7
Association between risk score and tumor immune landscape. (A) Comparison of immune cell infiltration between high-risk and low-risk groups in the TCGA-STAD cohort. Violin or box plots showing the infiltration levels of immune cells. (B) Pearson correlation analysis between SPRG expression and immune cell infiltration. Scatter plots or heatmaps showing the correlation between SPRG expression and immune cell infiltration. (C) Pearson correlation analysis between risk score and immune cell infiltration. Similar to (B), but focusing on the risk score instead of individual SPRGs. (D‒G) Comparison of stromal score, immune score, ESTIMATE score, and tumor purity between high-risk and low-risk groups. Box plots displaying the distribution of these metrics in the two risk groups. ns, not significant; * p < 0.05; ** p < 0.01; *** p < 0.001; **** p < 0.0001.
Fig. 8
Fig. 8
Construction of a nomogram integrating risk score and age for predicting overall survival in gastric cancer patients. (A) Nomogram. A graphical tool integrating SPI and age to estimate the probability of overall survival. (B) Calibration plot. Assessment of the nomogram's accuracy in predicting survival probabilities against observed survival rates. (C) Decision curve analysis. Evaluation of the clinical utility of the nomogram by comparing the net benefit of using the model for different threshold probabilities of high-risk classification. (D) Receiver Operating Characteristic (ROC) curve. Display of the diagnostic ability of the nomogram for 1-, 3-, and 5-year overall survival.
Fig. 9
Fig. 9
Validation of SPRG expression associated with risk score. (A) Heatmap of gene expression in esophageal-related cancers and non-cancerous cells from the CCLE database. Visualization of the expression levels of SPRGs in cancer versus normal cells. (B) Comparison of SPRG expression between tumor and normal tissues in the validation cohort. Box plots showing the expression levels of SPRGs in tumor versus adjacent normal tissues. Ns, Not significant; * p < 0.05; ** p < 0.01; *** p < 0.001, **** p < 0.0001.
Fig. 10
Fig. 10
Biological function of KLC1 in GC cells. (A) Comparison of the mRNA level of KLC1 between the MKN45 and normal cell. (B) Comparison of the relative mRNA.level between the control and siKLC1 group. (C) Western blot analysis showing the protein expression levels of KLC1 and GAPDH (loading control) in control and siKLC1 groups. The protein level of KLC1 is reduced in the siKLC1 group. (D) Representative images of crystal violet-stained cell invasion assays for control and siKLC1 groups. Cells were stained blue, indicating invasive capacity. (E) Quantification of relative invasion rates between control and siKLC1 groups. The invasion rate is significantly lower in the siKLC1 group. (F) Colony formation assay showing the number of colonies formed by control and siKLC1 groups. Fewer colonies are observed in the siKLC1 group. (G) Quantification of relative colony numbers between control and siKLC1 groups. The number of colonies is significantly reduced in the siKLC1 group. (H) Wound healing assay images at 0 h and 24 h post-wounding for control and siKLC1 groups. The wound closure is slower in the siKLC1 group. (I) Quantification of relative wound closure between control and siKLC1 groups. The wound closure rate is significantly lower in the siKLC1 group. ** p < 0.01.

Similar articles

References

    1. Siegel R.L., Giaquinto A.N., Jemal A. Cancer statistics, 2024. CA Cancer J Clin. 2024;74(1):12–49. - PubMed
    1. Sexton R.E., Al H.M., Diab M., Azmi A.S. Gastric cancer: a comprehensive review of current and future treatment strategies. Cancer Metastasis Rev. 2020;39(4):1179–1203. - PMC - PubMed
    1. Comprehensive molecular characterization of gastric adenocarcinoma. Nature. 2014;513(7517):202–209. - PMC - PubMed
    1. Chen Y.C., Fang W.L., Wang R.F., Liu C.A., Yang M.H., Lo S.S., et al. Clinicopathological variation of Lauren classification in gastric cancer. Pathol Oncol Res. 2016;22(1):197–202. - PubMed
    1. Luo Y., Gao P., Song Y., Sun J., Huang X., Zhao J., et al. Clinicopathologic characteristics and prognosis of Borrmann type IV gastric cancer: a meta-analysis. World J Surg Oncol. 2016;14(1):49. - PMC - PubMed

LinkOut - more resources