. 2025 Apr 14;8(7):e202503222.
doi: 10.26508/lsa.202503222. Print 2025 Jul.

STAT5B leukemic mutations, altering SH2 tyrosine 665, have opposing impacts on immune gene programs

Affiliations

STAT5B leukemic mutations, altering SH2 tyrosine 665, have opposing impacts on immune gene programs

Hye Kyung Lee et al. Life Sci Alliance. .

Abstract

STAT5B is a vital transcription factor for lymphocytes. Here, the function of two STAT5B mutations from human T-cell leukemias: one substituting tyrosine 665 with phenylalanine (STAT5BY665F) and the other with histidine (STAT5BY665H), was interrogated. In silico modeling predicted divergent energetic effects on homodimerization with a range of pathogenicity. In primary T cells in vitro, STAT5BY665F showed gain-of-function, whereas STAT5BY665H demonstrated loss-of-function. Introducing the mutation into the mouse genome illustrated that the gain-of-function Stat5b Y665F mutation resulted in accumulation of CD8+ effector and memory and CD4+ regulatory T cells, altering CD8+/CD4+ ratios. In contrast, STAT5BY665H "knock-in" mice showed diminished CD8+ effector and memory and CD4+ regulatory T cells. In contrast to WT STAT5B, the STAT5BY665F variant displayed greater STAT5 phosphorylation, DNA binding, and transcriptional activity after cytokine activation, whereas the STAT5BY665H variant resembled a null. The work exemplifies how joining in silico and in vivo studies of single nucleotides deepens our understanding of disease-associated variants, revealing structural determinants of altered function, defining mechanistic roles, and, specifically here, identifying a gain-of-function variant that does not directly induce hematopoietic malignancy.


Conflict of interest statement

The authors declare that they have no conflict of interest.

Figures

Figure 1.
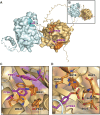
Figure 1.. STAT5B SH2 dimerization modeled by AlphaFold3.
(A) Schematic of human STAT5B protein domains showing the locations of tyrosine 665 (Y665) and phospho-tyrosine 699 (pY699). (B) Structure of the human STAT5B SH2 homodimer generated by AlphaFold3. Binding pockets of key residues pY699 (blue) and F711 (red) are indicated. The STAT5B model shows the hydrophobic binding pocket containing the key residue Y665 (magenta). (C) Structure of the human STAT5B SH2 homodimer generated by AlphaFold3 with residues colored red relative to their importance to the binding interface as predicted by COORDinator. (D) Structure of the human STAT5B SH2 monomer in its dimeric conformation generated by AlphaFold3 with residues colored red relative to their importance to stabilization of the C-terminal tail as predicted by COORDinator. (E) Model of the human STAT5B SH2 homodimer with tyrosine, histidine, or phenylalanine at position 665, as predicted by AlphaFold3. (F) STAT5B model highlights the intramolecular interaction between F711 and the hydrophobic binding pocket containing the key residue Y665. (G) Comparison of the predicted energetic consequences of the F711A, Y665F, and Y665H mutations on stabilization of the C-terminal tail. Relative mutational effects are annotated using ∆∆G, in arbitrary units; stabilizing mutations have a negative value, and destabilizing mutations have a positive value.
Figure S1.
Figure S1.. Conservation of STAT5B amino acids between multiple species.
Table presenting amino acid sequences surrounding the conserved tyrosine (Y) residue in the STAT5B SH2 domain (indicated by center box outlined in red) in 26 vertebrate species.
Figure S2.
Figure S2.. STAT5 SH2 dimerization modeled by AlphaFold3.
(A) Structure of the human STAT5A SH2 homodimer generated by AlphaFold3. Binding pockets of key residues phospho-Tyr694 and Phe706 (purple), which are structurally analogous to phosphor-Tyr699 and Phe711 in STAT5B, are indicated. (B) Structure of the human STAT5B SH2 homodimer generated by AlphaFold3, which closely resembles the dimer interface modeled for the STAT5A homodimer. (C) STAT5A model highlights the intramolecular interaction between Phe706 (purple) and the hydrophobic binding pocket (orange) containing the key residue Tyr665 (purple). (D) STAT5A model highlights the canonical SH2 docking interaction between the phospho-Tyr694 (purple) of the STAT5A C-terminal tail and the canonical SH2 binding pocket of a second STAT5A (orange).
Figure S3.
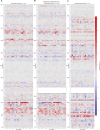
Figure S3.. Energetic contributions of STAT5 SH2 domain residues to dimerization and intramolecular interactions as predicted by COORDinator.
Heatmaps depicting the energetic consequences of amino acid substitutions at each residue as predicted by COORDinator using AlphaFold3-generated structures. Relative mutational effects are annotated using arbitrary units with stabilizing mutations (−∆∆G) depicted in blue and destabilizing mutations depicted in red (+∆∆G). The intensity of the color corresponds to the extent of the change. Values for STAT5ApY694 and STAT5BpY699 are not included because of the inability of COORDinator to model posttranslational modifications. (A) Energetic contributions of STAT5B residues to SH2 homodimerization. (B) Energetic contributions of STAT5A residues to SH2 homodimerization. Residues 688–692 are not present in STAT5A. (C) Energetic contributions of STAT5B residues to interaction with the C-terminal tail, when the tail is modeled as a separate chain. Residues 688–692 were not modeled to ensure the tail is properly seen by the model as a separate chain.
Figure 2.
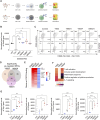
Figure 2.. Transcriptomes activated by WT and STAT5B mutations in Stat5a/b-null T cells.
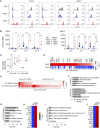
(A) Schematic of the experimental approach to assess the impact of STAT5BY665 mutations on naïve CD4 T cells from lymph nodes and spleens of WT or STAT5A/B-deficient mice. (B) Normalized read counts (TPM, tags per million) of the Stat5b gene in WT and Stat5a/b KO T cells transduced with a control (Con) retroviral vector or vectors encoding STAT5B, WT Y665, Y665F, Y665H, and N624H, evaluated by RNA-seq. (C) Representative flow cytometry contour plots showing CD4+ cell population (n = 3). (D) Venn diagram displaying the number of significantly induced genes by retroviral vectors encoding Y665F, Y665H, and N642H mutations compared with WT evaluated using RNA-seq. Cells were stimulated with IL-2 (n = 3). (E) Heatmaps showing fold changes of significantly up-regulated genes between N642H, Y665F, and Y665H on Stat5b (Y665) as 1 in STAT5A/B-deficient T cells. (F) Heatmap of genes expressed at significantly higher levels in each sample and significantly enriched in Gene Ontology (GO) terms. (G) Dot plots of the normalized read counts (TPM) for mRNA levels of five genes regulated by STAT5B. Results are shown as the means ± SEM of independent biological replicates. P-values are from one-way ANOVA with Tukey’s multiple comparisons test. *P < 0.05, **P < 0.01, ***P < 0.0001, ****P < 0.0001.
Figure 3.
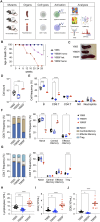
Figure 3.. Altered T-cell distribution in spleens of Stat5b mutant mice.
(A) Schematic illustration of the experimental approach. The Stat5bY665 variants were introduced into the mouse genome, and T cells and stem cells from immune system organs. Intact or cytokine-stimulated cells were subjected to Western blot, RNA-seq, scRNA-seq, FACS, and ChIP-seq analyses. (B) Kaplan–Meier curves exhibiting the age of death. Y665, n = 101; Y665H, n = 187; Y665F+/−, n = 217; Y665F−/−, n = 46. (C) Images of spleens from WT and mutant mice. (D) Box plots showing the total cell number in spleen from WT and mutant mice analyzed via flow cytometry (Y665, n = 8; Y665H, n = 5; Y665F, n = 3). P-values are from one-way ANOVA with Tukey’s multiple comparisons test. Median, middle bar inside the box; IQR, 50% of the data; whiskers, 1.5 times the IQR. (E) Percentages of B cells, CD4 T cells, CD8 T cells, NK cells, and neutrophils were calculated using FACS. (F, G) Percentages of CD8 and CD4 subpopulations. P-values are from two-way ANOVA with Tukey’s multiple comparisons test. *P < 0.05, **P < 0.01, ***P < 0.0001, ****P < 0.0001. (H) Total lymphocyte counts in peripheral blood from 7 to 10-wk-old adult WT and mutant mice. Results are shown as the median of independent biological replicates (Y665, n = 25; Y665H, n = 24; Y665F, n = 16). (I, J) Numbers of CD4+ and CD8+ T cells identified by flow cytometry. Results are shown as the median of independent biological replicates. Statistical significance was assessed using one-way ANOVA followed by Tukey’s multiple comparisons test.
Figure S4.
Figure S4.. Gating strategy and representative FACS plots for
Fig 5.(A) Gating strategy of immune populations in the spleen for plots in Fig 3. All populations were gated from singlet, live, and CD45+ cells. Neutrophils are Ly6G+. NK cells are Ly6G− TCRβ− CD19− NK1.1+. CD8 T cells are Ly6G− TCRβ+ CD8α+ CD4−. CD4 T cells are Ly6G− TCRβ+ CD8α− CD4+. Tregs are Foxp3+ CD4 T cells. CD8 T-cell and CD4 T-cell subsets were identified by CD62L versus CD44 expression as follows: naïve are CD62L+ CD44−, central memory are CD62L+ CD44+, and effector memory are CD62L− CD44+. (A, B) Representative FACS plots for populations identified in (A) for Y665, Y665H, and Y665F mice. Plot titles represent the population from which the plots are gated from.
Figure S5.
Figure S5.. Hematological parameters and altered immune phenotypes of Stat5b mutant mice.
(A, B, C, D, E, F, G) Count of blood cells in peripheral blood from 7- to 10-wk-old adult WT and mutant mice. (A, B, C, D, E, F, G) Count of white blood cells (A), red blood cells (B), platelets (C), neutrophils (D), monocytes (E), eosinophils (F), and basophils (G). Results are shown as the median of independent biological replicates (Y665, n = 25; Y665H, n = 24; Y665F, n = 16). P-values are from two-way ANOVA with Tukey’s multiple comparisons test. *P < 0.05, **P < 0.01, ***P < 0.0001, ****P < 0.0001.
Figure S6.
Figure S6.. Hematological parameters and altered immune phenotypes of Stat5b mutant mice.
(A, B, C, D, E, F, G, H) Count of blood cells in peripheral blood from 11-mo-old adult WT and mutant mice. Results are shown as the median of independent biological replicates (Y665, n = 12; Y665H, n = 5; Y665F, n = 14). (I, J) Numbers of subpopulation of immune cells identified by flow cytometry. Results are shown as the median of independent biological replicates (n = 5). Statistical significance was assessed using one-way ANOVA followed by Tukey’s multiple comparisons test.
Figure 4.
Figure 4.. Immune dynamics in spleen analyzed using scRNA-seq.
(A) Uniform Manifold Approximation and Projection graph of scRNA-seq data from lymph nodes of WT and mutant mice, colored by cell population (n = 1 combined sample from three mice of each group). (B) Heatmap of cell population. (C) Frequencies of CD8 subtypes: Tcm (central memory T cells), Tem (effector memory T cells), and NKT (NK-like T cells). (D) Dot plot of differentially expressed genes related to cytokine signaling and T-cell activation in CD8 T-cell subsets. (E) Frequencies of CD4 subtypes: TRM (tissue-resident memory T cells), Th (helper T cells), and Treg (regulatory T cells). (F, G) Categorical scatter plot of relative gene expression values of differentially expressed genes related to homeostasis (F) and inflammatory response (G) in regulatory CD4 T-cell subpopulations.
Figure 5.
Figure 5.. Opposing transcriptional activity of STAT5BY665F and STAT5BY665H at steady-state levels.
(A) Representative histograms of the flow cytometry analyses (FACS) of phosphorylated STAT5 (pY-STAT5) in CD4+ and CD8+ T cells from Stat5bY665 (Y665), and Stat5bY665H (Y665H) and Stat5bY665F (Y665F) mice after interleukin (IL)-2, IL-7, and IL-15 in vitro stimulation compared with no cytokine (NC) controls. (B) Dot blot graphs showing quantification of phospho-STAT5 levels in CD4+ and CD8+ T cells from multiple mice of each genotype from FACS (Y665, n = 8; Y665H, n = 6; Y665F, n = 3). MFI, median fluorescence intensity. P-values are derived from two-way ANOVA with Tukey’s multiple comparisons test. **P < 0.01, ***P < 0.0001, ****P < 0.0001. (C) Normalized read counts (TPM, tags per million) of interleukin-2 receptor subunit alpha (Il2ra), interleukin-2 receptor subunit beta (Il2rb), interleukin-17 receptor A (Il17r), interleukin-15 receptor subunit alpha (Il15ra), and interleukin-2 receptor subunit gamma (Il2rg) expression levels evaluated by RNA-seq in T cells from Stat5bY665 (Y665), Stat5bY665H (Y665H), and Stat5bY665F (Y665F) mice in the absence of in vitro cytokine stimulation. (D) Heatmaps depicting fold changes of significantly differentially regulated genes from Stat5bY665F and Stat5bY665H mice. (E) Heatmaps depicting fold changes of significantly differentially up-regulated and enriched genes that demonstrate STAT5 binding on their regulatory elements from unstimulated or stimulated T cells from Stat5bY665 WT and Stat5bY665F mutant mice (IL-2/7–stimulated Y665, n = 4; IL-2/7–stimulated Y665F, n = 4; IL-2/7–stimulated Y665F, n = 3). (F) Gene categories expressed at significantly higher levels from genes that demonstrate STAT5 binding on their regulatory elements in stimulated T cells from STAT5BY665F mice as compared to Stat5bY665 mice. (G, H) Gene categories expressed at significantly higher levels from genes that demonstrate STAT5 binding on their regulatory elements in STAT5BY665H mice as compared to STAT5BY665F mice. (I, J) Gene categories significantly differentially up-regulated and enriched genes related to T-cell activation and apoptosis in STAT5BY665H as compared to STAT5BY665F mice (Y665H, n = 5; Y665F, n = 7).
Figure 6.
Figure 6.. Inverse impact of STAT5BY665F and STAT5BY665H on the establishment of transcription enhancers and immune programs.
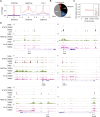
(A) Coverage plots displaying the patterns of STAT5B binding, H3K27ac marks, and Pol II loading on promoters of genes with or without STAT5B binding (blue, Y665H; red, Y665F; n = 2–3). (B) Distribution of STAT5B binding peaks across genomic regions. ChIP-seq signals within ± 3kbp of STAT5B binding regions identified in IL-2/IL-7–stimulated T cells of Y665F mice shown as pie chart. (C) Enhancer cluster analysis using IL-2/7–stimulated T cells of Y665F mice. The y-axis indicates the normalized peak score (enhancer cluster score) of STAT5B binding, whereas the x-axis represents the ranking of peaks. No enhancer clusters were identified in Y665H mice. (D) STAT5B binding, H3K27ac, and Pol II loading at regulatory elements of the interleukin-2 receptor subunit alpha (Il2ra), cytokine-inducible SH2–containing protein (Cish), cd8 subunit alpha (Cd8a), interleukin-18 receptor 1 (Il18r1), interleukin-2 receptor subunit beta (Il2rb), and suppressor of cytokine signaling 2 (Socs2) genes in IL-2/7–stimulated T cells from Y665, Y665H, and Y665F mice.
Figure 7.
Figure 7.. Hematopoietic stem and progenitor cells in the bone marrow of Stat5b mutant mice.
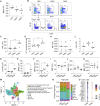
(A) Dot plot graph of total numbers of BM cells in Stat5bY665, Stat5bY665F, and Stat5bY665H mice. (B) Representative flow cytometry plots of myeloid progenitors (Lin-CD117+Sca-1), Lin-Sca-1+CD117+ cells (KSL), and KSL subpopulations. (C) Dot plot graph of absolute numbers of KSL (Lin-Sca-1+CD117+) cells. (D) Dot plot graph of absolute numbers of long-term hematopoietic stem (CD150+CD48 KSL) cells. (E) Dot plot graph of absolute numbers of multipotent progenitor 2 (CD150+CD48+ KSL) cells. (F) Dot plot graph of absolute numbers of multipotent progenitor 3/4 (CD150CD48+ KSL) cells. (G) Dot plot graph of colony-forming cell numbers per 20,000 BM cells. (H) Dot plot graph of absolute numbers of myeloid progenitor cells. (I) Dot plot graph of absolute numbers of common myeloid progenitor cells. (J) Dot plot graph of absolute numbers of granulocyte–monocyte progenitor cells. (K) Dot plot graph of absolute numbers of megakaryocytic erythroid progenitor cells. (L) Dot plot graph of absolute numbers of common lymphoid progenitor cells. (M) Uniform Manifold Approximation and Projection graph of the cell types identified from all three genotypes using single-cell sequencing. (N) Bar graphs of the cluster frequency of the different cell types identified in the bone marrow of Stat5bY665, Stat5bY665F, and Stat5bY665H mice using single-cell sequencing. (O) Categorical scatter plot of relative gene expression values of representative genes from Gene Ontology (GO) category hematopoiesis stem cells in Stat5bY665F and Stat5bY665H mice. (C, D, E, F, G, H, I, J, K, L) Median of independent biological replicates shown as a horizontal line in panels (C, D, E, F, G, H, I, J, K, L) (Stat5bY665, n = 5; Stat5bY665F, n = 5; Stat5bY665H, n = 5). A one-way ANOVA followed by Tukey’s multiple comparisons test was used to evaluate the statistical significance of differences between groups. *P < 0.05, **P < 0.01, ***P < 0.0001, ****P < 0.0001.

Update of

References

    1. Abramson J, Adler J, Dunger J, Evans R, Green T, Pritzel A, Ronneberger O, Willmore L, Ballard AJ, Bambrick J, et al. (2024) Accurate structure prediction of biomolecular interactions with AlphaFold 3. Nature 630: 493–500. 10.1038/s41586-024-07487-w - DOI - PMC - PubMed
    1. Adzhubei I, Jordan DM, Sunyaev SR (2013) Predicting functional effect of human missense mutations using PolyPhen-2. Curr Protoc Hum Genet Chapter 7: Unit7 20. 10.1002/0471142905.hg0720s76 - DOI - PMC - PubMed
    1. Anders S, Pyl PT, Huber W (2015) HTSeq-a Python framework to work with high-throughput sequencing data. Bioinformatics 31: 166–169. 10.1093/bioinformatics/btu638 - DOI - PMC - PubMed
    1. Andersson EI, Tanahashi T, Sekiguchi N, Gasparini VR, Bortoluzzi S, Kawakami T, Matsuda K, Mitsui T, Eldfors S, Bortoluzzi S, et al. (2016) High incidence of activating STAT5B mutations in CD4-positive T-cell large granular lymphocyte leukemia. Blood 128: 2465–2468. 10.1182/blood-2016-06-724856 - DOI - PMC - PubMed
    1. Azam M, Erdjument-Bromage H, Kreider BL, Xia M, Quelle F, Basu R, Saris C, Tempst P, Ihle JN, Schindler C (1995) Interleukin-3 signals through multiple isoforms of Stat5. Embo J 14: 1402–1411. 10.1002/j.1460-2075.1995.tb07126.x - DOI - PMC - PubMed

LinkOut - more resources