. 2025 May;38(5):e70029.
doi: 10.1002/nbm.70029.

U-Net-Based Prediction of Cerebrospinal Fluid Distribution and Ventricular Reflux Grading

Affiliations

U-Net-Based Prediction of Cerebrospinal Fluid Distribution and Ventricular Reflux Grading

Melanie Rieff et al. NMR Biomed. 2025 May.

Erratum in

Abstract

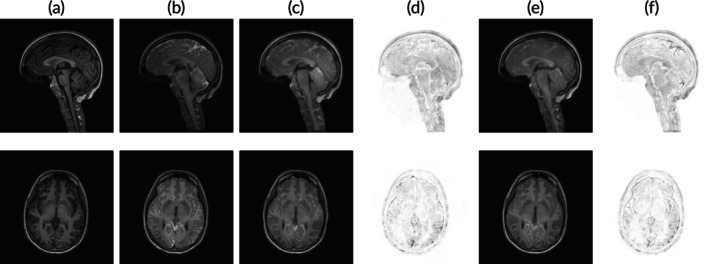
Previous work indicates evidence that cerebrospinal fluid (CSF) plays a crucial role in brain waste clearance processes and that altered flow patterns are associated with various diseases of the central nervous system. In this study, we investigate the potential of deep learning to predict the distribution in human brain of a gadolinium-based CSF contrast agent (tracer) administered intrathecal. For this, T1-weighted magnetic resonance imaging (MRI) scans taken at multiple time points before and after injection were utilized. We propose a U-net-based supervised learning model to predict pixel-wise signal increase at its peak after 24 h. Performance is evaluated based on different tracer distribution stages provided during training, including predictions from baseline scans taken before injection. Our findings show that training with imaging data from only the first 2-h postinjection yields tracer flow predictions comparable to models trained with additional later-stage scans. Validation against ventricular reflux gradings from neuroradiologists confirmed alignment with expert evaluations. These results demonstrate that deep learning-based methods for CSF flow prediction deserve more attention, as minimizing MR imaging without compromising clinical analysis could enhance efficiency, improve patient well-being and lower healthcare costs.

Keywords: MRI tracer; U‐net; cerebrospinal fluid distribution; deep learning; glymphatic system.


Figures

FIGURE 1
FIGURE 1
Defaced sagittal slices from CSF tracer‐enhanced MRI of a sample patient. After 24 h, the tracer has enriched the CSF spaces around the entire brain and is completely cleared after 4 weeks.
FIGURE 2
FIGURE 2
Exemplary illustration of the training and testing steps. Here, the network was trained by minimizing the 2‐loss of the reconstructed sagittal images to the real images and final model evaluation made use of the mean of all squared errors among the testing data.
FIGURE 3
FIGURE 3
(a) Modified U‐net architecture used in this work. Here, axial and sagittal MRI planes (one each) scanned before tracer injection are used to predict its distribution 24 h after tracer injection. (b) Processing workflow from original MRI scans to U‐Net model predictions, comparison with real MRI images, and final clinical diagnosis.
FIGURE 4
FIGURE 4
A sample test case (sagittal and axial plane) of gadobutrol distribution prediction based from baseline MRI scans (pre‐injection). (a) real MR imaging taken before injection. (b) real MR imaging taken approximately 24 h after intrathecal tracer injection. (c) predicted tracer distribution 24‐h postinjection using an 2 loss function. (d) absolute difference between b and c. (e) predicted tracer distribution using an 1loss function. (f) absolute difference between 4b and 4e.
FIGURE 5
FIGURE 5
Two sample test cases (sagittal and axial planes). Rows 1 and 2 display to the first test case, while rows 3 and 4 display the second. Each column corresponds to a different set of MR images (artificial or real). (a) real MR imaging taken within 1‐ to 2‐h postinjection. (b) real MR imaging taken approximately 24 h after intrathecal tracer injection. (c) predicted tracer distribution 24‐h postinjection (2 loss). (d) absolute difference between b and c. (e) predicted tracer distribution 24‐h postinjection (1loss). (f) absolute difference between b and e.
FIGURE 6
FIGURE 6
Grade transition matrices for Raters 1, 2, and 3. Each matrix row illustrates the percentage of grades assigned to predicted MRI slices transitioning to grades assigned to real ones, so that in each row, all entries sum up to 1.
FIGURE A1
FIGURE A1
(a) Prediction from baseline (pre‐injection). (b) Prediction from 1‐ to 2‐h postinjection. A1c: Prediction from 3‐ to 5‐h postinjection. (d) Prediction from 5‐ to 7‐h postinjection. (e) Prediction from 7‐ to 9‐h postinjection. (f) Prediction from 1‐ to 9‐h postinjection.

References

    1. Iliff J. J., Wang M., Liao Y., et al., “A Paravascular Pathway Facilitates CSF Flow Through the Brain Parenchyma and the Clearance of Interstitial Solutes, Including Amyloid β ,” Science Translational Medicine 4, no. 147 (2012): 1–5. - PMC - PubMed
    1. Xie L., Kang H., Xu Q., et al., “Sleep Drives Metabolite Clearance From the Adult Brain,” Science 342, no. 6156 (2013): 373–377. - PMC - PubMed
    1. Rasmussen M. K., Mestre H., and Nedergaard M., “The Glymphatic Pathway in Neurological Disorders,” Lancet Neurology 17, no. 11 (2018): 1016–1024. - PMC - PubMed
    1. Dreha‐Kulaczewski S., Joseph A. A., Merboldt K. D., Ludwig H. C., Gärtner J., and Frahm J., “Inspiration Is the Major Regulator of Human CSF Flow,” Journal of Neuroscience 35, no. 6 (2015): 2485–2491. - PMC - PubMed
    1. Vinje V., Ringstad G., Lindstrøm E. K., et al., “Respiratory Influence on Cerebrospinal Fluid Flow–A Computational Study Based on Long‐Term Intracranial Pressure Measurements,” Scientific Reports 9, no. 1 (2019): 9732. - PMC - PubMed

LinkOut - more resources