. 2025 Apr 14;16(1):3522.
doi: 10.1038/s41467-025-58510-1.

Combination radiation and αPD-L1 enhance tumor control by stimulating CD8+ PD-1+ TCF-1+ T cells in the tumor-draining lymph node

Affiliations

Combination radiation and αPD-L1 enhance tumor control by stimulating CD8+ PD-1+ TCF-1+ T cells in the tumor-draining lymph node

Yang Shen et al. Nat Commun. .

Abstract

Combination radiotherapy (RT) and αPD-L1 therapy has potential to enhance local and distant (abscopal) tumor control, however, clinical results in humans have been variable. Using murine melanoma models, we found RT + αPD-L1 increases intra-tumor progenitor CD8+ PD-1+ TCF-1+ T cells. This increase depends on trafficking of the PD-1+ TCF-1+ cells from the tumor-draining lymph node (TdLN) to the tumor. RT alone promotes the expansion and differentiation of the TdLN derived PD-1+ TCF-1+ cells into TIM-3+ GZMB+ TCF-1- effector-like cells in the tumor with further enhancement after the addition of αPD-L1. In the TdLN, combination therapy enriches for a novel PD-1+ TCF-1+ TOX- LY6A+ subset with expression of a type I interferon and migratory signature. This subset is able to traffic to the tumor and differentiate into TIM-3+ TCF-1- cells. Finally, we found that ablation of the PD-1+ TCF-1+ T cell population attenuates the enhanced tumor control observed with combination RT + αPD-L1. These results suggest that abscopal response failures may be secondary to impaired stimulation of TdLN CD8+ PD-1 + TCF-1+ T cells or an inability of PD-1+ TCF-1+ cells in the TdLN to traffic to the tumor.


Conflict of interest statement

Competing interests: N.C.S. has a consulting role at Checkpoint Surgical, Sensorion, and Synergy Research, Inc, is a member of the advisory board of Regeneron, receives book royalties from Plural Publishing, and has received funding from Astex Pharmaceuticals. G.B.L. has received research funding through a sponsored research agreement between Emory University and Merck and Co., Bristol-Myers Squibb, Boerhinger-Ingelheim, and Vaccinex. The remaining authors declare no competing interests.

Figures
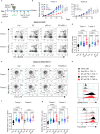
Fig. 1
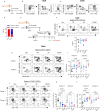
Fig. 1. RT + αPD-L1 promote an increase in intra-tumoral PD-1+ TCF-1+ and PD-1+ TIM-3+ CD8+ T cells.
a Experimental schema. b Tumor growth kinetics for the RT targeted tumor 1 and the distant (abscopal tumor) tumor 2 demonstrating enhanced control with combination therapy. Con, control; RT, radiation therapy. Data reflect 2 separate experiments combined (Con n = 8, RT n = 9, αPD-L1 n = 8, RT/αPD-L1 n = 10 total). Statistical significance calculated by two-tailed unpaired t tests. c Representative plots of GP33+ PD-1+ T cells gated on CD8 in tumor 1 and tumor 2 under different treatment conditions. d Quantitation plots for number of GP33+ T cells per gram tumor. e Representative plots of PD-1+ TCF-1+ and PD-1+ TIM-3+ gated on CD8+ PD-1+ GP33+ T cells. f Quantitation plots for number of PD-1+ TCF-1+ T cells per gram tumor. g Quantitation plots for number of PD-1+ TIM-3+ T cells per gram tumor. The vast majority of GP33+ T cells in the tumor are TIM-3+ , therefore, the plots showing total GP33+ T cells (d) and the TIM-3+ subset are very similar. h Representative histogram flow plots. Data reflect 3 separate experiments combined (n = 13 total). GZMB, granzyme B. All data are presented as mean values ± SEM. Statistical significance calculated by Kruskal-Wallis test, unless otherwise noted. Source data are provided as a Source Data file.
Fig. 2
Fig. 2. The TdLN supplies the tumor with PD-1+ TCF-1+ CD8+ T cells following RT + αPD-L1.
a Representative plots of PD-1+ GP33+ T cells and PD-1+ TCF-1+ cells vs. TIM-3+ in the tumor and its TdLN. b Quantitation of the PD-1+ TCF-1+ cells frequency in the tumor and its TdLN. Combined data from 2 experiments (n = 10 total). c Experimental schema with yellow bar representing FTY720 administration in drinking water. d Representative plots gated on CD8 showing PD-1+ GP33+ T cells in the tumor under different treatment conditions with or without FTY720. e Quantitation of the number of GP33+ T cells per gram tumor. Combined data from 2 experiments (n = 10 total). f Representative plots gated on antigen specific subsets under different treatment conditions with or without FTY720. g Quantitation of the number of antigen specific PD-1+ TCF-1+ T cells per gram tumor. Combined data from 2 separate experiments (n = 10 total per group). h Quantitation of the number of antigen specific PD-1+ TIM-3+ cells per gram tumor. Combined data from 2 separate experiments (n = 10 total per group). i Tumor kinetics under different treatment conditions with and without FTY720. Statistical significance calculated by two-tailed unpaired t tests. Combined data from 2 experiments (n = 15 total). All data are presented as mean values ± SEM. Statistical significance calculated by Kruskal-Wallis test, unless otherwise noted. Source data are provided as a Source Data file.
Fig. 3
Fig. 3. RT promotes the expansion and differentiation of TdLN PD-1+ TCF-1+ T cells which is enhanced with αPD-L1.
a Experimental schema. b Representative flow plots showing the P14 T cells differentiating into PD-1+ TCF-1+ cells in the TdLN and (c) PD-1+ TIM-3+ in the tumor. d Frequency of PD-1+ TCF-1+ cells and PD-1+ TIM-3+ in the tumor versus its TdLN. e Experimental schema with serial adoptive transfer. f Representative flow plot of gating on transferred P14s in the TdLN of tumor 1 under different treatment conditions. g Quantitation of the number of P14s in the TdLN of tumor 1 by treatment condition. Data reflect combined data from two separate experiments (n = 6 total). h Representative flow plot of gating on transferred P14s in the tumor under different treatment conditions. i Quantitation of P14s per gram tumor. Data reflect combined data from two separate experiments (n = 6 total). Statistical significance calculated by Kruskal-Wallis test. j Representative flow plots of P14 T cell subsets in the tumors. k Frequency of PD-1+ TCF-1+ and l PD-1+ TIM-3+ in the tumors. Data reflect combined data from two separate experiments (n = 6 total). All data are presented as mean values ± SEM. Statistical significance calculated by one-way ANOVA, unless otherwise noted. Source data are provided as a Source Data file.
Fig. 4
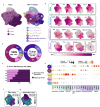
Fig. 4. ScRNA-seq analysis identified multiple CD8+ PD-1+ TCF-1+ T cell subsets in the TdLN.
a UMAP (Uniform Manifold Approximation and Projection) identified six major cell populations in the TdLN and tumor. b Quantitation of different subset frequencies in the TdLN and the tumor; with subset identities as indicated in (a). c TCR (T-cell receptor) sequencing demonstrates percentage overlap between antigen experienced polyclonal CD8+ T cell populations in the tumor and TdLN. Each row (M) reflects a different mouse. d Feature plots showing expression levels of relevant markers. e Average expression and percent expressing various markers in the different T cell subsets. f Density plot of stemness module score (Tcf7, Il7r, Sell, Fos, Jun, Cd69). g Density plot of exhaustion module score (Lag3, Ctla4, Tigit, Entpd1, Pdcd1). Source data are provided as a Source Data file and are available on the NCBI Gene Expression Omnibus (GEO) database.
Fig. 5
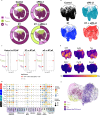
Fig. 5. Combination RT + αPD-L1 expands a novel TCF-1+ subset in the TdLN.
a UMAP and quantitation demonstrating the major cell PD-1+ Tcf7-expressing T cell populations in the TdLN under different treatment conditions. b UMAP by treatment condition with the novel population in RT + αPD-L1 group circled. c Proportions of Tcf7-expressing CD8+ PD-1+ T cell subtypes were compared across treatment conditions using a two-sided permutation test (1000 iterations), with empirical P values adjusted by the Benjamini–Hochberg method. Red dots indicate significant differences (FDR < 0.05, |log2FC | > 0.58); gray dots are non-significant. Exact p values and 95% confidence intervals (bootstrapped, 1000 iterations) are reported. d Density plots showing expression levels of Tcf7, Ly6a, Tox, Klrk1, Ccrl2, and Gzmb in CD8+ Tcf7-expressing PD-1+ T cells from the TdLN, with color intensity representing scaled expression levels (purple = minimum; yellow = maximum). e Gene expression patterns across CD8+ PD-1+ Tcf7-expressing T cell subsets under different treatments (RT, αPD-L1, RT + αPD-L1) compared to controls. Dot size represents percent expression, and color indicates average expression levels for exhaustion, effector, Ly6a, migration, cytokine receptor, stem, and Type I interferon (IFN) genes. f RNA velocity analysis of CD8+ PD-1+ T cell subsets with arrows indicating inferred directional transitions between TSTEM-1, TSTEM-2, TPEX, and Cluster 5 (Effector-like/TD) states. Source data are provided as a Source Data file and are available on the NCBI Gene Expression Omnibus (GEO) database.
Fig. 6
Fig. 6. TSTEM-2 cells differentiate into TIM-3+ T cells in the tumor.
a Representative flow plots showing the gating strategy for identification of TCF-1+ subsets among transferred P14 cells in the TdLN following RT + αPD-L1. b Quantification of P14 subsets in the TdLN. Data are combined from two separate experiments (n = 8 total). c Representative flow plot gating on transferred P14s in the tumor. d Representative histogram plots for the different subsets. e Representative flow plots of P14 TCF−1+ LY6A+ CD314+ cells in the blood. f Experimental schema for serial adoptive transfer. g Representative flow plots depicting expression of various markers on TSTEM-2 cells pre- and post-transfer. h Quantification of MFIs (mean fluorescence intensity) of different markers; data reflect combined data from two separate experiments (n = 6 total). All data are presented as mean values ± SEM. Statistical significance calculated by two-tailed unpaired t test. Source data are provided as a Source Data file.
Fig. 7
Fig. 7. PD-1+ TCF-1+ CD8+ T cell depletion attenuates the enhanced tumor control of RT + αPD-L1.
a Experimental schema with diphtheria toxin (DT) reflecting time points of DT administration. b Representative flow plots of DTR- or DTR+ P14 cells in the TdLN of tumor 1. DTR, diphtheria toxin receptor. c Representative histogram plot of PD-1 expression in the DTR- P14 T cells in the TdLN of tumor 1. d Representative flow plots of P14 subsets in the TdLN of tumor 1 for DTR- and DTR+ . e Quantitation of P14 PD-1+ TCF-1+ T cells in the TdLN. f Representative flow plots of LY6A+ TCF-1+ cells in the TdLN. g Quantitation of LY6A+ TCF-1+ cells in the TdLN. h Representative flow plots of DTR- or DTR+ P14 cells in the tumor. i Representative histogram plots for PD-1 expression in DTR+ and DTR- P14 cells. j Representative flow plots of P14 subsets in the tumors. k Quantitation of the number of P14 PD-1+ TCF-1+ T cells and (l) TIM-3+ per gram tumor. m Tumor growth kinetics under different treatment conditions with DTR+ or DTR- P14 cell transfer. Data shown from a representative experiment n = 5 per group, repeated 3 times. All data are presented as mean values ± SEM. Statistical significance calculated by two-tailed unpaired t test. Source data are provided as a Source Data file.

Update of

References

    1. Hashimoto, M. et al. CD8 T cell exhaustion in chronic infection and cancer: opportunities for interventions. Annu. Rev. Med.69, 301–318 (2018). - PubMed
    1. McLane, L. M., Abdel-Hakeem, M. S. & Wherry, E. J. CD8 T cell exhaustion during chronic viral infection and cancer. Annu Rev. Immunol.37, 457–495 (2019). - PubMed
    1. Abdel-Hakeem, M. S. et al. Epigenetic scarring of exhausted T cells hinders memory differentiation upon eliminating chronic antigenic stimulation. Nat. Immunol.22, 1008–1019 (2021). - PMC - PubMed
    1. Johnson, P. C., Gainor, J. F., Sullivan, R. J., Longo, D. L. & Chabner, B. Immune checkpoint inhibitors - the need for innovation. N. Engl. J. Med.388, 1529–1532 (2023). - PubMed
    1. Freeman, G. J. et al. Engagement of the PD-1 immunoinhibitory receptor by a novel B7 family member leads to negative regulation of lymphocyte activation. J. Exp. Med.192, 1027–1034 (2000). - PMC - PubMed

MeSH terms

LinkOut - more resources