DIA-BERT: pre-trained end-to-end transformer models for enhanced DIA proteomics data analysis
- PMID: 40229248
- PMCID: PMC11997033
- DOI: 10.1038/s41467-025-58866-4
DIA-BERT: pre-trained end-to-end transformer models for enhanced DIA proteomics data analysis
Abstract
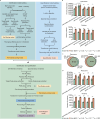
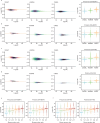
Data-independent acquisition mass spectrometry (DIA-MS) has become increasingly pivotal in quantitative proteomics. In this study, we present DIA-BERT, a software tool that harnesses a transformer-based pre-trained artificial intelligence (AI) model for analyzing DIA proteomics data. The identification model was trained using over 276 million high-quality peptide precursors extracted from existing DIA-MS files, while the quantification model was trained on 34 million peptide precursors from synthetic DIA-MS files. When compared to DIA-NN, DIA-BERT demonstrated a 51% increase in protein identifications and 22% more peptide precursors on average across five human cancer sample sets (cervical cancer, pancreatic adenocarcinoma, myosarcoma, gallbladder cancer, and gastric carcinoma), achieving high quantitative accuracy. This study underscores the potential of leveraging pre-trained models and synthetic datasets to enhance the analysis of DIA proteomics.
© 2025. The Author(s).
Conflict of interest statement
Competing interests: T.G. is the founder of Westlake Omics (Hangzhou) Biotechnology Co., Ltd., while P.L. is staff of this company. The remaining authors declare no competing interests.
Figures


Similar articles
-
Reproducibility, Specificity and Accuracy of Relative Quantification Using Spectral Library-based Data-independent Acquisition.Mol Cell Proteomics. 2020 Jan;19(1):181-197. doi: 10.1074/mcp.RA119.001714. Epub 2019 Nov 7. Mol Cell Proteomics. 2020. PMID: 31699904 Free PMC article.
-
Data-Independent Acquisition: A Milestone and Prospect in Clinical Mass Spectrometry-Based Proteomics.Mol Cell Proteomics. 2024 Aug;23(8):100800. doi: 10.1016/j.mcpro.2024.100800. Epub 2024 Jun 15. Mol Cell Proteomics. 2024. PMID: 38880244 Free PMC article. Review.
-
Phenotype Classification using Proteome Data in a Data-Independent Acquisition Tensor Format.J Am Soc Mass Spectrom. 2020 Nov 4;31(11):2296-2304. doi: 10.1021/jasms.0c00254. Epub 2020 Oct 26. J Am Soc Mass Spectrom. 2020. PMID: 33104352
-
A Comparative Analysis of Data Analysis Tools for Data-Independent Acquisition Mass Spectrometry.Mol Cell Proteomics. 2023 Sep;22(9):100623. doi: 10.1016/j.mcpro.2023.100623. Epub 2023 Jul 21. Mol Cell Proteomics. 2023. PMID: 37481071 Free PMC article.
-
Acquisition and Analysis of DIA-Based Proteomic Data: A Comprehensive Survey in 2023.Mol Cell Proteomics. 2024 Feb;23(2):100712. doi: 10.1016/j.mcpro.2024.100712. Epub 2024 Jan 3. Mol Cell Proteomics. 2024. PMID: 38182042 Free PMC article. Review.
References
-
- Zhang, F., Ge, W., Ruan, G., Cai, X. & Guo, T. Data-independent acquisition mass spectrometry-based proteomics and software tools: a glimpse in 2020. Proteomics.20, e1900276 (2020). - PubMed
-
- Kitata, R. B., Yang, J. C. & Chen, Y. J. Advances in data-independent acquisition mass spectrometry towards comprehensive digital proteome landscape. Mass Spectrom. Rev.42, 2324–2348 (2023). - PubMed
-
- Rost, H. L. et al. OpenSWATH enables automated, targeted analysis of data-independent acquisition MS data. Nat. Biotechnol.32, 219–223 (2014). - PubMed
MeSH terms
Substances
LinkOut - more resources
Full Text Sources

