. 2025 Apr 14;16(1):3524.
doi: 10.1038/s41467-025-57636-6.

A genetically informed brain atlas for enhancing brain imaging genomics

Collaborators, Affiliations

A genetically informed brain atlas for enhancing brain imaging genomics

Jingxuan Bao et al. Nat Commun. .

Abstract

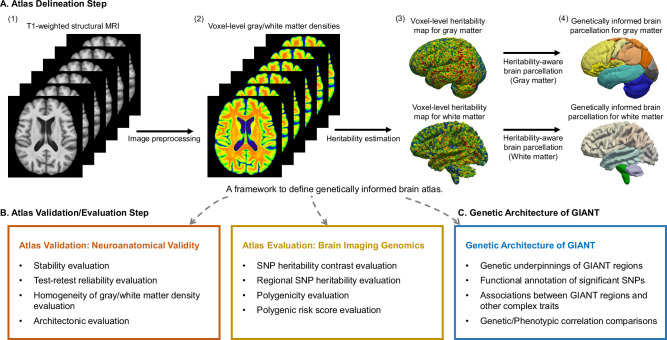
Brain imaging genomics has manifested considerable potential in illuminating the genetic determinants of human brain structure and function. This has propelled us to develop the GIANT (Genetically Informed brAiN aTlas) that accounts for genetic and neuroanatomical variations simultaneously. Integrating voxel-wise heritability and spatial proximity, GIANT clusters brain voxels into genetically informed regions, while retaining fundamental anatomical knowledge. Compared to conventional (non-genetics) brain atlases, GIANT exhibits smaller intra-region variations and larger inter-region variations in terms of voxel-wise heritability. As a result, GIANT yields increased regional SNP heritability, enhanced polygenicity, and its polygenic risk score explains more brain volumetric variation than traditional neuroanatomical brain atlases. We provide extensive validation to GIANT and demonstrate its neuroanatomical validity, confirming its generalizability across populations with diverse genetic ancestries and various brain conditions. Furthermore, we present a comprehensive genetic architecture of the GIANT regions, covering their functional annotation at the molecular levels, their associations with other complex traits/diseases, and the genetic and phenotypic correlations among GIANT-defined imaging endophenotypes. In summary, GIANT constitutes a brain atlas that captures the complexity of genetic and neuroanatomical heterogeneity, thereby enhancing the discovery power and applicability of imaging genomics investigations in biomedical science.


Conflict of interest statement

Competing interests: The authors declare no competing interests.

Figures

Fig. 1
Fig. 1. A framework to define genetically informed brain atlas.
A Atlas Delineation: The framework for defining GIANT begins with preprocessing T1-weighted structural MRI data. The preprocessed data is then used to calculate the voxel-level gray matter and white matter densities. We then estimate the SNP heritability for each brain voxel in gray matter and white matter, respectively. Next, a heritability-aware brain parcellation model is applied to both gray matter and white matter to cluster the brain voxels into regions according to their heritability information and spatial proximity. The GIANT is defined by combining the gray matter and white matter parcellations. B Atlas Validation/Evaluation: Subsequently, we performed a series of validation and evaluation steps, including neuroanatomical validation and brain imaging genomics evaluations, to demonstrate that GIANT functions as a neuroanatomical brain atlas and enhances discovery power in brain imaging genomics studies. C Genetic Architecture: Finally, we present the genetic architecture of GIANT. GIANT genetically informed brain atlas, MRI magnetic resonance imaging.
Fig. 2
Fig. 2. GIANT: Genetically informed brain atlas.
GIANT integrates the SNP heritability and spatial proximity. We annotate the GIANT into 7 brain substructures, including a cerebellum; b the deep structure of gray matter and white matter structure; c frontal structures (superior); d frontal structures (inferior); e parietal structure; f occipital structure; g temporal structure; and h others. We used the MUSE atlas to annotate the GIANT (Method 6). The region specification for GIANT and MUSE can be found in Supplementary Data 1 and 2. GIANT genetically informed brain atlas, SNP single nucleotide polymorphism.
Fig. 3
Fig. 3. The architectonic similarity of the cortical and gray matter regions of selected brain atlases.
We evaluate the similarity between brain atlases using adjusted mutual information (AMI) score. We plot the pairwise AMI scores for GIANT atlas and some other selected brain atlas within a cortical regions and b gray matter tissue. Darker color represents higher concordance between two atlases. We marked the AMI > 0.8 with “×” representing the “perfect alignments”. The GIANT atlas is highlighted using blue dashed lines. CPAC200: a whole brain fMRI atlas generated via spatially constrained spectral clustering; Desikan: an automated labeling system for subdividing the human cerebral cortex on MRI scans into gyral-based regions of interest; Hammersmith: an automatic segmentation of young children’s brains; MUSE: an ensemble multi-atlas parcellation; Schaefer: a local-global parcellation of the human cerebral cortex from intrinsic functional connectivity MRI; Talairach: automated Talairach atlas labels for functional brain mapping; Yeo: the organization of the human cerebral cortex estimated by intrinsic functional connectivity. AMI adjusted mutual information, AAL automated anatomical labeling, AICHA an atlas of intrinsic connectivity of homotopic areas, MRI magnetic resonance imaging.
Fig. 4
Fig. 4. Comparison of ROI-level significant lead SNPs between MUSE and GIANT.
GIANT identified more significant lead SNPs than MUSE. The number of significant lead SNPs for ROIs of MUSE is plotted in the outer circle, whereas the inner circle illustrates the same for ROIs of GIANT. UKBB UK biobank, GIANT genetically informed brain atlas, GWAS genome-wide association study, GM gray matter, WM white matter, SNP single nucleotide polymorphism, DEEP_WM_GM deep structure of white matter and gray matter, NONE others.
Fig. 5
Fig. 5. Dissect the enhanced polygenicity for GIANT.
GIANT defined brain regions yield enhanced discovery power compared to MUSE. In this example, we present the GWAS results for left central operculum (MUSE 113) and left composite of central operculum, anterior insula, and posterior insula regions (GIANT 16). We observed that some GWAS loci were detected to be significant in GIANT 16 that did not reach the significant threshold in MUSE 113 (circled by dashed red rectangles) and some of the GWAS loci yield more significant p values in GIANT 16 than in MUSE 113 (circled by dashed green rectangles). GIANT Genetically informed brain atlas, MUSE ensemble multi-atlas, GWAS genome-wide association study.
Fig. 6
Fig. 6. Genetic underpinnings of GIANT.
GIANT can improve the discovery power of imaging-genomics studies. We provide a landscape of the genetic determinants of GIANT. We found 472 lead SNPs within 386 genome loci significantly associated with 50 GIANT regions. Our findings can deepen the understanding of the genetic architecture of GIANT and may shed light on the potential mechanisms underlying GIANT. GIANT genetically informed brain atlas, DEEP_WM_GM deep structure of white matter and gray matter, NONE others.
Fig. 7
Fig. 7. Genetic architecture of GIANT.
We conducted a comprehensive assessment of the genetic architecture of GIANT through a multifaceted approach. a We investigated the relationships between GIANT regions and other phenotypic traits. We reported only those traits in the NHGRI-EBI GWAS Catalog that have significant overlapping GWAS signals. The GIANT regions are color-coded based on their sub-structures, and each region and trait are labeled by the proportion of their shared significant GWAS hits out of the total number of significant GWAS signals. b We annotated the functional significance of SNP variants. We counted the number of regions with significant GWAS signals that were functionally annotated in various genome regions. The GIANT regions were color-coded based on their sub-structures. c We conducted a comparison of pairwise regional genetic and phenotypic correlations, with the genetic correlations presented in the lower-left triangular regions and the phenotypic correlations located in the upper-right regions. The GIANT regions were grouped and color-coded based on their sub-structures. GIANT genetically informed brain atlas, DEEP_WM_GM deep structure of white matter and gray matter, NONE others, GWAS genome-wide association study, UTR5 5’ untranslated region, UTR3 3’ untranslated region, upstream upstream regulatory region, downstream downstream regulatory region, ncRNA non-coding RNA.

References

    1. Thompson, P. M. et al. ENIGMA and global neuroscience: A decade of large-scale studies of the brain in health and disease across more than 40 countries. Transl. psychiatry10, 100 (2020). - PMC - PubMed
    1. Thompson, P. M. et al. The ENIGMA Consortium: large-scale collaborative analyses of neuroimaging and genetic data. Brain Imaging Behav.8, 153–182 (2014). - PMC - PubMed
    1. Sudlow, C. et al. UK biobank: an open access resource for identifying the causes of a wide range of complex diseases of middle and old age. PLoS Med.12, e1001779 (2015). - PMC - PubMed
    1. Bycroft, C. et al. The UK Biobank resource with deep phenotyping and genomic data. Nature562, 203–209 (2018). - PMC - PubMed
    1. Zhao, B. et al. Genome-wide association analysis of 19,629 individuals identifies variants influencing regional brain volumes and refines their genetic co-architecture with cognitive and mental health traits. Nat. Genet.51, 1637–1644 (2019). - PMC - PubMed

LinkOut - more resources