. 2025 Apr 14;13(1):47.
doi: 10.1038/s41413-025-00421-4.

SPI1 activates mitochondrial unfolded response signaling to inhibit chondrocyte senescence and relieves osteoarthritis

Affiliations

SPI1 activates mitochondrial unfolded response signaling to inhibit chondrocyte senescence and relieves osteoarthritis

Xiangyu Zu et al. Bone Res. .

Abstract

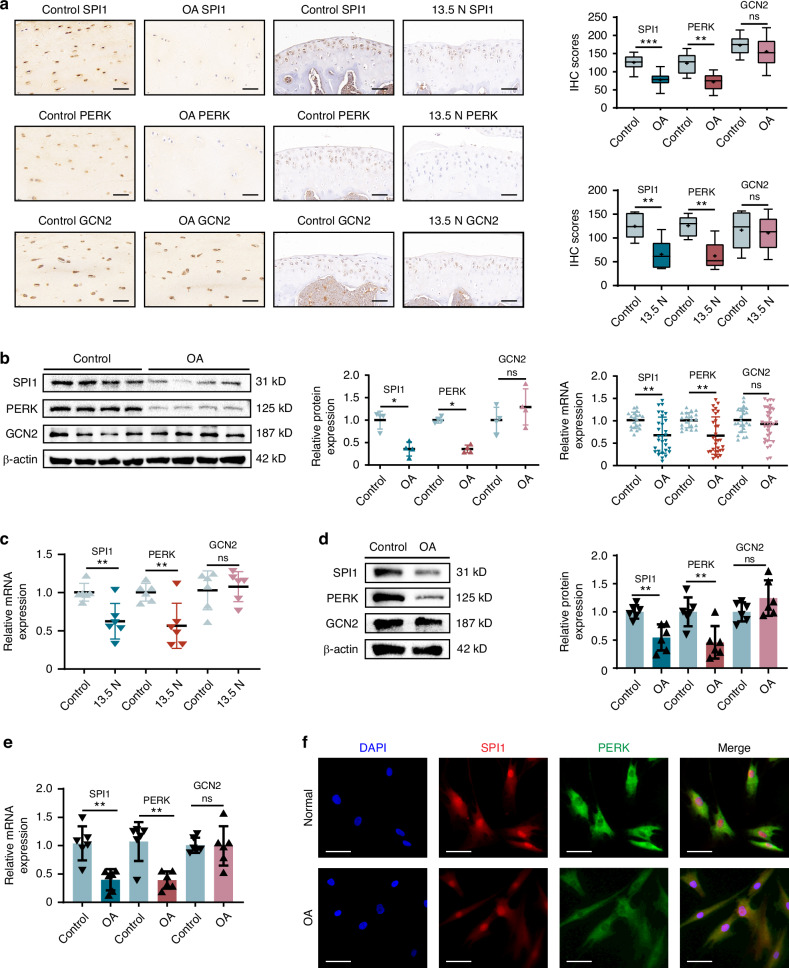
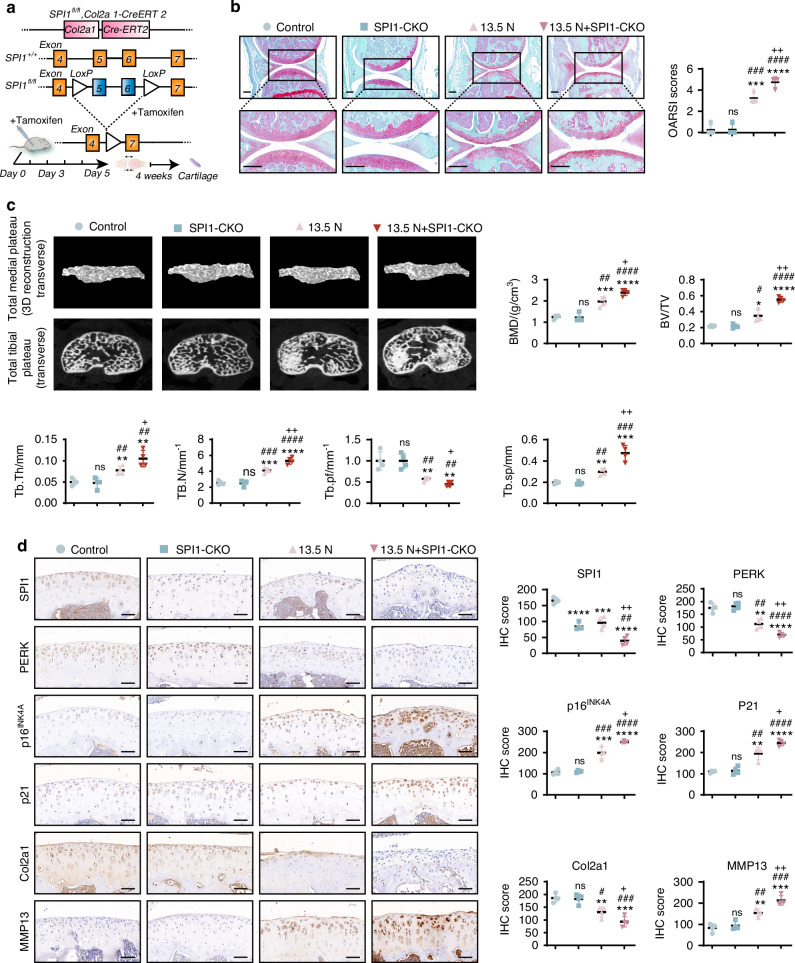
Chondrocyte senescence is a critical pathological hallmark of osteoarthritis (OA). Aberrant mechanical stress is considered a pivotal determinant in chondrocyte aging; however, the precise underlying mechanism remains elusive. Our findings demonstrate that SPI1 plays a significant role in counteracting chondrocyte senescence and inhibiting OA progression. SPI1 binds to the PERK promoter, thereby promoting its transcriptional activity. Importantly, PERK, rather than GCN2, facilitates eIF2α phosphorylation, activating the mitochondrial unfolded protein response (UPRmt) and impeding chondrocyte senescence. Deficiency of SPI1 in mechanical overload-induced mice leads to diminished UPRmt activation and accelerated OA progression. Intra-articular injection of adenovirus vectors overexpressing SPI1 and PERK effectively mitigates cartilage degeneration. In summary, our study elucidates the crucial regulatory role of SPI1 in the pathogenesis of chondrocyte senescence by activating UPRmt signaling through PERK, which may present a novel therapeutic target for treating OA. SPI1 alleviates the progression of OA by inhibiting mechanical stress-induced chondrocyte senescence through mitochondrial UPR signaling.


Conflict of interest statement

Competing interests: The authors declare no competing interests.

Figures

None
SPI1 alleviates the progression of OA by inhibiting mechanical stress-induced chondrocyte senescence through mitochondrial UPR signaling.
Fig. 1
Fig. 1
SPI1 and PERK expression was significantly decreased in osteoarthritic articular cartilage. a IHC of SPI1, PERK, and GCN2 expression in cartilage from OA patients (n = 10) and mechanical overload-induced mice (n = 6). Representative images and IHC scores are shown. Scale bars: 50 μm. b WB analysis of SPI1, PERK and GCN2 protein levels in cartilage from OA patients (n = 4). RT-qPCR was used to detect the mRNA expression of SPI1, PERK, and GCN2 in cartilage tissues of OA patients (n = 30) and control groups (n = 20). c RT-qPCR of SPI1, PERK and GCN2 mRNA expression in cartilage tissues of mechanical overload-induced model mice and control mice (n = 6 per group). d WB analysis of SPI1, PERK and GCN2 expression in chondrocytes of OA patients and control groups (n = 6 per group). e RT-qPCR of SPI1, PERK and GCN2 mRNA expression in chondrocytes of OA patients and control groups (n = 6 per group). f IF was used to observe the expression sites of SPI1 and PERK in OA chondrocytes and control groups (n = 4 per group). Scale bars: 50 μm. The experiments were independently repeated three times. Data are expressed as mean ± SD. *P < 0.05, **P < 0.01, ***P < 0.001 versus the control group. ns indicates not significant. t-test
Fig. 2
Fig. 2
SPI1 and PERK are involved in mechanical stress-induced chondrocyte senescence. a RT-qPCR of SPI1, PERK, CDKN2A, CDKN1A mRNA expression in the chondrocytes under mechanical stress time and stress gradient (n = 6 per group). b The CCK-8 was used to assess the proliferative activity of chondrocytes under 20% mechanical stress. c, d WB and RT-qPCR analyses were performed to detect the expression of SPI1, PERK, GCN2, p16INK4A, p21, and GLB1 in chondrocytes subjected to 48 h of 20% mechanical stress (model groups). e Representative IF images of SPI1 and PERK expression in model groups and control groups. Scale bars: 50 μm. f The model groups and control groups were analyzed by β-galactosidase staining (n = 6 per group). Scale bars: 50 μm. g, h Flow cytometry (JC-1) and microscopy were used to observe the mitochondrial membrane potential of model groups and control groups. Scale bars: 50 μm. i Mitochondrial respiratory chain complexes I-IV were determined in model groups and control groups. j TEM was used to observe the morphology of mitochondria in model groups and control groups. Scale bars: 2 μm and 500 nm. The cell sample size is n = 4. Experiments were independently repeated three times. Data are expressed as mean ± SD. *P < 0.05, **P < 0.01, ***P < 0.001, ****P < 0.000 1 versus the control group. ns indicates not significant. t-test
Fig. 3
Fig. 3
SPI1 and PERK are involved in mechanical stress-induced chondrocyte senescence. a Genome-editing strategy for generating inducible SPI1 knockout alleles. Col2a1-Cre-ERT2 mice carry the tamoxifen-responsive Cre recombinase transgene downstream of the Col2a1 promoter. SPI1fl/fl mice contain two loxP sites flanking SPI1 exons 5 and 6. Intraperitoneal injection of tamoxifen in the adult mouse induces the nuclear translocation of the ubiquitously expressed Cre–ERT2 fusion protein, resulting in the excision of the genomic fragment located between the loxP sites to generate SPI1 null alleles. b Safranin O/fast green staining was used to assess cartilage destruction and OARSI scores in the articular cartilage of SPI1-CKO mice. Scale bar: 200 μm. c Analysis of BMD and knee joint bone histomorphometric parameters using micro-CT data in SPI1 CKO mice. Original magnification ×50. d IHC of SPI1, PERK, p16INK4A, p21, Col2a1 and MMP13 expression in cartilage tissues of SPI1-CKO mice. Scale bar: 50 μm. The sample size is n = 4. Experiments were independently repeated three times. The data were expressed as mean ± SD. *P < 0.05, **P < 0.01, ***P < 0.001, ****P < 0.000 1 versus the Control group. #P < 0.05, ##P < 0.01, ###P < 0.001, ####P < 0.000 1 versus the SPI1-CKO group. +P < 0.05, ++P < 0.01 versus the 13.5 N group. ns indicates not significant. One-way ANOVA
Fig. 4
Fig. 4
SPI1 inhibits the mechanical stress-induced senescence of chondrocytes. a CCK-8 was used to assess the proliferative activity of chondrocytes in model groups with SPI1 overexpression or inhibition. b β-Galactosidase staining was used to assess the chondrocytes in model groups with SPI1 overexpression or inhibition (n = 6 per group). Scale bars: 50 μm. c IL-6, IL-8, and TNF-α levels in the culture supernatant of chondrocytes with SPI1 overexpression or inhibition in model groups were measured by ELISA. d Mitochondrial respiratory chain complexes I-IV were assessed in chondrocytes with SPI1 overexpression or inhibition in model groups. e, f Mitochondrial membrane potential in chondrocytes with SPI1 overexpression or inhibition in model groups was measured by flow cytometry and observed by microscopy. Scale bars: 50 μm. g The morphology of mitochondria was observed by TEM in chondrocytes with SPI1 overexpression or inhibition in model groups. Scale bars: 2 μm and 500 nm. The cell sample size is n = 4. Experiments were independently repeated three times. The data were expressed as mean ± SD. *P < 0.05, **P < 0.01, ***P < 0.001, ****P < 0.000 1 versus the Control group. t-test
Fig. 5
Fig. 5
SPI1 activates the UPRmt via PERK and inhibits chondrocyte senescence rather than by activating GCN2. a Protein expression of SPI1, PERK, p16INK4A, p21, GLB1, GCN2, eIF2α, p-eIF2α, ATF5, HSP60, LONP1 and ClpP was detected by WB in chondrocytes with SPI1 overexpression in model groups. The ratio of p-eIF2α to eIF2α is shown. b Gene expression changes of SPI1, PERK, CDKN2A, CDKN1A, GLB1, GCN2, eIF2α, ATF5, HSP60, LONP1 and ClpP was detected by RT-qPCR in chondrocytes with SPI1 overexpression in model groups. c Protein expression of SPI1, PERK, p16INK4A, p21, GLB1, GCN2, eIF2α, p-eIF2α and ATF5 were detected by WB in chondrocytes with SPI1 inhibition in model groups. The ratio of p-eIF2α to eIF2α is shown. d Gene expression changes of SPI1, PERK, CDKN2A, CDKN1A, GLB1, GCN2, eIF2α and ATF5 were detected by RT-qPCR in chondrocytes with SPI1 inhibition in model groups. The cell sample size is n = 4. Experiments were independently repeated three times. The data were expressed as mean ± SD. *P < 0.05, **P < 0.01, ***P < 0.001 versus the Control group, ns indicates not significant. t-test
Fig. 6
Fig. 6
SPI1 binds to the PERK promoter and promotes its transcription. a The Co-IP assay was used to detect the interaction of SPI1 and PERK in senescent chondrocytes (n = 4). b Luciferase reporter assays were used to demonstrate the relationship between SPI1 and PERK promoter in 293T cells. c ChIP- RT-qPCR analysis confirmed the immunoprecipitation of SPI1 and BS1 (n = 4). Experiments were independently repeated three times. The data were expressed as mean ± SD. ****P < 0.000 1, versus the control group. t-test. one-way ANOVA
Fig. 7
Fig. 7
SPI1 and PERK alleviated OA cartilage degeneration in mechanical overload-induced mice. a Adeno-associated virus injection into the joints of mice for 4 weeks is schematic, and samples are harvested at 35 days. b Safranin O/Fast Green staining and OARSI scores were used to assess cartilage destruction in mouse articular cartilage. Scale bar: 200 μm. c Analysis of BMD and knee joint bone histomorphometric parameters using micro-CT data in mice. Original magnification ×50. d IHC and IHC scores were used to evaluate the expression of SPI1, PERK, P16 INK4A, P21, Col2a1, and MMP13 after the injection of AAV-SPI1/AAV-PERK. Scale bar: 50 μm. Experiments were independently repeated three times. The animal sample size is n = 4. The data were expressed as mean ± SD. *P < 0.05, **P < 0.01, ***P < 0.001, ****P < 0.000 1 versus the Control group, #P < 0.05, ##P < 0.01, ###P < 0.001, ####P < 0.000 1 versus the 13.5 N + AAV-Control group. One-way ANOVA

References

    1. Quicke, J. G., Conaghan, P. G., Corp, N. & Peat, G. Osteoarthritis year in review 2021: epidemiology & therapy. Osteoarthr. Cartil.30, 196–206 (2022). - PubMed
    1. Zhao, T. et al. Advancing drug delivery to articular cartilage: From single to multiple strategies. Acta Pharm. Sin. B13, 4127–4148 (2023). - PMC - PubMed
    1. Fang, T., Zhou, X., Jin, M., Nie, J. & Li, X. Molecular mechanisms of mechanical load-induced osteoarthritis. Int. Orthop.45, 1125–1136 (2021). - PubMed
    1. Zhen, G. et al. Mechanical stress determines the configuration of TGFβ activation in articular cartilage. Nat. Commun.12, 1706 (2021). - PMC - PubMed
    1. Hayflick, L. & Moorhead, P. S. The serial cultivation of human diploid cell strains. Exp. Cell Res.25, 585–621 (1961). - PubMed

LinkOut - more resources