. 2025 Apr 14;16(1):3535.
doi: 10.1038/s41467-025-58676-8.

Specific labeling of outer membrane vesicles with antibiotic-conjugated probe reveals early bacterial infections in blood

Affiliations

Specific labeling of outer membrane vesicles with antibiotic-conjugated probe reveals early bacterial infections in blood

Qianbei Li et al. Nat Commun. .

Abstract

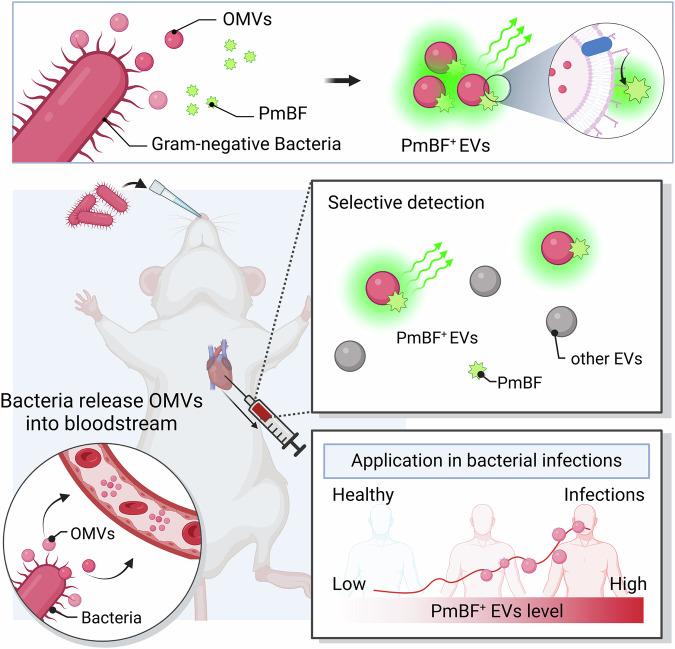
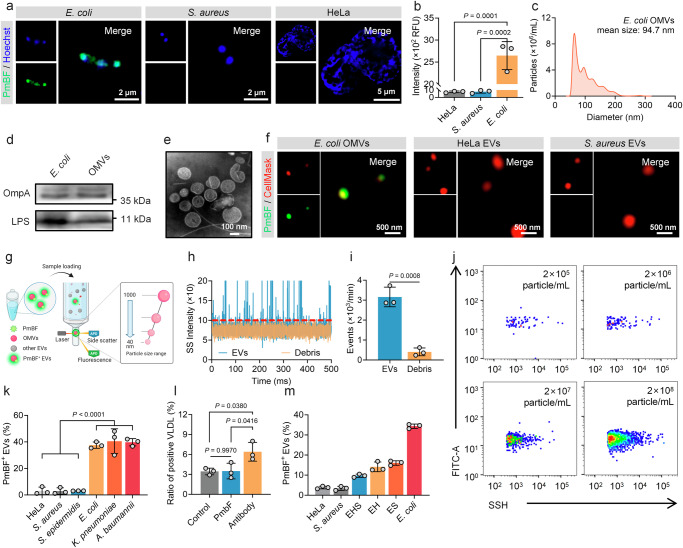
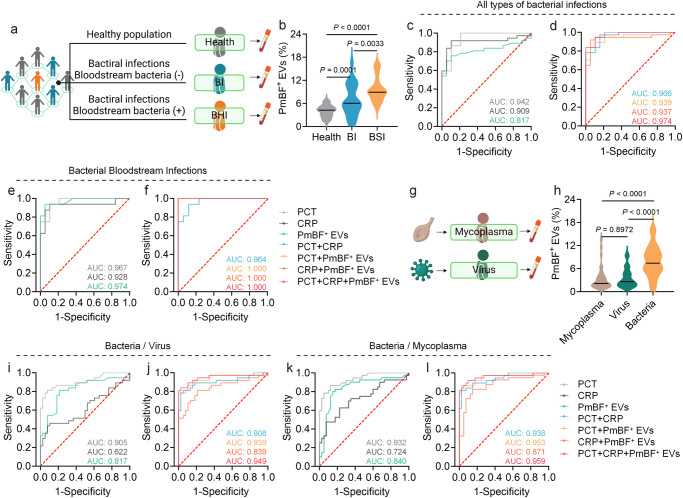
Bacterial outer membrane vesicles (OMVs) are nano-sized structures derived from the outer membrane of Gram-negative bacteria, which have emerged as key players in host-pathogen interactions, yet their potential as biomarkers remains largely unexplored due to the difficulty of identification in complex biological samples. Here we show an approach for detecting and quantifying bacterial OMVs in blood using a Polymyxin B-fluorescein probe (PmBF), which targets bacterial lipopolysaccharides (LPS). The probe selectively labels OMVs, enabling their differentiation from host extracellular vesicles and quantitative analysis using nano-flow cytometry. In male mouse models of pneumonia, we observe elevated serum PmBF+ EVs as early as 6 h post-infection, preceding positive blood cultures. In clinical samples, PmBF+ EVs show superior performance for diagnosing bacterial infections and differentiate them from virus or mycoplasma infections. Our findings highlight circulating PmBF+ EVs as promising biomarkers of bacterial infections.


Conflict of interest statement

Competing interests: The authors declare no competing interests.

Figures

Fig. 1
Fig. 1. Specific Labeling of Outer Membrane Vesicles with Antibiotic-conjugated Probe Reveals Early Bacterial Infections in Blood.
PmBF selectively tags OMVs, enabling their distinction from host extracellular vesicles and facilitating quantitative analysis via nano-flow cytometry. In male mouse models of lung infection, bacteria release OMVs into the circulation and can be detected. In clinical evaluations, PmBF+ EVs consistently demonstrate superior diagnostic performance, effectively distinguishing bacterial infections from viral or mycoplasma infections. This underscores the potential of PmBF+ EVs as reliable and biomarkers for bacterial infections (Created with BioRender.com).
Fig. 2
Fig. 2. PmBF Specifically Recognizes and Quantitatively Detects OMVs.
a Super-resolution images of Gram-negative bacteria, Gram-positive bacteria and mammal cell after incubation with PmBF for 1 h. b Fluorescence intensity of each group were detected by cytation 5, RFU: Relative Fluorescence Units (Bars represent the mean ± SD, n = 3 biological replicates). c Nanoparticles tracking analysis (NTA) of E. coli OMVs. d Western blot images of E. coli and OMVs, the protein loading amount was 50 μg for the bacterial samples and 20 μg for the EVs sample. e Transmission electron microscopy (TEM) images of E. coli OMVs. f Super-resolution images of E. coli OMVs, HeLa EVs and S. aureus EVs labeled with CellMask™ Deep Red plasma membrane stain (red) and PmBF (green). g Schematic representation of nano-flow cytometry (Created with BioRender.com). h, i Natural extracellular vesicles (control group) and debris sample detection signal and concentrations detected based on nano-flow cytometry (Bars represent the mean ± SD, n = 3 biological replicates). j Quantitative analysis of E. coli OMVs with different concentration gradients by nano-flow cytometry. k Quantitative analysis of different vesicles after PmBF labelling by nano-flow cytometry (Bars represent the mean ± SD, n = 3 biological replicates). l Quantitative analysis of positive VLDL after labeling by PmBF or antibody probes, control group was treated with PBS (Bars represent the mean ± SD, n = 3 biological replicates). m PmBF probe was used to detect E. coli OMVs within a mixture of various vesicle types (S. aureus and HeLa EVs). Group HeLa: 100% HeLa EVs; Group S. aureus: 100% S. aureus EVs; Group EHS: 40% E.coli OMVs + 30% HeLa EVs + 30% S. aureus EVs; Group EH: 50% E.coli OMVs + 50% HeLa EVs; Group ES: 50% E.coli OMVs + 50% S. aureus EVs; Group E. coli: 100% E.coli OMVs (Bars represent the mean ± SD, n = 3 biological replicates). b, k, l were determined by one-way ANOVA with multiplicity adjusted P value; i was determined by a two-tailed unpaired t-test (*P < 0.05; **P < 0.01; ***P < 0.001; ****P < 0.0001; ns: P ≥ 0.05). Source data are provided as a Source Data file.
Fig. 3
Fig. 3. PmBF Labeling Preserves OMVs Integrity and Biological Activity.
a Confocal imaging of cellular internalization of natural OMVs and PmBF-OMVs, along with quantitative analysis of fluorescence intensity, blue: nucleus; red: OMVs (Bars represent the mean ± SD, n = 3 biological replicates). b Confocal imaging of the colocalization of natural OMVs and PmBF-OMVs with different cellular organelles, accompanied by colocalization coefficients (Lyso: lysosomes, green; Mito: mitochondria, yellow; ER: endoplasmic reticulum, cyan; OMVs: red) (Bars represent the mean ± SD, n = 3 biological replicates). c Scratch experiment of BEAS-2B cells incubated with gradient concentration OMVs or labeled OMVs for 12 or 24 h, control group treated by PBS (Bars represent the mean ± SD, n = 3 biological replicates). ac were determined by a two-tailed unpaired t-test (*P < 0.05; **P < 0.01; ***P < 0.001; ****P < 0.0001; ns: P ≥ 0.05). Source data are provided as a Source Data file.
Fig. 4
Fig. 4. Circulating OMVs Serve as an Early Markers of Bacterial Infections.
a Analysis of circulating PmBF+ EVs levels in germ-free (GF) and conventional mice (SPF) mice by nano-flow cytometry (Bars represent the mean ± SD, n = 3 biological replicates). b Schematic diagram of the construction of a mouse model of colonized bacteria clearance, d: days (Created with BioRender.com). c Analysis of circulating PmBF+ EVs levels in mice models before (Control group) or after intestinal flora cleared (Bars represent the mean ± SD, n = 3 biological replicates). d Schematic diagram of the construction of mouse models of bacterial infections and blood were collected from mice after intranasally injection with 8 × 10⁷ CFU bacteria at 2, 6, 12, 24 h (Created with BioRender.com). e Blood bacterial culture plates for mouse models after E. coli infections for 2, 6, 12, 24 h, control group mice was treated with PBS. f Quantitative analysis of circulating PmBF+ EVs changes in mouse models after E. coli infections for 2, 6, 12, 24 h, control group mice was treated with PBS (The center line of each box indicates the median. The bottom and top bonds of the box show the 25th and 75th percentiles, respectively. Whiskers extend to the minimum and maximum values, n = 5 biological replicates). g Comparison of bacterial cultures and circulating OMVs positivity rates in mouse models after E. coli infections for 2, 6, 12, 24 h, control group mice was treated with PBS (Elements Created with BioRender.com). h Expression analysis of mCherry in wide-type or mCherry-E. coli derived OMVs (Bars represent the mean ± SD, n = 3 biological replicates). i Analysis of circulating mCherry+ EVs in mice models infected with mCherry-E. coli, control group mice was treated with PBS. The Y-axis indicates the percentage of serum mCherry+ EVs to total EVs. (Bars represent the mean ± SD, n = 3 biological replicates). j Blood bacterial culture plates as well as LB medium. Positive control: live mCherry-E. coli; PBS: blood of mice treated by PBS; mCherry-E. coli: blood of mice treated by mCherry-E. coli. No viable bacterial colonies were observed in group PBS and mCherry-E. coli. k Dynamic monitoring of circulating PmBF+ EVs levels at different time points post-infection in mice. Antibiotic treatment was initiated at 12 h post-infection, with administration every 12 h thereafter (Bars represent the mean ± SD, n = 3 biological replicates). l Illustration of the effect of different points in time of treatment on mouse infection models survival rate (Created with BioRender.com). m Mouse survival curves. a, c, h, i was determined by a two-tailed unpaired t-test; f, k were determined by one-way ANOVA with multiplicity adjusted P value; Survival analysis was performed using the Log-rank (Mantel-Cox) test to compare the survival curves between groups (*P < 0.05; **P < 0.01; ***P < 0.001; ****P < 0.0001; ns: P ≥ 0.05). Source data are provided as a Source Data file.
Fig. 5
Fig. 5. Clinical Utility of PmBF+ EVs as Biomarkers for Bacterial Infections.
a Clinical samples collection of healthy people and patients with different types of bacterial infections (Created with BioRender.com). b Detection of circulating PmBF+ EVs levels in the health screening population and patients with different types of bacterial infections (The horizontal line indicates the median, Health: n = 60 biological replicates; BI: n = 24 biological replicates; BSI: n = 16 biological replicates). c, d ROC curves for the diagnosis of all types of infections by PmBF+ EVs, CRP, PCT alone and in combination. e, f ROC curves for the diagnosis of bacterial bloodstream infections by PmBF+ EVs, CRP, PCT alone and in combination. g Clinical samples collection of patients with mycoplasma or virus infections (Created with BioRender.com). h Detection of circulating PmBF+ EVs levels in patients with mycoplasma, virus or bacterial infections (include bacterial infections with positive or negative blood cultures) (The horizontal line indicates the median, Mycoplasma: n = 40 biological replicates; Virus: n = 38 biological replicates; Bacteria: n = 40 biological replicates). i, j ROC curve for differential diagnosis between bacterial or virus infections. k, l ROC curve for differential diagnosis between bacterial or mycoplasma infections. b, h were determined by one-way ANOVA with multiplicity adjusted P value (*P < 0.05; **P < 0.01; ***P < 0.001; ****P < 0.0001; ns: P ≥ 0.05). Source data are provided as a Source Data file.

Similar articles

Cited by

References

    1. GBD 2019 Antimicrobial Resistance Collaborators. Global mortality associated with 33 bacterial pathogens in 2019: a systematic analysis for the global burden of disease study 2019. Lancet400, 2221–2248 (2022). - PMC - PubMed
    1. Vincent, J.-L. et al. Prevalence and outcomes of infection among patients in intensive care units in 2017. JAMA323, 1478–1487 (2020). - PMC - PubMed
    1. Rudd, K. E. et al. Global, regional, and national sepsis incidence and mortality, 1990-2017: analysis for the global burden of disease study. Lancet395, 200–211 (2020). - PMC - PubMed
    1. World Health Organization, WHO bacterial priority pathogens list, 2024: Bacterial pathogens of public health importance to guide research, development and strategies to prevent and control antimicrobial resistance (https://www.who.int/publications/i/item/9789240093461).
    1. Timsit, J.-F., Ruppé, E., Barbier, F., Tabah, A. & Bassetti, M. Bloodstream infections in critically ill patients: an expert statement. Intensive Care Med46, 266–284 (2020). - PMC - PubMed

LinkOut - more resources