. 2025 Apr 14;16(1):3546.
doi: 10.1038/s41467-025-58740-3.

Targeting site-specific N-glycosylated B7H3 induces potent antitumor immunity

Affiliations

Targeting site-specific N-glycosylated B7H3 induces potent antitumor immunity

Yun Huang et al. Nat Commun. .

Abstract

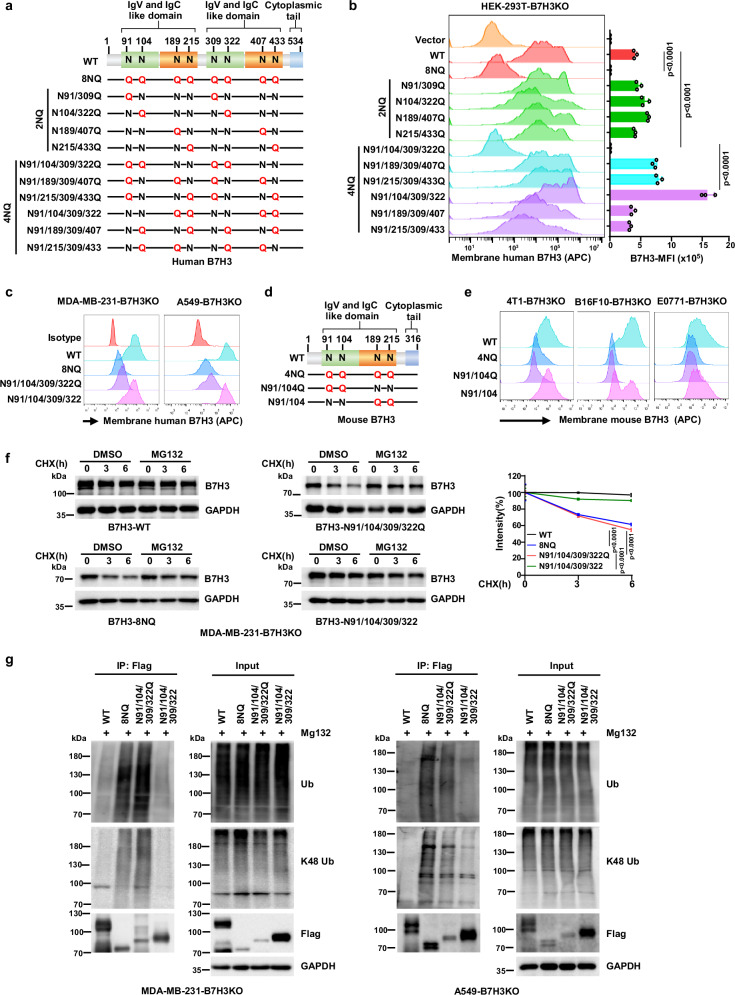
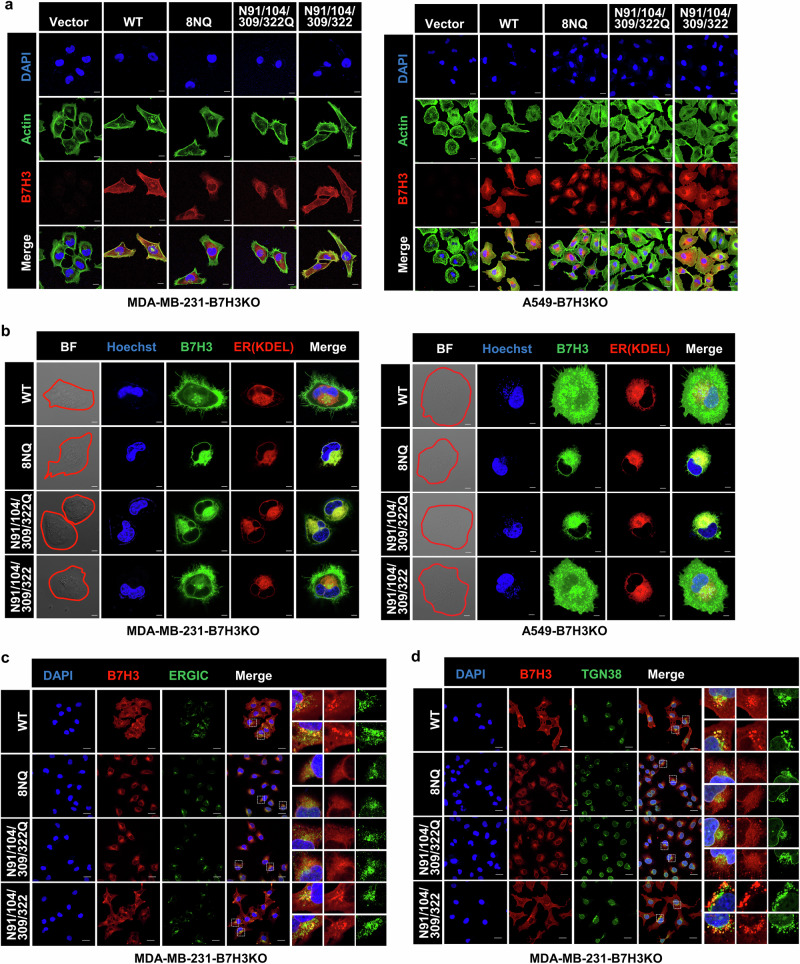
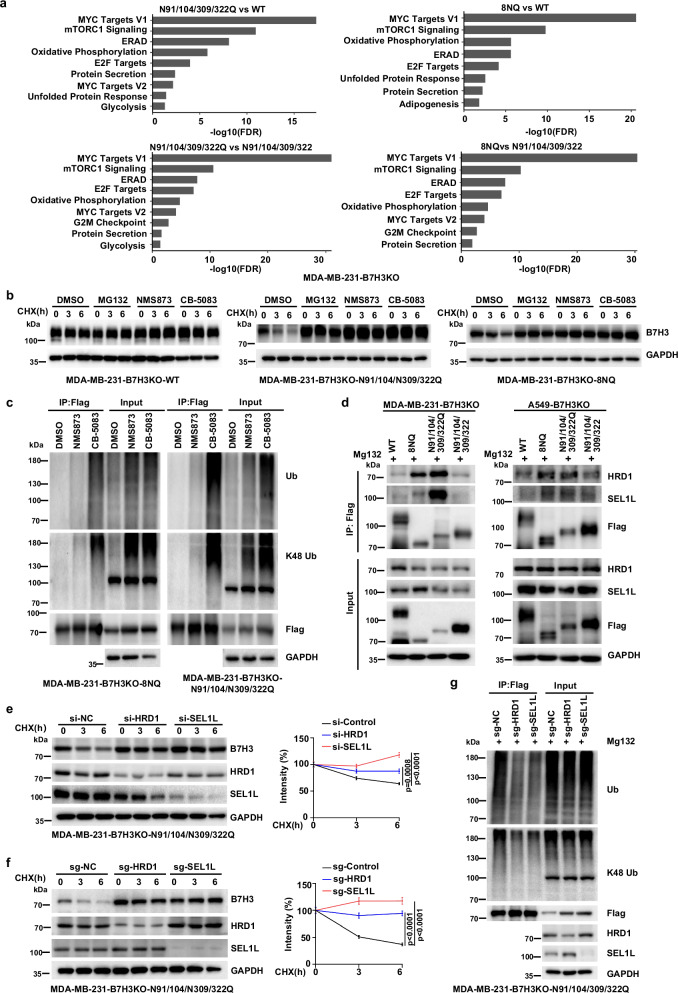
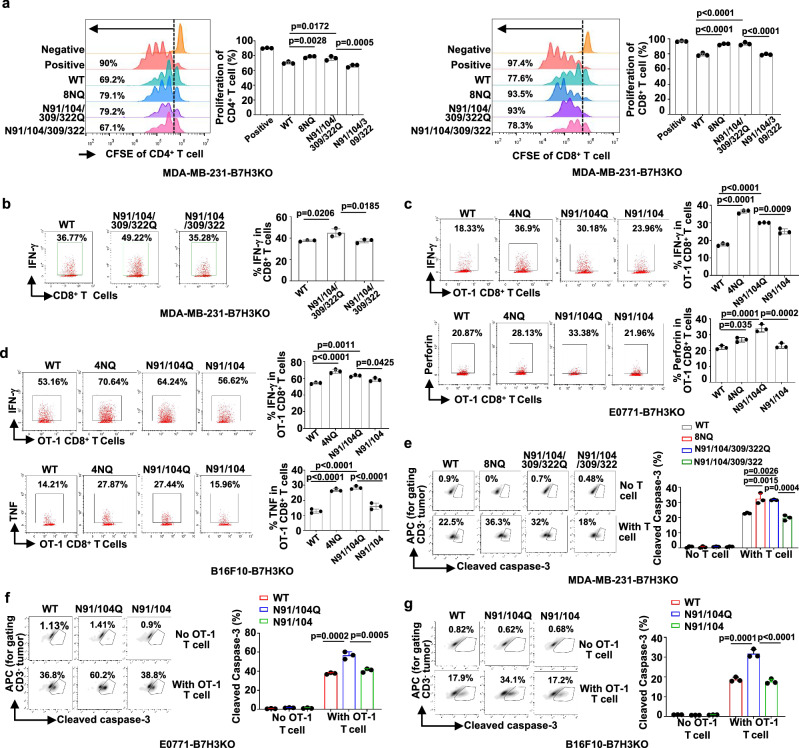
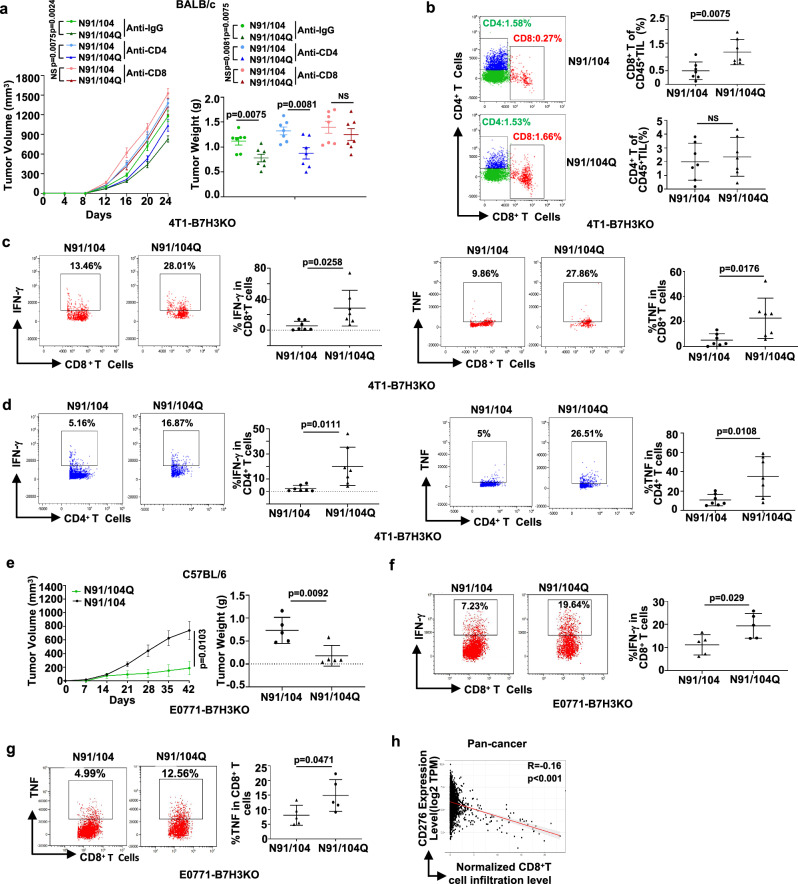
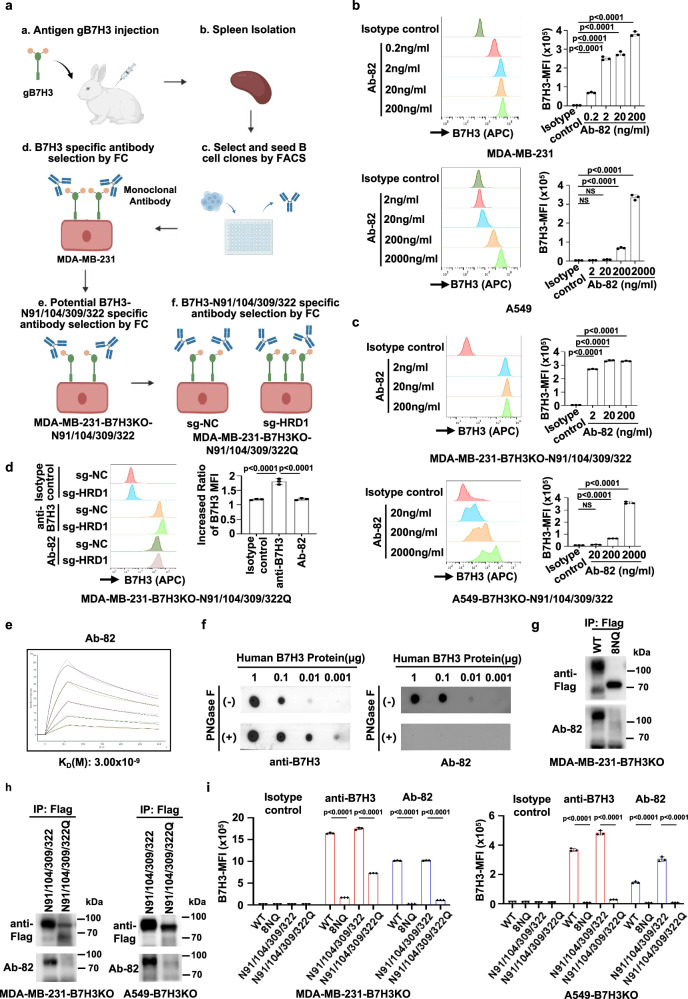
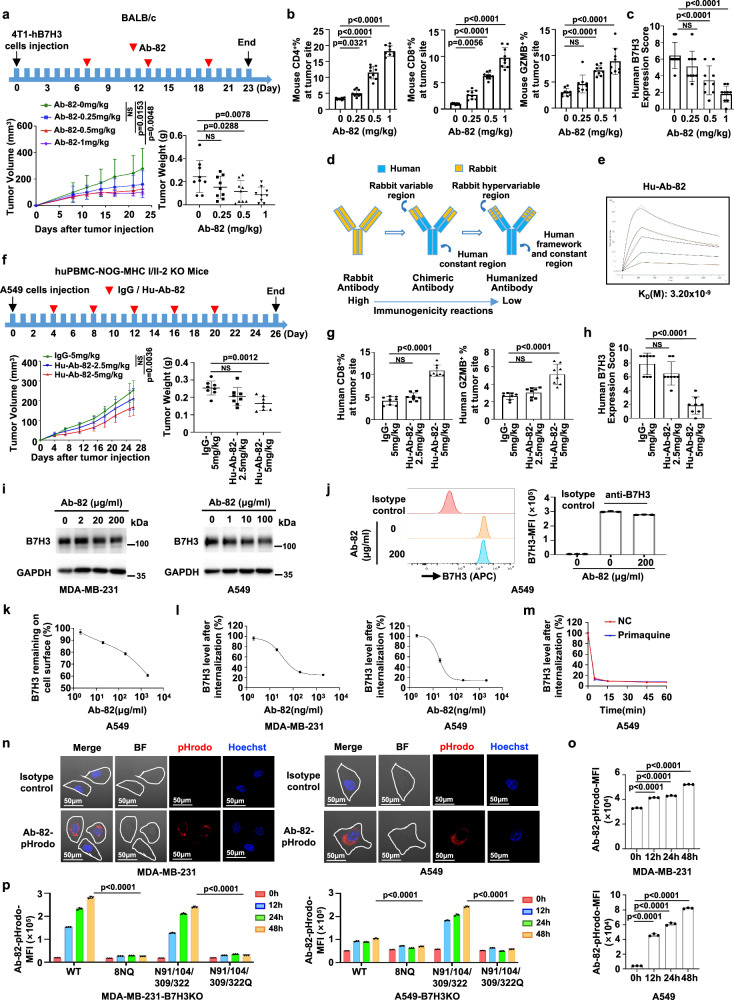
B7H3, an immune checkpoint molecule, is a highly N-glycosylated membrane protein. However, the key glycosylated asparagine residues that mediate the function of the B7H3 protein are still unclear. Here we identify that N-glycans attached to asparagine residues N91/309 and N104/322 are required for proper B7H3 localization on the cell surface membrane. We demonstrate that mutations in these two pairs of N-glycosylation sites induce ER accumulation of B7H3 by blocking its ER-to-Golgi translocation and subsequently promote its degradation via the endoplasmic reticulum-associated protein degradation pathway. Additional evidence suggests that N-glycosylation at N91/309 and N104/322 of B7H3 is essential for its inhibition of T-cell proliferation and activation. More importantly, a monoclonal antibody, Ab-82, preferentially targeting B7H3 glycosylated at N91/309 and N104/322 is developed, which exhibits the ability to elicit cytotoxic T lymphocyte-mediated antitumor immunity via B7H3 internalization. Together, these findings offer a rationale for targeting glycosylated B7H3 as a potential strategy for immunotherapy.


Conflict of interest statement

Competing interests: The authors declare that they have no competing interests.

Figures

Fig. 1
Fig. 1. N-glycosylation of B7H3 at N91/N309 and N104/N322 sites is the major contributor to the cell surface localization and stabilization of the B7H3 protein.
a Schematic diagram of human B7H3-NQ mutant constructs. WT B7H3 contains four pairs of Asn N-glycosylation sites at amino-acid positions 91 (N91) / 309 (N309), 104 (N104) / 322 (N322), 189 (N189) / 407 (N407) and 215 (N215) / 433 (N433) in the nearly exact tandem duplication of IgV-IgC domain. Potential asparagine N-glycosylation sites (N) were mutated to glutamine (Q). b HEK293T-B7H3KO cells were transiently re-expressed with the same amount of plasmids as indicated. Flow cytometry measuring B7H3 protein on the cell membrane in the indicated cell lines. Left, representative images of membrane B7H3. Right, median Fluorescence Intensity (MFI) of B7H3 (n = 3 biological independent samples). c MDA-MB-231-B7H3KO cells and A549-B7H3KO were stably rescued with human B7H3-WT and B7H3-NQ mutant cDNA individually. Flow cytometry measuring B7H3 protein on the cell membrane in the indicated cells. d Schematic diagram of mouse B7H3-NQ mutant constructs. WT B7H3 contains four Asn N-glycosylation sites at amino-acid positions 91 (N91), 104 (N104), 189 (N189) and 215 (N215) in the single IgV-IgC domain. Potential asparagine N-glycosylation sites (N) were mutated to glutamine (Q). e 4T1-B7H3KO cells, B16-B7H3KO cells and E0771-B7H3KO cells were stably rescued with mouse B7H3-WT and B7H3-NQ mutant cDNA individually. Flow cytometry measuring B7H3 protein on the cell membrane in the indicated cell lines. f The indicated cell lines were treated with MG132 in the presence of CHX at indicated intervals. The intensity of B7H3 protein was quantified using ImageJ software. g The indicated cell lines were treated with MG132 for 6 h. Immunoprecipitation analysis of Flag-tagged B7H3 ubiquitination with the indicated antibodies. The p-value in (b, f) was determined by one-way ANOVA with Tukey’s multiple comparisons test. Error bars represent mean ± SD. Data in (bg) are representative of three independent experiments.
Fig. 2
Fig. 2. Abnormal glycosylation of B7H3 at N91/N309 and N104/N322 sites blocks its ER-to-Golgi translocation.
a Confocal microscopy of MDA-MB-231-B7H3KO and A549-B7H3KO cells reconstituted with human B7H3-WT and B7H3-NQ mutant cDNA. Green, Actin; Red, B7H3. Scar bar, 50 µm. b Confocal microscopy of MDA-MB-231-B7H3KO and A549-B7H3KO cells co-expressed with human mNegoGreen-B7H3-WT cDNA or mNegoGreen-B7H3-NQ mutant cDNA, and KDEL-mRuby cDNA. BF, bright field; Green, B7H3; Red, ER marker (KDEL). Scale bars, 20 μm. c Immuno- fluorescence staining with antibodies against B7H3(red) and ERGIC (green). Scale bars,100 μm. d Immunofluorescence staining with antibodies against B7H3 (red) and TGN38 (green) in the indicated cell lines. Scale bars,100μm. DAPI and Hoechst: nuclear counterstaining. Data are representative of three independent experiments.
Fig. 3
Fig. 3. Abnormal N-glycosylation of B7H3 at N91/N309 and N104/N322 induces its ER-associated degradation.
a IP-MS analysis showing candidates with increased binding to 8NQ or N91/104/309/322Q B7H3 compared to WT or N91/104/309/322Q B7H3. b The indicated cell lines were treated with MG132, NMS-873 (2 μM) or CB-5083 (5 μM) in the presence of CHX at indicated intervals. c The indicated cell lines were treated with NMS-873 or CB-5083. Immunoprecipitation analysis of Flag-tagged B7H3 ubiquitination with the indicated antibodies. d The indicated cell lines were treated with MG132 for 6 h. Flag-tagged B7H3 WT or its NQ mutants were pulled down by anti-Flag beads in the indicated cell lines, followed by western blotting to detect HRD1 and SEL1L. e MDA-MB-231-B7H3KO-N91/104/309/322Q cells were transiently transfected with HRD1 siRNA or SEL1L siRNA for 48 h. Then the cells were treated with CHX at indicated intervals. The intensity of B7H3 protein was quantified using ImageJ software. f MDA-MB-231-B7H3KO-N91/104/309/322Q cells expressing sgRNAs targeting HRD1 or SEL1L were treated with CHX at indicated intervals. The intensity of B7H3 protein was quantified using ImageJ software. g MDA-MB-231-B7H3KO-N91/104/309/322Q cells expressing sgRNAs targeting HRD1 or SEL1L were treated with MG132 for 6 h. Immunoprecipitation analysis of Flag-tagged B7H3 ubiquitination with the indicated antibodies. The p-value in (e, f) was determined by a two-tailed unpaired Student’s t-test. Error bars represent mean ± SD. Data in (bg) are representative of three independent experiments.
Fig. 4
Fig. 4. N-glycosylation of B7H3 at the N91/302 and N104/322 sites regulates its suppressive function of T cells in vitro.
a Human T cells were labeled with CFSE, then co-cultured with the irradiated MDA-MB-231-B7H3KO cells as indicated in the presence of stimulation with anti-CD3. Anti-CD3-activated human T cells alone was used as positive control. Left, representative dot plots of in vitro proliferation of CD4+ T cells and CD8+ T cells measured by fluorescence-activated cell sorting (FACS) as CFSE dilution. Right, percentage of proliferating CD4+ T and proliferating CD8+ T (n = 3 biological independent samples). b Anti-CD3-activated human T cells were co-cultured with the irradiated MDA-MB-231-B7H3KO cells as indicated. Left, representative dot plots of in vitro activation of T measured by FACS. Right, percentage of IFN-γ+CD8+ T (n = 3 biological independent samples). c, d The irradiated E0771-B7H3KO and B16F10-B7H3KO cells as indicated were co-cultured with OT-1 T cells in vitro. Tumor cells were pulsed with OVA peptide. Left, representative dot plots of in vitro activation of T measured by FACS. Right, percentage of IFN-γ+CD8+ T, perforin+CD8+ T or TNF+CD8+ T (n = 3 biological independent samples). e The indicated MDA-MB-231-B7H3KO cell lines were co-cultured with CD3/CD28-activated human T cells. Left, representative dot plots of the cleavage of caspase-3 in tumor cells measured by flow cytometry. Right, percentage of cleaved caspase-3+ tumor cells (n = 3 biological independent samples). f, g The indicated E0771-B7H3KO and B16F10-B7H3KO cell lines were co-cultured with OVA peptide-activated OT-1 T cells. Tumor cells were pulsed with OVA peptide. Left, representative dot plots of the cleavage of caspase-3 in tumor cells measured by flow cytometry. Right, percentage of cleaved caspase-3+ tumor cells (n = 3 biological independent samples). The p-value in (a, ce) was determined by one-way ANOVA with Tukey’s multiple comparisons test. The p-value in (b, f–g) was determined by one-way ANOVA with Dunnett’s multiple comparisons test. Error bars represent mean ± SD. Data are representative of three independent experiments.
Fig. 5
Fig. 5. N-glycosylation of B7H3 at N91 and N104 sites regulates antitumor T-cell responses in vivo.
a Tumor growth of the indicated 4T1-B7H3KO cells in female 8 week-old BALB/c mice (n = 7 mice per group). Tumor volumes (left) and tumor weights upon autopsy on day 24 (right) were calculated. Mice were injected with CD8 or CD4 depletion antibody on days -7, -3, 0, +3, +7, and +10 relative to tumor challenge on day 0. bd FACS analysis of CD4+ T and CD8+ T cells (b), IFN-γ+ and TNF+ in CD8+ T cells (c), IFN-γ+ and TNF+ in CD4+ T cells (d) from the isolated TILs in (a) (right, n = 7 mice per group). Representative dot plots from a representative mouse for each group (left). e Tumor growth of the indicated E0771-B7H3KO cells in female 8 week-old C57BL/6 mice (n = 5 mice per group). Tumor volumes (left) and tumor weights upon autopsy on day 42 (right) were calculated. f-g FACS analysis of IFN-γ+ and TNF+ in CD8+ T cells from the isolated TILs in (e) (right, n = 5 mice per group). Representative dot plots from a representative mouse for each group (left). h The correlation between the expression of B7H3 and the normalized tumor infiltrated CD8+ T cells for TCGA cancer patients was analyzed using the R package “ESTIMATE”. NS, not significance. The p-value in (ag) was determined by a two-tailed unpaired Student’s t-test. Error bars represent mean ± SD. The p-value in (h) was assessed using the two-sided Pearson correlation test. Data in (ag) are representative of two independent experiments.
Fig. 6
Fig. 6. Generation and validation of a glycosylated B7H3 antibody Ab-82.
a Working flow chart for generation of glycosylated B7H3 antibody. Created in BioRender. Wq, Z. (2025) https://BioRender.com/p93p347. b Flow cytometry analysis by the different concentrations of Ab-82 to detect the B7H3 expression on the cell membrane in the indicated tumor cell lines (n = 3 biological independent samples). c Flow cytometry analysis by the different concentrations of Ab-82 to detect the B7H3 expression on the cell membrane in the N91/104/309/322 B7H3 reconstituted tumor cells (n = 3 biological independent samples). d Flow cytometry analysis by Ab-82 to detect the B7H3 expression on the cell membrane in the N91/104/309/322Q B7H3 reconstituted tumor cells with or without HRD1 deletion (n = 3 biological independent samples). e Binding affinity (KD) analysis of Ab-82 by Biacore T200. f Human B7H3-His fusion protein was de-glycosylated by PNGase F and used in Dot blot analysis by Ab-82. g, h Flag-tagged B7H3 WT or its NQ mutants were pulled down by anti-Flag beads, followed by western blotting to detect the binding ability of Ab-82 to them. i Flow cytometry analysis by anti-B7H3 and Ab-82 at the same concentration to detect the B7H3 expression on the cell membrane in the indicated cell lines (n = 3 biological independent samples). NS, not significance. The p-value in (b, c) was determined by one-way ANOVA with Dunnett’s multiple comparisons test. The p-value in (d, i) was determined by one-way ANOVA with Tukey’s multiple comparisons test. Error bars represent mean ± SD. Data in b-i are representative of three independent experiments.
Fig. 7
Fig. 7. Ab-82 induces B7H3 internalization and anti-tumor immune responses.
a Tumor growth of 4T1-hB7H3 cells in female 8 week-old BALB/c mice following treatment with Ab-82 antibody (n = 9 mice per group). The treatment protocol is summarized by the arrows. Tumor volume (left) and tumor weight upon autopsy on day 23 (right) were calculated. b, c Quantitative IHC analysis of mouse CD4, mouse CD8, mouse GZMB expression (b), and human B7H3 expression (c) (n = 9 mice per group). d Working flow chart for humanization of Ab-82 by using genetic engineering technology. e Binding affinity (KD) analysis of Hu-Ab-82 by Biacore T200. f Tumor growth of A549 cells in female 7 week-old huPBMC-NOG-MHC I/II-2 KO Mice following treatment with Hu-Ab-82 antibody (n = 8 tumors per group, 4 Mice bearing established tumors on both flanks). The treatment protocol is summarized by the arrows. Tumor volume (left) and tumor weight upon autopsy on day 26 (right) were calculated. g, h Quantitative IHC analysis of human CD8, human GZMB expression (g), and human B7H3 expression (h) (n = 8 tumors per group, 4 Mice bearing established tumors on both flanks). i The indicated cells were treated by Ab-82 at different concentrations for 48 h, followed by western blotting to detect the total B7H3 protein level with anti-human B7H3. j Cell surface B7H3 was bound by Ab-82 for 30 min or not, followed by flow cytometry with commercial anti-B7H3 (Cat. 17-2769-42, eBioscience) (n = 3 biological independent samples). k A549 cells were treated by Ab-82 at different concentrations for 24 h, followed by flow cytometry with commercial anti-B7H3 (Cat. 17-2769-42, eBioscience) (n = 3 biological independent samples). l Cell surface B7H3 was labeled by Ab-82 and internalized for 5 min, followed by flow cytometry to measure B7H3 level (n = 3 biological independent samples). m Cell surface B7H3 was labeled by Ab-82 and internalized at different time points in the presence of 50uM primaquine, followed by flow cytometry to measure B7H3 level (n = 3 biological independent samples). n Cells were treated by 20 μg/ml pHrodo red-labeled Ab-82 for 24 h, followed by immunofluorescence analysis with LSM880.BF, bright field. o Cells were treated by 20 μg/ml pHrodo red-labeled Ab-82 for different time, followed by flow cytometry to measure Ab-82 internalization level (n = 3 biological independent samples). p The indicated cells were treated by 20 μg/ml pHrodo red-labeled Ab-82 for different time, followed by flow cytometry to measure Ab-82 internalization level (n = 3 biological independent samples). NS, not significance. The p-value in (ac) and (fh) and (o) was determined by one-way ANOVA with Dunnett’s multiple comparisons test. The p-value in (p) was determined by one-way ANOVA with Tukey’s multiple comparisons test. Error bars represent mean ± SD. The data in (ah) are representative of two independent experiments. The data in (ip) are representative of three independent experiments.

Similar articles

References

    1. Moremen, K. W., Tiemeyer, M. & Nairn, A. V. Vertebrate protein glycosylation: diversity, synthesis and function. Nat. Rev. Mol. Cell Biol.13, 448–462 (2012). - PMC - PubMed
    1. Pinho, S. S. & Reis, C. A. Glycosylation in cancer: mechanisms and clinical implications. Nat. Rev. Cancer15, 540–555 (2015). - PubMed
    1. Lopez-Sambrooks, C. et al. Oligosaccharyltransferase inhibition induces senescence in RTK-driven tumor cells. Nat. Chem. Biol.12, 1023–1030 (2016). - PMC - PubMed
    1. de Caestecker, C. & Macara, I. G. A size filter at the Golgi regulates apical membrane protein sorting. Nat. cell Biol.26, 1678–1690 (2024). - PubMed
    1. Fang, J. et al. Glucose-mediated N-glycosylation of RPTPalpha affects its subcellular localization and Src activation. Oncogene42, 1058–1071 (2023). - PubMed

MeSH terms