. 2025 Apr 14;16(1):3529.
doi: 10.1038/s41467-025-58655-z.

ICAM-1/CD18-mediated sequestration of parasitized phagocytes in cortical capillaries promotes neuronal colonization by Toxoplasma gondii

Affiliations

ICAM-1/CD18-mediated sequestration of parasitized phagocytes in cortical capillaries promotes neuronal colonization by Toxoplasma gondii

Matias E Rodriguez et al. Nat Commun. .

Abstract

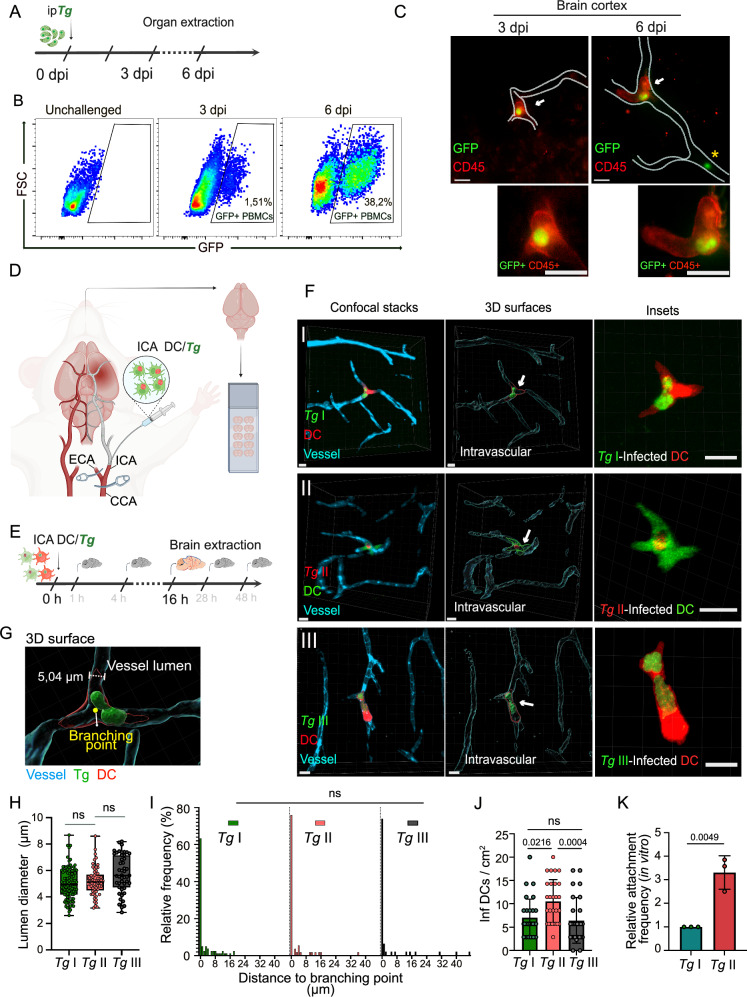
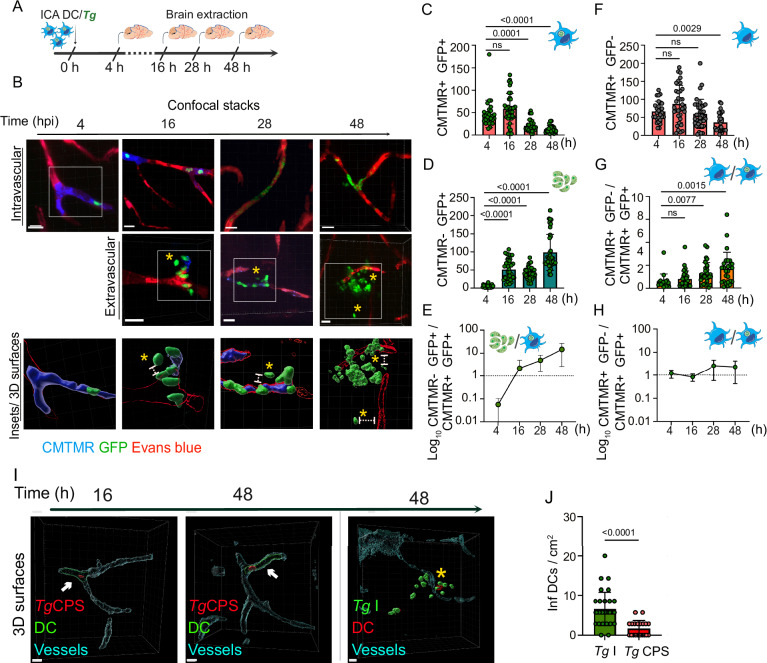
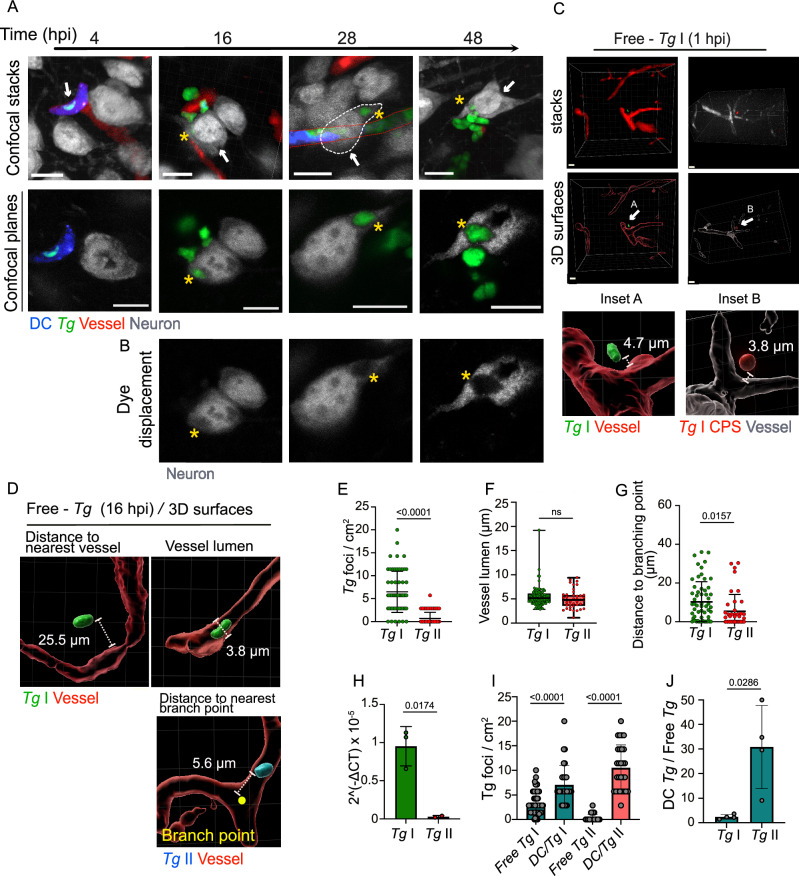
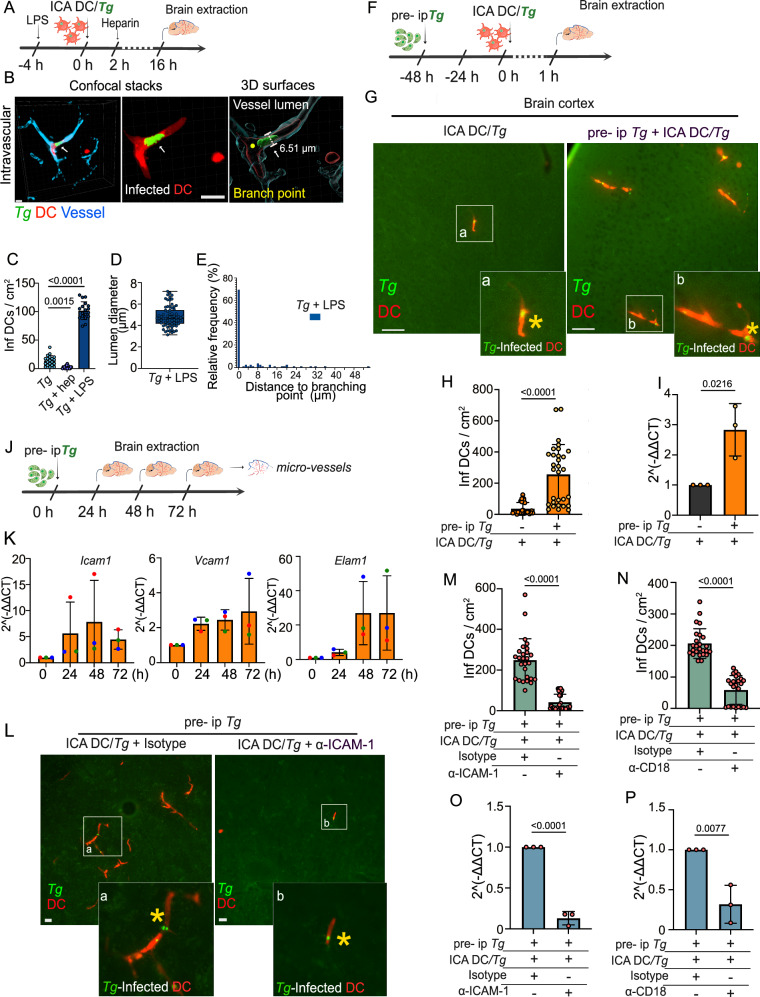
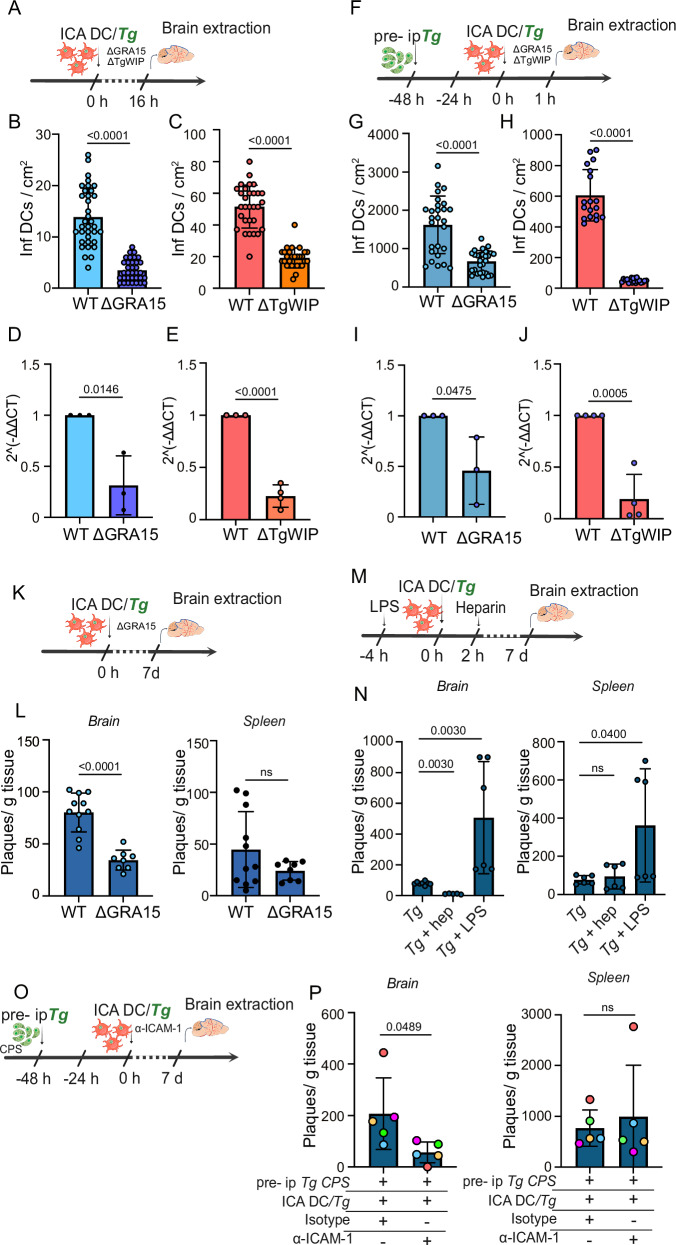
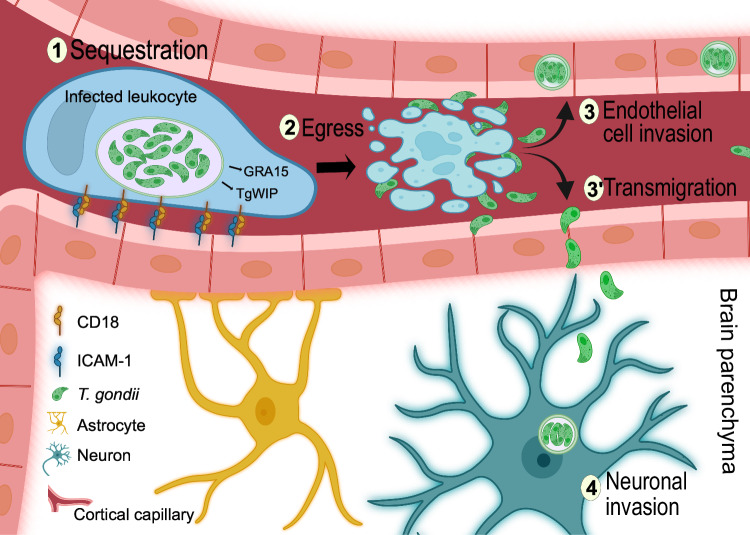
Microbial translocation across the blood-brain barrier (BBB) is a prerequisite for colonization of the central nervous system. The obligate intracellular parasite Toxoplasma gondii chronically infects the brain parenchyma of humans and animals, in a remarkably stealthy fashion. We investigated the mechanisms of BBB traversal by T. gondii (genotypes I, II, III) and T. gondii-infected leukocytes, using intracarotid arterial delivery into the cerebral circulation of mice. Unexpectedly, parasitized dendritic cells (DCs) and other peripheral blood mononuclear cells were found to persistently sequester within cortical capillaries. Post-replicative egress of T. gondii from sequestered DCs was followed by rapid parasite localization within cortical neurons. Infection-induced microvascular inflammation dramatically elevated the sequestration of parasitized DCs, while treatments targeting the ICAM-1/CD18 leukocyte adhesion axis with blocking antibodies strongly reverted sequestration. The parasite effectors TgWIP and GRA15, known to promote leukocyte hypermigration and inflammatory activation, further increased both the capillary sequestration of infected DCs and cerebral parasite loads in a strain-dependent manner. These findings reveal that the sequestration of parasitized leukocytes in cortical capillaries, with subsequent BBB traversal following parasite egress, provides a mechanism for T. gondii's rapid access to cortical neurons during primary infection.


Conflict of interest statement

Competing interests: The authors declare that no competing interests exist.

Figures

Fig. 1
Fig. 1. Sequestration of infected PBMCs and DCs in the brain microvasculature.
A Experimental set up. Freshly egressed GFP-expressing T. gondii (Tg) tachyzoites (PRU-GFP, 2 × 105 cfu) were inoculated ip in mice and organs were collected 3 or 6 days post-inoculation (dpi). B Representative flow cytometry plots of GFP vs forward scatter (FSC) show percentage of tachyzoite-associated PBMCs (GFP+) in unchallenged and infected mice 3 and 6 dpi (n = 3 mice). C Representative micrographs of brain cortex at 3 or 6 dpi. Mice were injected iv with α-CD45-Alexa 647 prior to organ extraction. Arrows indicate leukocyte (CD45+, red)-associated tachyzoites (GFP+, green). Dotted lines delimit cortical capillaries. Asterisk indicates tachyzoite (GFP+) non-associated to a leukocyte (CD45-). Lower panel insets show magnification of the leukocyte- associated tachyzoites. Scale bars: 10 µm. D Cartoon shows microsurgical procedure, as detailed in Methods, with injection of cell suspensions (DC/Tg) into the internal carotid artery (ICA), followed by brain extraction and tissue sectioning (50 µm thickness). Common carotid artery (CCA) and external carotid artery (ECA) are indicated. Created in BioRender. Pairoto, M. (2025) https://BioRender.com/e26i498. E Experimental set up. CFSE or CMTMR pre-labeled DCs were challenged in vitro with T. gondii (RH-GFP, MOI 1; ME49-RFP, MOI 2; CFSE-prelabelled CTG, MOI 2) to obtain a DC infection frequency of ∼50%. Infected DCs (~20 × 106 DCs / ~ 10 × 106 cfu Tg) were slowly (5 min) inoculated into the brain circulation via the ICA as detailed in Methods. Brains were extracted 16 h post-inoculation (hpi). F Confocal micrographs, with corresponding 3D surface analyses, show the localization of Tg type I RH (GFP, green)-infected DCs (CMTMR, red), Tg type II ME49 (RFP, red)-infected DCs (CFSE, green) and Tg type III CTG (CFSE, green)-infected DCs (CMTMR, red) in relation to the vascular marker Evans blue (cyan). Arrows indicate infected DCs magnified in the insets, respectively. Scale bars: 10 µm. G 3D surface analysis as in (F) of microvessel (cyan) with infected DC (red) with T. gondii vacuoles (green). Microvessel lumen diameter (5,04 µm) and vascular branching point are indicated. H, I Luminal diameter (H) and distance to nearest vascular branching point (I) of cortical microvessels containing T. gondii type I, II, and III-infected DCs, respectively. In box plots, center line indicates median. Box limits: 25th and 75th percentiles. Whiskers: maximum and minimum values. Data are from 86 (TgI), 61 (TgII), 47 (TgIII) -infected DCs per condition from three independent experiments (TgI n = 4 mice; TgII, TgIII n = 3 mice). J. Bar graph shows mean ( ± SEM) numbers of T. gondii type I, II or III-infected DCs related to cortical area, from 30 (TgI), 28 (TgII) and 27 (TgIII) cortical sections per condition from 3 independent experiments (n = 3 mice per condition). K Bar graph shows the relative attachment frequency of T. gondii type I- or type II-infected DCs to polarized brain endothelial cells (bEnd.3) in vitro. Data are expressed as mean ( ± SEM) from three independent experiments (n = 3 biological replicates). Statistical analyses: (HJ) Kruskal–Wallis test followed Dunn’s post-hoc test (K) 2-tailed unpaired Student’s t-test, numeric p-values are indicated, ns: non-significant, p > 0,05. Source data are provided as a Source Data file.
Fig. 2
Fig. 2. Replication and egress of T. gondii from sequestrated DCs precedes parenchymal localization.
A Experimental set up. CMTMR pre-labeled DCs were challenged in vitro with T. gondii (RH-GFP, MOI 1) to obtain a DC infection frequency of ∼50%. Infected DCs (20 × 106 DCs / 10 × 106 cfu Tg) were inoculated in the brain circulation via the ICA and brains collected 4, 16, 28 or 48 hpi. B Confocal micrographs, with corresponding 3D surface analyses, show the localization of RH (GFP+, green)-infected DCs (CMTMR+, blue) in relation to the vascular marker Evans blue (red) at 4, 16, 28 and 48 hpi. White boxes (insets) show infected DCs (CMTMR+ GFP+) and non-DC associated T. gondii foci with replicating tachyzoites (CMTMR- GFP+). Asterisks indicate extravascular non-DC associated T. gondii. Scale bars: 10 µm. C, D Graphs show the absolute numbers (mean ± SEM) of T. gondii-associated (infected) DCs (CMTMR+ GFP+) (C) and non-DCs associated T. gondii foci (CMTMR- GFP+) (D), respectively, per cm2 of cortical tissue. Data are from 24 (4 h), 36 (16 h), 37 (28 h) and 37 (48 h) cortical sections per timepoint from three independent experiments (n = 3 mice per condition). E Graph shows the Log10 ratio between infected DCs (CMTMR+ GFP+) and non-DCs associated T. gondii (CMTMR- GFP+) from (C, D). F Graphs show the absolute numbers (mean ± SEM) of non-infected DCs (CMTMR+; GFP-) per cm2 of cortical tissue. Data are from 28 (4 h), 34 (16 h), 36 (28 h) and 29 (48 h) cortical sections per timepoint from three independent experiments (n = 3 mice per condition). G, H Graphs show the mean ( ± SEM) ratio (G) and Log10 ratio (H) between non-infected DCs (CMTMR+; GFP-) and infected DCs (CMTMR+; GFP+), respectively. Data are from 19 (4 h), 34 (16 h), 32 (28 h), 26 (48 h) cortical sections per timepoint from three independent experiments (n = 3 mice per condition). I Confocal 3D surface analyses show intravascularly located (Evans blue, cyan) RH-CPS infected DCs (CFSE+; mCherry+) at 16 and 48 hpi (left panels) and extravascular RH-WT tachyzoites (GFP+) at 48 hpi (right panel). Arrows indicate infected DCs. Asterisk indicates DC CFSE+ remnant (ghost, red). Scale bars: 10 µm. J Bar graph shows, for RH-WT and RH-CPS, the absolute numbers (mean ± SEM) of T. gondii-infected DCs retrieved in cortical sections at 16 hpi. Data are from 30 cortical sections from 3 independent experiments (n = 3 mice). CH For each graph, cell and/or parasite cartoons indicate measured condition(s). CG Kruskal–Wallis followed by Dunn’s multiple comparisons test, (J) 2-tailed Mann–Whitney U-test, numeric p-values are indicated, ns: non-significant, p > 0,05. Source data are provided as a Source Data file.
Fig. 3
Fig. 3. Following sequestration of infected DCs, T. gondii is retrieved inside neurons.
A. Confocal micrographs show the localization of GFP-expressing RH tachyzoites (GFP+, green), DCs (CMTMR+, blue) and neurons (NeuN+, gray) in relation to the vascular marker Evans blue (red). Infected CMTMR pre-labeled DCs (20 × 106 DCs / 10 × 106 cfu Tg) were inoculated via the ICA and brains extracted at indicated time points. Upper panels show 3D projections from confocal stacks and lower panels show confocal planes. Arrows indicate infected NeuN+ cells. White and red dotted lines delineate neuronal cytoplasm and cortical capillary, respectively. Asterisks indicate GFP+ tachyzoites localized inside NeuN+ cells. Scale bars: 10 µm. B Confocal planes show displacement of NeuN signal (asterisks) by T. gondii tachyzoites in corresponding confocal planes in (A). C Confocal micrographs and corresponding 3D surfaces show the extravascular localization of RH wild type (GFP+, green) and non-replicative RH-CPS tachyzoites (mCherry+, red) in relation to the vascular marker Evans blue (red in left panels and white in right panels). 20 × 106 cfu of freshly egressed tachyzoites were inoculated via the ICA and brains were extracted 1 hpi. Arrows indicate extravascular tachyzoites. Magnifications are shown in insets A and B for RH and RH-CPS, respectively, with distances the nearest blood vessel. Scale bars: 10 µm. D 3D surface analyses illustrate extravascular and intravascular localization of tachyzoites (type I RH, GFP+, green and type II ME49, RFP+, cyan) in relation to the vascular marker Evans blue (red). 20 × 106 cfu of freshly egressed tachyzoites were inoculated via the ICA and brains were collected 16 hpi. Distance to the nearest vessel, vessel lumen and distance to the nearest branching point (yellow dot) are shown. E Graph shows the absolute numbers (mean ± SEM) of type I and II T. gondii foci per cm2 brain tissue at 16 hpi. Data are from 59 (TgI) and 56 (TgII) cortical sections per condition from three independent experiments (n = 4 mice per condition). F Luminal diameter of cortical microvessels containing T. gondii type I and type II tachyzoites, respectively. In box plots, center line indicates median. Box limits: 25th and 75th percentiles. Whiskers: maximum and minimum values. Data are from 89 (TgI) and 33 (TgII) T. gondii foci in cortical tissue per condition from three independent experiments (TgI: n = 4 mice; TgII n = 3 mice). G Distribution of distances to nearest vascular branching point (medians with 25th and 75th percentiles) of type I and II T. gondii retrieved in the cortical microvasculature. Data are from 59 (TgI) and 39 (TgII) T. gondii foci per condition from three independent experiments (n = 3 mice per condition). H Relative expression (qPCR) of T. gondii TgB1 gene at 16 hpi in cortices of mice challenged 20 × 106 freshly egressed type I or type II tachyzoites inoculated via the ICA. Data are expressed as mean ( ± SEM) from three independent experiments (n = 3 mice per condition). I Graphs show the absolute numbers (mean ± SEM) of T. gondii foci or infected DCs per cm2 brain tissue at 16 hpi. Mice were inoculated via the ICA with 10 × 106 cfu of freshly egressed tachyzoites of type I RH (Free TgI), type II ME49 (Free TgII) or 10 × 106 cfu of DCs pre-challenged with type I RH (DC/TgI) or type II ME49 (DC/TgII). Data are from 60 (free TgI), 30 (DC/TgI), 55 (free TgII) and 28 (DC/TgII) cortical sections per condition from three independent experiments (TgI: n = 4 mice; TgII n = 3 mice). J Ratios (mean ± SEM) between the relative numbers of infected DCs (from mice inoculated with DC/Tg) and T. gondii foci (from mice inoculated with Free Tg) retrieved in cortices for infections with RH (TgI) and ME49 (TgII), respectively. Data are from three independent experiments (n = 4 mice per condition). EJ 2-tailed Mann–Whitney U-test, (H) 2-tailed unpaired Student’s t-test, I Kruskal–Wallis followed Dunn’s multiple comparison test, numeric p-values are indicated, ns: non-significant, p > 0,05. Source data are provided as a Source Data file.
Fig. 4
Fig. 4. T. gondii-induced BBB inflammation promotes the sequestration of parasitized DCs.
A Experimental set ups. Infected CMTMR pre-labeled DCs (20 × 106 DCs / 10 × 106 cfu Tg, PRU-GFP) were inoculated via the ICA and brains collected 16 hpi. When indicated, mice were pre-treated with LPS ip or treated with heparin iv. B Confocal micrographs and corresponding 3D surfaces show T. gondii (PRU-GFP)-infected DCs (CMTMR+ GFP+, red/green) in the cortical vasculature (Evans blue, cyan) of LPS pre-treated animals. Scale bars: 10 µm. C Graph shows the absolute numbers (mean ± SEM) of infected DCs per cm2 of cortical tissue in control (Tg), heparin and LPS pre-treated conditions. Data are from 20 cortical sections per condition from three independent experiments (n = 3 mice per condition). D, E Mean vascular luminal diameter (D) and distance to nearest vascular branching point (E), respectively, of infected DCs retrieved in the cortical microvasculature in LPS pre-treated mice. In box plot, center line indicates median. Box limits: 25th and 75th percentiles. Whiskers: maximum and minimum values. Data are from 70 infected DCs from 20 cortical sections from three independent experiments (n = 3 mice). F Experimental set up. Mice were inoculated ip with 2 × 105 cfu of freshly egressed tachyzoites (ME49-RFP), (pre- ipTg) or control medium. After 48 h, infected CMTMR pre-labeled DCs (10 × 106 DCs / 5 × 106 cfu Tg, PRU-GFP) were inoculated via the ICA and brains collected 1 hpi. G Representative micrographs show T. gondii (PRU-GFP)-infected DCs (CMTMR+, GFP+) in cortical sections of control and pre-ip infected mice, respectively. Insets (a, b) show magnifications of white boxes and asterisks indicate infected DCs (CMTMR+ GFP+, red/green). Scale bars: 50 µm. H, I Graphs show the absolute numbers (mean ± SEM) of T. gondii (PRU-GFP)-infected DCs per cm2 brain tissue at 1 hpi (H) and the relative expression (qPCR) of TgB1 gene in brain tissue (I), respectively. Data are from 30 cortical sections from three independent experiments (n = 3 mice). J Experimental set up. Freshly egressed RFP-expressing T. gondii (Tg) tachyzoites (ME49-RFP, 2 × 105 cfu) or control medium were inoculated ip in mice, brains were extracted 24, 48 and 72 hpi and micro-vessels purified. K Relative mRNA expression (qPCR) of Icam1 (ICAM-1), Vcam1 (VCAM-1) and Elam1 (E-selectin) in brain micro-vessels at indicated time points. Data are expressed as mean ( ± SEM) from three independent experiments (n = 3 mice). L Representative micrographs show infected DCs (CMTMR+ GFP+) in the brain cortex of mice inoculated in the ICA with 10 × 106 DCs / 5 × 106 cfu Tg (PRU-GFP) plus α-ICAM-1 antibody or isotype. Mice were pre-infected ip with 2 × 105 cfu type II ME49-RFP tachyzoites. Insets (a, b) show magnifications of the infected DCs (CMTMR+, GFP+) and asterisks show tachyzoites. Scale bars: 20 µm. M, N Graphs show the absolute numbers (mean ± SEM) of T. gondii (PRU-GFP)-infected DCs per cm2 brain tissue at 1 hpi in mice following inoculation with DC/Tg plus α-ICAM-1 (M) or α-CD18 (N), respectively. Mice were pre-infected (pre- ip, ME49-RFP). Data are from 30 cortical sections per condition from three independent experiments (n = 3 mice). O, P Relative expression (qPCR) of T. gondii TgB1 gene in brain tissue of mice pre-ip (ME49-RFP) infected and inoculated in the ICA with infected CMTMR pre-labeled DCs (10 × 106 DCs / 5 × 106 cfu Tg, PRU-GFP) plus α-ICAM-1 (O) or α-CD18 (P), respectively. Data are expressed as mean ( ± SEM) from three independent experiments (n = 3 mice). C Kruskal–Wallis followed Dunn’s multiple comparison test, (HN) 2-tailed Mann–Whitney U-test, (IP) 2-tailed unpaired Student’s t-test, numeric p-values are indicated, ns: non-significant, p > 0,05. Source data are provided as a Source Data file.
Fig. 5
Fig. 5. T. gondii effectors TgWIP and GRA15 modulate the sequestration of parasitized DCs.
A. Experimental set up. CMTMR pre-labeled DCs were challenged with GFP-expressing wild type (WT), ΔGRA15 or ΔTgWIP tachyzoites, followed by inoculation into the brain circulation via ICA (20 × 106 DCs / 10 × 106 cfu Tg). Brains were collected 16 hpi. B, C Graphs show the absolute numbers (mean ± SEM) of infected DCs (CMTMR+, GFP+) per cm2 cortical tissue for PRU-WT versus PRUΔGRA15 (B) and RH-WT versus RHΔTgWIP (C), respectively. Data are from 30 cortical sections per condition from three independent experiments (n = 3 mice). D, E Relative expression (qPCR) of T. gondii TgB1 gene in brain tissue of mice inoculated with DC/Tg PRU-WT versus PRU ΔGRA15 (D) and RH-WT versus RH ΔTgWIP, respectively. Data are expressed as mean ( ± SEM) from three independent experiments (n = 3 mice). F Experimental set up. Mice were inoculated ip with 2 × 105 cfu of freshly egressed tachyzoites (ME49-RFP, pre- ipTg). After 48 h, infected CMTMR pre-labeled DCs (10 × 106 DCs / 5 × 106 cfu Tg, WT, ΔGRA15 or ΔTgWIP) were inoculated via the ICA and brains collected 1 hpi. G, H Graphs show the absolute numbers (mean ± SEM) of infected DCs (CMTMR+, GFP+) per cm2 cortical tissue for PRU-WT versus PRUΔGRA15 (G) and RH-WT versus RHΔTgWIP (H), respectively. Data are from 30 cortical sections per condition from three independent experiments (n = 3 mice). I, J Relative expression (qPCR) of T. gondii TgB1 gene in brain tissue of pre- ip infected mice inoculated with DC/Tg PRU-WT versus PRUΔGRA15 (I) and RH-WT versus RHΔTgWIP (J). Data are expressed as mean ( ± SEM) from three independent experiments (n = 3 mice). K Experimental set up. Infected CMTMR pre-labeled DCs (2 × 104 DCs / 1 × 104 cfu Tg, WT or ΔGRA15) were inoculated via the ICA and brains collected 7 dpi. L. Relative cerebral parasite loads in brain and spleen, respectively, upon challenge with PRU-WT and PRUΔGRA15, determined by plaquing assays. Data show number (mean ± SEM) of plaques per gram of tissue from four independent experiments (n = 4 mice). M Experimental set ups. Infected CMTMR pre-labeled DCs (2 × 104DCs / 1 × 104 cfu Tg, PRU-WT) were inoculated via the ICA and brains collected 7 dpi. When indicated, mice were pre-treated with LPS ip or treated with heparin iv. N Relative cerebral parasite loads in brain and spleen, respectively, of mice challenged with PRU-WT and pre/treated with LPS or heparin, determined by plaquing assays. Data show number (mean ± SEM) of plaques per gram of tissue from three independent experiments (n = 4 mice). O Experimental set up. Mice were inoculated ip with 10 × 106 cfu of freshly egressed non-replicative tachyzoites (RH-CPS-mCherry), (pre-ip Tg CPS). After 48 h, infected DCs (10 × 104DCs / 5 × 104 cfu Tg, PRU-WT) plus α-ICAM-1 or isotype control were inoculated via the ICA. Brains were collected 7 dpi. P Cerebral parasite loads in brain and spleen, respectively, of mice challenged with DC/Tg PRU-WT plus α-ICAM-1 (or isotype), determined by plaquing assays. Mice were pre-infected (pre- ip, RH-CPS mCherry). Data show number (mean ± SEM) of plaques per gram of tissue from five independent experiments. For each experiment, mice were challenged and treated pairwise (α-ICAM-1 or isotype control) and datapoints are color-coded accordingly (n = 5 mice). BH 2-tailed Mann–Whitney U-test, (DP) 2-tailed unpaired Student’s t-test, (N) One-way ANOVA followed by Bonferroni’s multiple comparison test, numeric p-values are indicated, ns: non-significant, p > 0,05. Source data are provided as a Source Data file.
Fig. 6
Fig. 6. Sequestration of T. gondii-infected leukocytes at the BBB facilitates CNS colonization.
The cartoon model illustrates the sequential processes involved in the CNS invasion by T. gondii, based on experimental data. 1 Initial adhesion: Circulating phagocytes infected with T. gondii adhere to the endothelium of cortical capillaries. This adhesion is mediated by ICAM-1/CD18 interactions, which facilitate the attachment of infected DCs. Microvascular inflammation, induced either by intraperitoneal infection with T. gondii or by LPS treatment, rapidly exacerbates the sequestration of infected leukocytes. In contrast, heparin treatment or treatments with blocking antibodies to ICAM-1 or CD18 reverse this sequestration. The T. gondii effectors TgWIP and GRA15, secreted into the cytosol of infected leukocytes, promote adhesion to the endothelium. 2 Intracellular replication and egress: After intracellular replication, tachyzoites egress from the sequestered leukocytes. In absence of parasite replication and egress, infected leukocytes remain sequestered for >48 h. 3 and 3’ Infection of endothelial cells or transmigration: Egressed tachyzoites can either infect endothelial cells or directly transmigrate across the endothelium. 4 Infection of neurons: Upon transmigration, T. gondii rapidly infects cortical neurons. Vacuoles with intra-neurally replicating parasites were retrieved 16 h after inoculation in the cerebral circulation. Additionally, experimental data indicate two alternative routes of CNS invasion, which are not depicted in the cartoon. First, T. gondii-infected DCs can directly transmigrate into the parenchyma. Second, circulating extracellular tachyzoites can either infect endothelium or directly transmigrate to the parenchyma following intracarotid or intravenous inoculation, without replication in the endothelium. However, the frequency of these alternative routes appears significantly lower than the primary pathway early during infection, which involves sequestration of parasitized leukocytes and parasite egress, followed by either endothelial cell invasion or transmigration across the endothelium. Created in BioRender. Pairoto, M. (2025) https://BioRender.com/i14p970.

Similar articles

Cited by

References

    1. Abbott, N. J., Ronnback, L. & Hansson, E. Astrocyte-endothelial interactions at the blood-brain barrier. Nat. Rev. Neurosci.7, 41–53 (2006). - PubMed
    1. Coureuil, M., Lecuyer, H., Bourdoulous, S. & Nassif, X. A journey into the brain: insight into how bacterial pathogens cross blood-brain barriers. Nat. Rev. Microbiol15, 149–159 (2017). - PubMed
    1. Wilhelm, I., Nyul-Toth, A., Suciu, M., Hermenean, A. & Krizbai, I. A. Heterogeneity of the blood-brain barrier. Tissue Barriers4, e1143544 (2016). - PMC - PubMed
    1. Gould, I. G., Tsai, P., Kleinfeld, D. & Linninger, A. The capillary bed offers the largest hemodynamic resistance to the cortical blood supply. J. Cereb. Blood Flow. Metab.37, 52–68 (2017). - PMC - PubMed
    1. Hossmann, K. A. Pathophysiology and therapy of experimental stroke. Cell Mol. Neurobiol.26, 1057–1083 (2006). - PMC - PubMed

MeSH terms

Substances

LinkOut - more resources