. 2025 Apr 14;16(1):3536.
doi: 10.1038/s41467-025-58772-9.

Genomic epidemiology and phylodynamics of Acinetobacter baumannii bloodstream isolates in China

Collaborators, Affiliations

Genomic epidemiology and phylodynamics of Acinetobacter baumannii bloodstream isolates in China

Qixia Luo et al. Nat Commun. .

Abstract

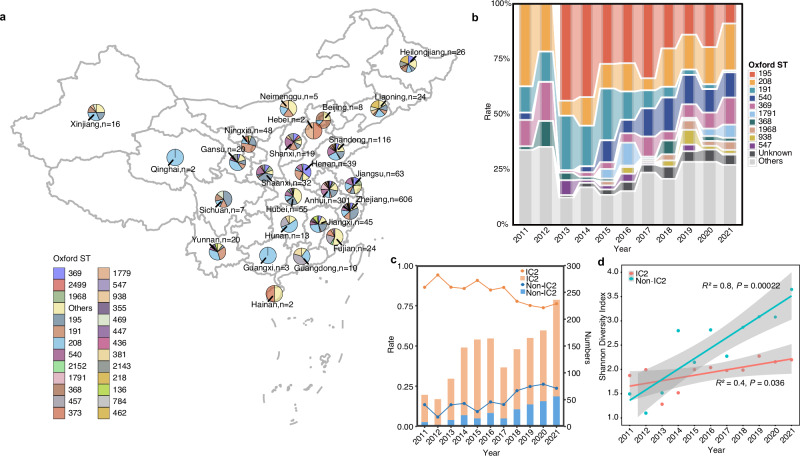
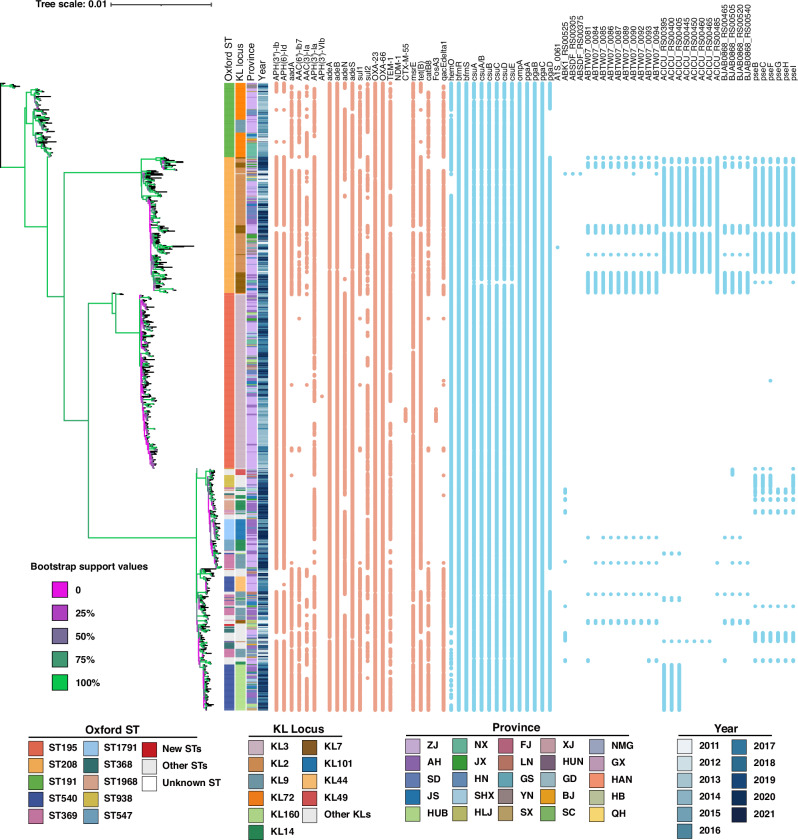
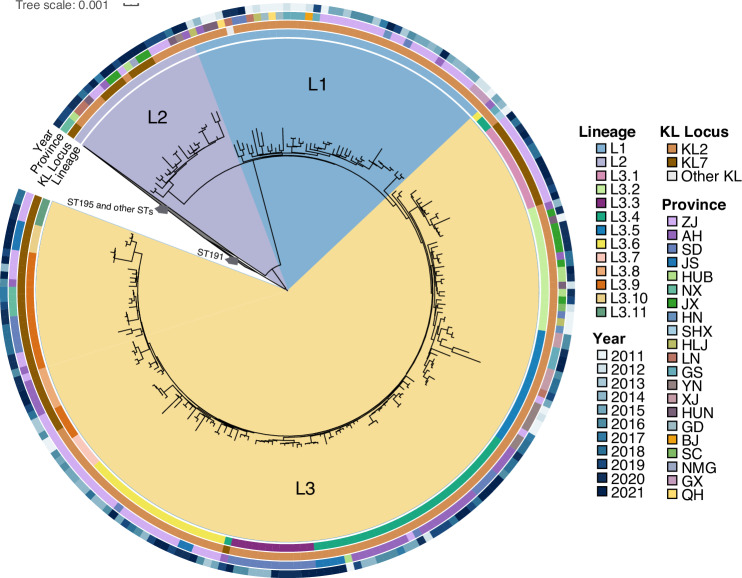
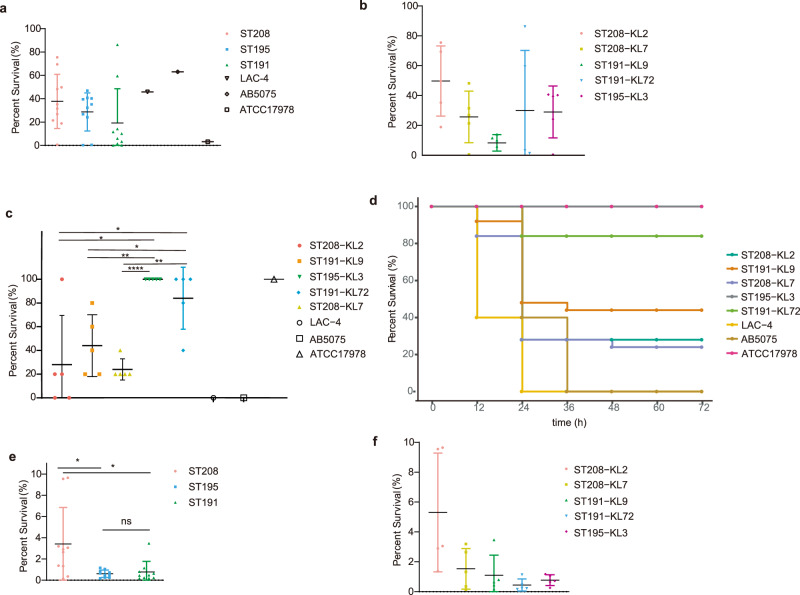
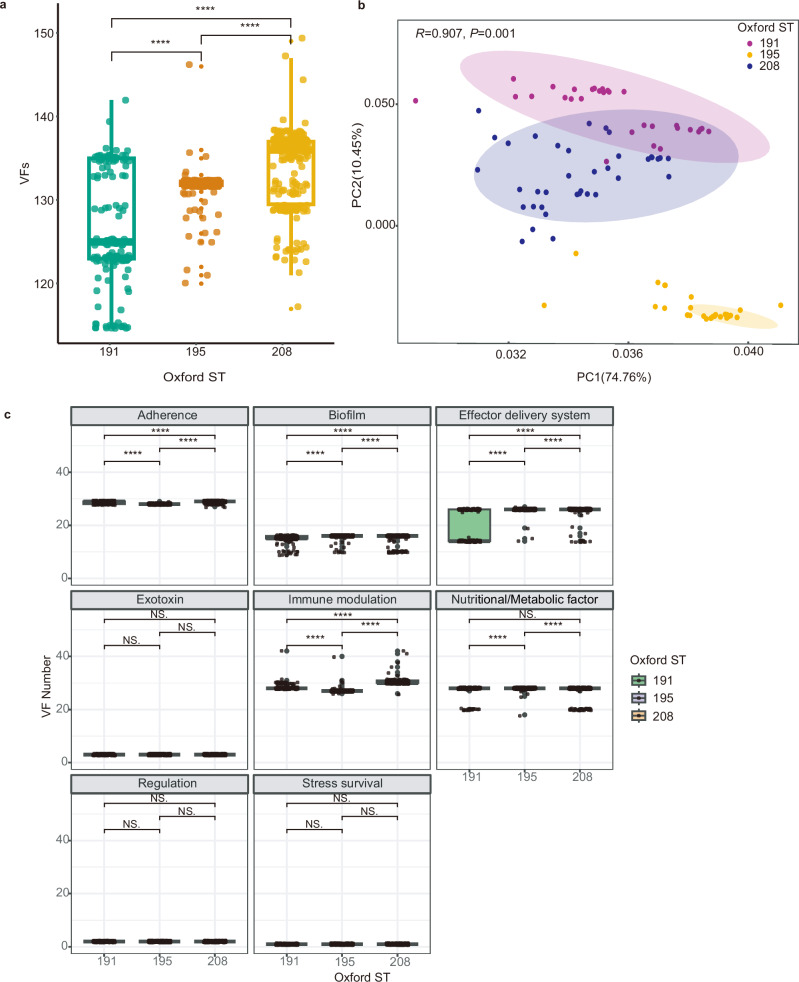
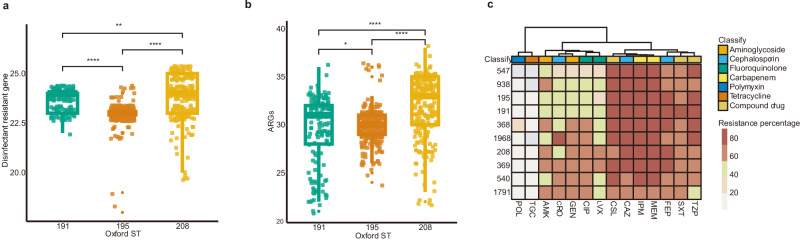
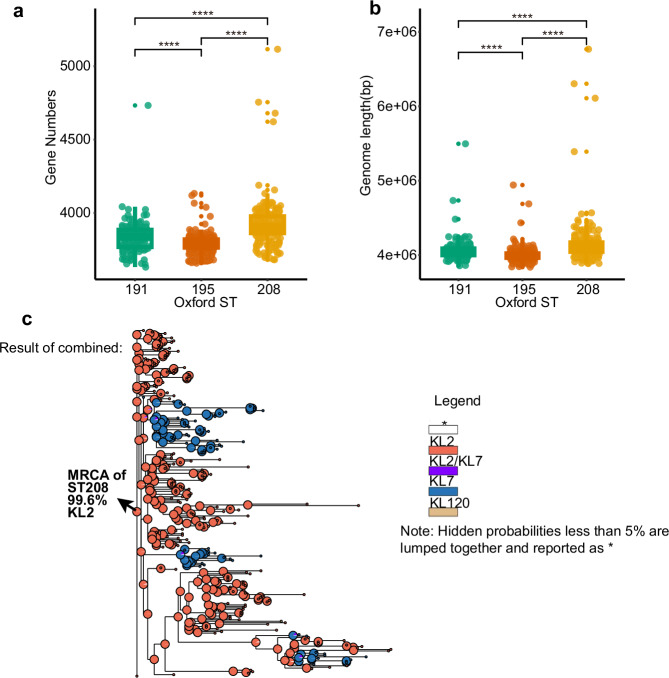
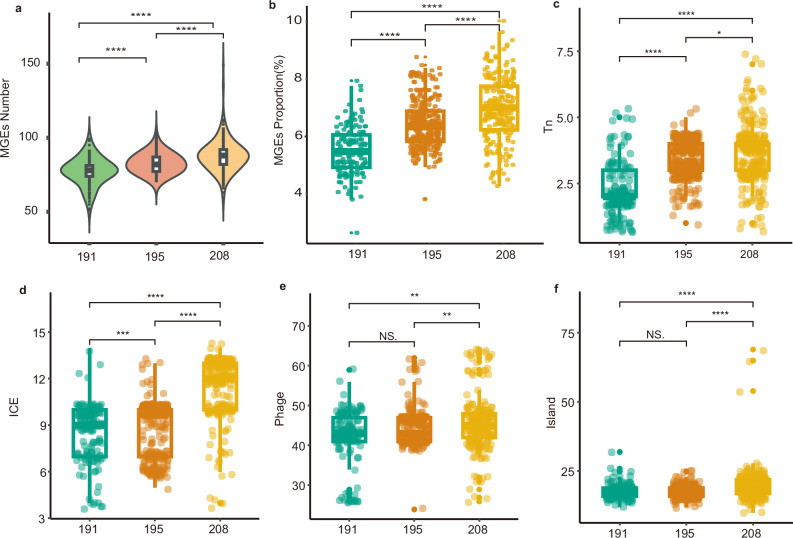
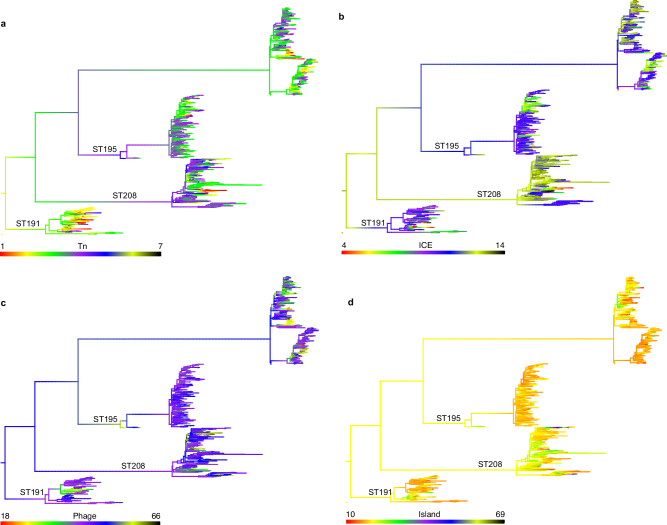
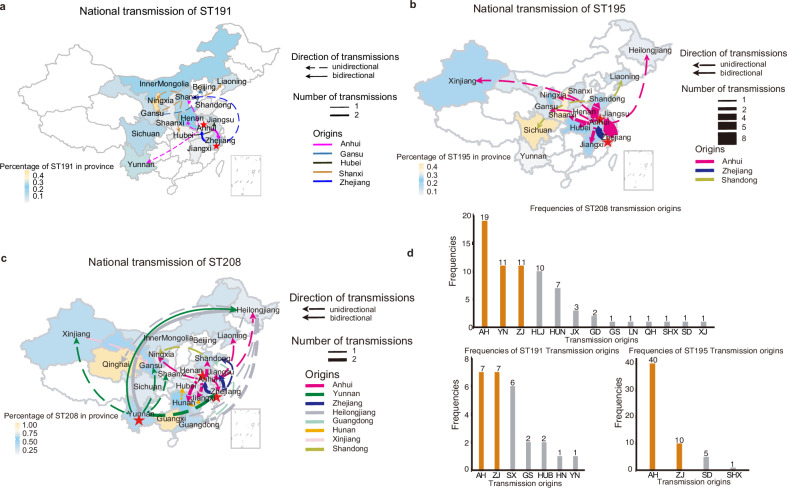
In recent decades, Acinetobacter baumannii has become a major global nosocomial pathogen, with bloodstream infections (BSIs) exhibiting mortality rates exceeding 60% and imposing substantial economic burdens. However, limited large-scale genomic epidemiology has hindered understanding of its population dynamics. Here, we analyzed 1506 non-repetitive BSI-causing A. baumannii isolates from 76 Chinese hospitals over a decade (2011-2021). We identified 149 sequence types (STs) and 101 K-locus types (KLs), revealing increased population diversity. International clone (IC) 2 accounted for 81.74% of isolates, with a notable shift in prevalent STs: ST208 increased while ST191 and ST195 declined, aligning with global trends. ST208 exhibited higher virulence, greater antibiotic resistance, enhanced desiccation tolerance, and more complex transmission patterns compared to ST191 and ST195. Its genomic plasticity drives its adaptation and spread. Using the high-resolution Oxford MLST scheme, this study uncovered greater diversity and genetic factors behind ST208's rise. A. baumannii is evolving from a low-virulence, multidrug-resistant pathogen to a more virulent one, highlighting the urgent need to address its growing threat. These findings have critical implications for infection control and public health policies.


Conflict of interest statement

Competing interests: The authors declare no competing interests.

Figures

Fig. 1
Fig. 1. Population structure, dynamics and spatiotemporal distribution of BSI-causing A. baumannii isolates in China.
a Clonal distribution of the 1,506 nonrepetitive A. baumannii isolates in 76 sentinel hospitals distributed across 25 provinces from 2011 to 2021. The map shows the prevalence of various STs in different regions, as represented by pie charts located at corresponding geographic locations. Each pie chart illustrates the proportion of specific STs in that region. The number next to each region’s name represents the total number of isolates analysed from that region. b Distribution of the top ten STs of A. baumannii from 2011 to 2021. The bar chart illustrates the yearly prevalence of various STs. The y-axis represents the percentage of each ST. The total number of isolates (n) for each year is indicated below the x-axis. Different colours represent different STs, as indicated in the legend on the right. c The number and proportion of IC2 and non-IC2 strains changed over time. d Increase in the population diversity of IC2 and non-IC2 A. baumannii-related BSI isolates in China between 2011 and 2021. The axes indicate the Shannon diversity index (Y-axis) and the year of isolation (X-axis). Dots represent the shannon diversity index of this type of A. baumannii ST type in this year. The shaded area surrounding the fitted linear regression line represent the 95% confidence interval based on the standard error of the mean slope of the regression line. The ST diversity of IC2 was significantly positively correlated with time (r = 0.4, p = 0.036). Non-IC2 ST diversity also showed a significant positive correlation with time (r = 0.8, p < 0.001), with a higher correlation coefficient than IC2. Source data are provided as a Source Data file.
Fig. 2
Fig. 2. Maximum likelihood phylogeny of IC2 BSI-causing A. baumannii isolates in this study, alongside the representative antimicrobial resistance genes and virulence genes.
The phylogenetic tree is rooted according to the A. baumannii XH857 (accession number: NZ_CP014540.1) outgroup. Branch lengths represent the number of nucleotide substitutions per site, as indicated by the scale bar. Branch colours represent the bootstrap support values. Orange or blue dots indicate that the gene exists in the corresponding strain, while blank indicate that it does not exist. Source data are provided as a Source Data file.
Fig. 3
Fig. 3. Subdivision of the ST208 lineage in the maximum likelihood phylogenetic tree of IC2.
We collapsed the branches corresponding to ST191, ST195, and other ST types, and focused on enlarging the internal lineage structure of the ST208 branch. ST208 could be divided into three lineages (L1-L3), with L3 further subdivided into 11 sub-lineages (L3.1-L3.11). ST208 lineages are labelled and are painted with different colours. The tree is surrounded by colour strips, indicating the lineages, KL locus, provinces and year, respectively. Source data are provided as a Source Data file.
Fig. 4
Fig. 4. Results of experimental study on toxicity and desiccation tolerance among ST208, ST191, and ST195 isolates.
Five isolates were randomly selected for each ST-KL combination to conduct experiments (Supplementary table 1). A. baumannii LAC-4, AB5075, and ATCC17978 were used as control strains. The results of the complement killing assay for different ST (a) and ST-KL (b) strains. The assay was triplicated, and the error bars represent standard deviations. Student’s t tests were used for pairwise group comparisons. The anti-complement killing ability of ST208 is greater than that of ST191 or ST195, but not significant (a, p > 0.05), and ST208-KL2 exhibits the strongest anti-complementary killing ability, but also not significant (b, p > 0.05). In vivo mouse infection model showing 72-h survival rates (c) and survival rates every 12 h (d) for different ST-KL combination strains. Five mice were injected with each strain. The error bars represent standard deviations (c). Student’s t-tests were used for pairwise group comparisons (c). The average survival rates of the mice infected with ST208-KL2, ST208-KL7, or ST191-KL9 were significantly lower than those infected with ST191-KL72 or ST195-KL3 (c, p < 0.05). Survival rates of different ST (e) and ST-KL (f) strains under 20% humidity. The assay was triplicated, and the error bars represent standard deviations. Student’s t tests were used for pairwise group comparisons. The desiccation tolerance of ST208 was significantly greater than that of ST191 or ST195 (e, p < 0.05), with ST208-KL2 exhibiting even greater desiccation tolerance (f). Source data are provided as a Source Data file. Notes: * indicates P < 0.05, ** indicates P < 0.01, *** indicates P < 0.001, **** indicates P < 0.0001.
Fig. 5
Fig. 5. Virulence-related genes in ST208 (n = 234) compared with those in ST191 (n = 148) and ST195 (n = 334).
a Number of virulence-related genes in ST208 compared with those in ST191 and ST195. The average number of virulence-related genes in the ST208 isolates was greater than that in the ST191 or ST195 isolates (133.90 ± 4.72 vs 126.44 ± 6.86 vs 131.79 ± 1.61, p < 1.6 × 10−11, Wilcoxon rank-sum test). b Principal component analysis (PCA) of virulence-related genes profile in strains ST208, ST195 and ST191. There are significant differences among the virulence genomes of ST191, ST195, and ST208, the virulence-related gene profile of ST195 showed greater disparity from that of either ST208 or ST191 (R = 0.907, p = 0.001, ANOSIM). c Comparison of the number of virulence-related genes in different functional categories in ST208, ST195 and ST191, the results showed significant differences in five virulence-related functions (p < 1 × 10−5, Wilcoxon rank-sum test). For (a, c), boxes show the median and interquartile range (IQR) while whiskers extend to a maximum of 1.5× IQR. Dots indicate outliers beyond whiskers. The statistical significance is shown by the number of asterisks as follows: ****p < 0.0001, NS. indicates no statistical significance. Source data are provided as a Source Data file.
Fig. 6
Fig. 6. Disinfectant tolerance and antibiotic resistance in isolates.
a The number of disinfectant tolerance-related genes in ST208 (n = 234) compared with those in ST191 (n = 148) and ST195 (n = 334). The average number of disinfectant tolerance-related genes in the ST191 isolates was significantly greater than that in the ST195 or ST208 isolates (24 vs 23 vs 23.79, p < 0.0078, Wilcoxon rank-sum test). b Number of antibiotic resistance-related genes (ARGs) in ST208 compared with those in ST191 and ST195. Compared with ST191 and ST195, ST208 presented significantly more ARGs (31.97 ± 3.23 vs 29.83 ± 1.67 vs 29.40 ± 3.65, p < 2.2 × 10−16, Wilcoxon rank-sum test). For (a, b), boxes show the median and interquartile range (IQR) while whiskers extend to a maximum of 1.5× IQR. Dots indicate outliers beyond whiskers. The statistical significance is shown by the number of asterisks as follows: *p < 0.05, **p < 0.01, ****p < 0.0001. c Heatmap of antimicrobial resistance rates among the main STs to 14 antibiotics (POL polymyxin B, TGC tigecycline, AMK amikacin, CRO ceftriaxone, GEN gentamicin, CIP ciprofloxacin, LVX levofloxacin, CSL cefperazone-Sulbactam, CAZ ceftazidime, IPM imipenem, MEM meropenem, FEP, cefepime, SXT sulfamethoxazole, TZP piperacillin-tazobactam). Source data are provided as a Source Data file.
Fig. 7
Fig. 7. Enhanced genomic plasticity contributes to the adaptation of ST208.
a Gene number distributions of the ST191, ST195 and ST208 isolates, ST208 presented significantly more gene number (p < 2.5 × 10−9, Wilcoxon rank-sum test). b Genome length distributions of the ST191, ST195 and ST208 isolates, ST208 presented significantly expanded genome (p < 4 × 10−7, Wilcoxon rank-sum test). For (a, b), boxes show the median and interquartile range (IQR) while whiskers extend to a maximum of 1.5× IQR. Dots indicate outliers beyond whiskers. Wilcoxon rank-sum test was used for statistical test between two groups. The statistical significance is shown by the number of asterisks as follows: ****p < 0.0001. c ST208 phylogenetic tree based on Bayesian Binary Markov Chain Monte Carlo (BMM) model. Each small coloured circle at the tips of the phylogenetic tree represents an isolate, with different colours indicating different KLs, as shown in the legend on the right. The pie chart of internal nodes represents the KL state of ancestral nodes inferred by BMM method. Hidden probabilities less than 5% are lumped together and reposted as * (white). Source data are provided as a Source Data file.
Fig. 8
Fig. 8. Mobile genetic elements (MGEs) distributions of the ST191 (n = 148), ST195 (n = 334), and ST208 (n = 234) isolates.
a Violin plots displayed MGEs number distribution of the ST191, ST195 and ST208 isolates, ST208 presented a significantly higher abundance of MGEs (p < 3.9 × 10−10). b MGEs distribution of the ST191, ST195 and ST208 isolates, ST208 exhibited a significantly higher proportion of MGEs (p < 3.5 × 10−10). The quantity distribution of transposons (Tn, c, p < 3.9 × 10−10), integrative conjugative elements (ICEs, d, p < 0.0009), phages (e, p < 0.0074), and islands (f, p < 4.6 × 10−8) in each isolate of ST191, ST195 and ST208. Statistical tests used Wilcoxon rank-sum test. For (a), violin plots show MGEs number distribution combined with boxes show the median and interquartile range (IQR) while whiskers extend to a maximum of 1.5× IQR. Dots indicate outliers beyond whiskers. For (b, f), boxes show the median and interquartile range (IQR) while whiskers extend to a maximum of 1.5× IQR. Dots indicate outliers beyond whiskers. The statistical significance is shown by the number of asterisks as follows: *p < 0.05, **p < 0.01, ***p < 0.001, ****p < 0.0001, NS. indicates no statistical significance. Source data are provided as a Source Data file.
Fig. 9
Fig. 9. Ancestral state reconstructions of MGEs with significant differences between ST208 and the other two prevalent STs (ST191 and ST195).
MGEs were mapped as continuous characters onto the phylogenetic tree of the genomes. Evolution was reconstructed via the R package phytools, including the number of Tns (a), ICEs (b), phages (c), and islands (d) identified per genome. The colours represent the number of MGEs detected per genome, as indicated by the colour bars. Source data are provided as a Source Data file.
Fig. 10
Fig. 10. ST208 was disseminated through multiple interprovincial transmission events.
National distributions and major transmission of ST191 (a), ST195 (b) and ST208 (c). The background colour of the map represents the proportion of isolates in each province. The dotted line represents one-way transmission, and the solid line represents two-way transmission. The thickness of the arrow represents the number of major transmission events. Lines of different colours represent the sources of transmission in different provinces, and the red asterisk indicates the central province of transmission. d The number of observed all transmissions originating from each region. The predominant sources (e.g. Zhejiang, Anhui and Yunnan) are highlighted in orange. The provinces represented on the x-axis are abbreviated using the first letters of their two-syllable names, such as ZJ for Zhejiang and AH for Anhui. Source data are provided as a Source Data file.

Similar articles

References

    1. Antimicrobial Resistance, C. Global burden of bacterial antimicrobial resistance in 2019: a systematic analysis. Lancet399, 629–655 (2022). - PMC - PubMed
    1. Luo, Q. et al. ESKAPE in China: epidemiology and characteristics of antibiotic resistance. Emerg. Microbes Infect. 2317915, 10.1080/22221751.2024.2317915 (2024). - PMC - PubMed
    1. Wang, M. et al. Clinical outcomes and bacterial characteristics of carbapenem-resistant acinetobacter baumannii among patients from different global regions. Clin. Infect. Dis.78, 248–258 (2024). - PMC - PubMed
    1. Organization, W. H. Antimicrobial resistance surveillance in Europe 2022–2020 data. (World Health Organization. Regional Office for Europe, 2022).
    1. Collaborators, G. B. D. A. R. Global mortality associated with 33 bacterial pathogens in 2019: a systematic analysis for the Global Burden of Disease Study 2019. Lancet400, 2221–2248 (2022). - PMC - PubMed

MeSH terms

Substances

LinkOut - more resources