. 2025 Apr 14;10(1):69.
doi: 10.1038/s41541-025-01103-2.

A systems biology approach to define SARS-CoV-2 correlates of protection

Affiliations

A systems biology approach to define SARS-CoV-2 correlates of protection

Caolann Brady et al. NPJ Vaccines. .

Abstract

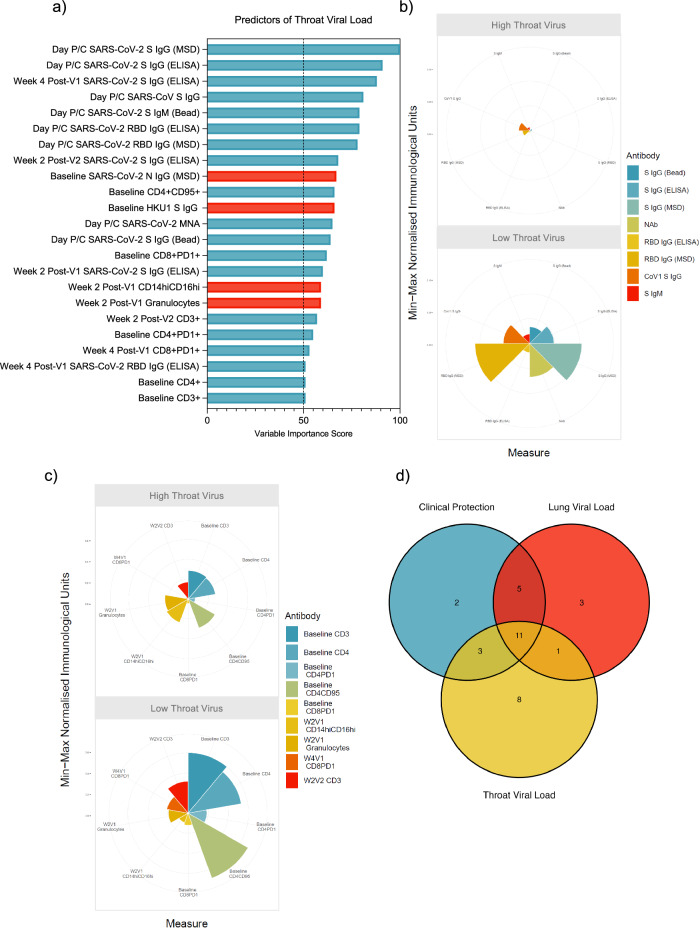
Correlates of protection (CoPs) for SARS-CoV-2 have yet to be sufficiently defined. This study uses the machine learning platform, SIMON, to accurately predict the immunological parameters that reduced clinical pathology or viral load following SARS-CoV-2 challenge in a cohort of 90 non-human primates. We found that anti-SARS-CoV-2 spike antibody and neutralising antibody titres were the best predictors of clinical protection and low viral load in the lung. Since antibodies to SARS-CoV-2 spike showed the greatest association with clinical protection and reduced viral load, we next used SIMON to investigate the immunological features that predict high antibody titres. It was found that a pre-immunisation response to seasonal beta-HCoVs and a high frequency of peripheral intermediate and non-classical monocytes predicted low SARS-CoV-2 spike IgG titres. In contrast, an elevated T cell response as measured by IFNγ ELISpot predicted high IgG titres. Additional predictors of clinical protection and low SARS-CoV-2 burden included a high abundance of peripheral T cells. In contrast, increased numbers of intermediate monocytes predicted clinical pathology and high viral burden in the throat. We also conclude that an immunisation strategy that minimises pathology post-challenge did not necessarily mediate viral control. This would be an important finding to take forward into the development of future vaccines aimed at limiting the transmission of SARS-CoV-2. These results contribute to SARS-CoV-2 CoP definition and shed light on the factors influencing the success of SARS-CoV-2 vaccination.


Conflict of interest statement

Competing interests: Author S.L. serves as an Associate Editor of this journal and had no role in the peer-review or decision to publish this manuscript. All other authors declare no financial or non-financial competing interests.

Figures

Fig. 1
Fig. 1. Schematic of pre-clinical study timeline.
The day of challenge post-immunisation is D0. The immunisation strategies varied. For two dose regimens, there was a 28 day interval between vaccine dose one (V1) and two (V2). There was a 28 day interval between second/only vaccine dose and challenge, in all but the FIV group, that were challenged 14 days post-FIV vaccination. There was also a 28 day interval between the primary challenge (C1) and secondary challenge (D0) in the re-challenged cohort. During acute infection, nasal and throat swabs were collected for qPCR. Animals were culled 6-8 days (D6-D8) post-challenge, and the lungs were harvested.
Fig. 2
Fig. 2. SARS-CoV-2 challenge outcome analysis.
Box and whisker plots demonstrating the success of each immunisation strategy for a clinical protection determined using a histopathology scoring system, b limiting lung viral burden determined by BAL PCR 6-8 days post-challenge, c controlling throat viral load over the course of infection (area-under-the curve of the throat swab PCRs) (d) controlling nasal viral load over the course of infection (area-under-the curve of the nasal swab PCRs). Each datapoint represents an animal. Box plots show the group median and inter-quartile range (IQR), and whiskers connect the maximum and minimum values, extending no further than 1.5x IQR (data beyond whiskers are outliers). Kruskal Wallis test and Dunn’s multiple comparisons test performed. Two-tailed Spearman correlations between lung histopathology scores and immune responses with 95% confidence intervals (e) spike IgG, f neutralising antibody, g ELISpot. AUC area under the curve, P/C post-challenge.
Fig. 3
Fig. 3. SARS-CoV-2 challenge clinical outcome analysis.
a Venn diagram showing the agreeance, or lack thereof, between each outcome post-challenge. b Variables of importance for clinical protection – predictors of protection in blue and predictors of pathology in red. c Polar plot showing the difference in magnitude of the humoral responses between the protected and pathology groups. The abundance of (d) baseline CD4+ T cells phenotyped by flow cytometry predicting protection and e CD14hiCD16hi monocytes two weeks post-V2 predicting pathology. Datapoints represent each animal, and the bars show group means with standard deviation. Two-sided Mann Whitney test performed.
Fig. 4
Fig. 4. Immune predictors of lung viral load post-SARS-CoV-2 challenge.
a Variables of importance for lung viral load –predictors of low viral load in blue. b Polar plot showing the difference in magnitude of the humoral responses between the low and high lung viral load groups. c Spike IgM on the day pre-challenge predicts low lung virus (d) SARS-CoV-2 reactive PBMCs two weeks post-V1 predict low lung virus. Datapoints in bar charts represent each animal, and bars show group means with standard deviation. Two-sided Mann Whitney test performed.
Fig. 5
Fig. 5. Protection against high viral burden in the upper respiratory tract.
a Variables of importance for throat viral control – predictors of low viral load in blue and predictors of high viral load in red. b Polar plot showing the difference in magnitude of the humoral responses between the low and high viral load groups. c Polar plot showing the difference in magnitude of the cellular frequency between the low and high viral load groups. d Venn diagram showing the overlap of variables of importance for each of the modelled outcomes.
Fig. 6
Fig. 6. Immune predictors of the magnitude of the spike IgG response post-immunisation.
Predicting magnitude of spike IgG responses (a) Variables of importance for spike IgG titres–predictors of high spike IgG titresin blue and predictors of low spike IgG titres in red. b Polar plot showing the difference in magnitude of the immune responses that predict high or low spike IgG titres.

References

    1. Rogers, T. F. et al. Isolation of potent SARS-CoV-2 neutralizing antibodies and protection from disease in a small animal model. Sci. (N. Y., NY)369, 956–963 (2020). - PMC - PubMed
    1. Corbett, K. S. et al. Immune correlates of protection by mRNA-1273 vaccine against SARS-CoV-2 in nonhuman primates. Science373, eabj0299 (2021). - PMC - PubMed
    1. Zost, S. J. et al. Potently neutralizing and protective human antibodies against SARS-CoV-2. Nature584, 443–449 (2020). - PMC - PubMed
    1. Baum, A. et al. REGN-COV2 antibodies prevent and treat SARS-CoV-2 infection in rhesus macaques and hamsters. Science370, 1110–1115 (2020). - PMC - PubMed
    1. Weinreich, D. M. et al. REGEN-COV Antibody Combination and Outcomes in Outpatients with Covid-19. N. Engl. J. Med.385, e81 (2021). - PMC - PubMed

LinkOut - more resources