. 2025 May;26(10):2767-2791.
doi: 10.1038/s44319-025-00447-z. Epub 2025 Apr 14.

Group A Streptococcal asparagine metabolism regulates bacterial virulence

Affiliations

Group A Streptococcal asparagine metabolism regulates bacterial virulence

Abhinay Sharma et al. EMBO Rep. 2025 May.

Abstract

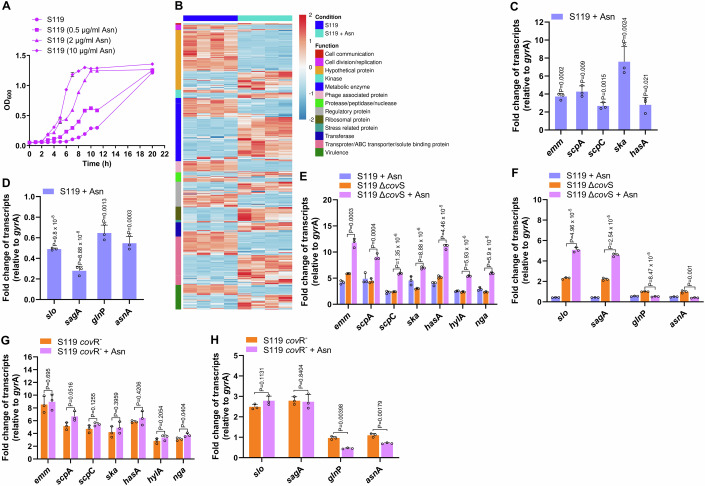
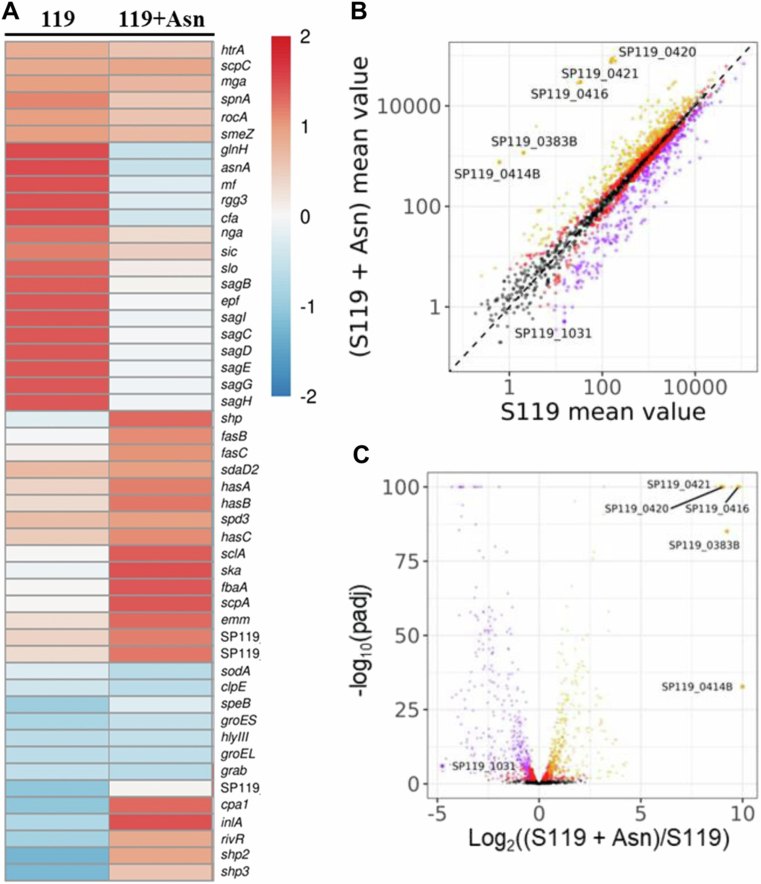
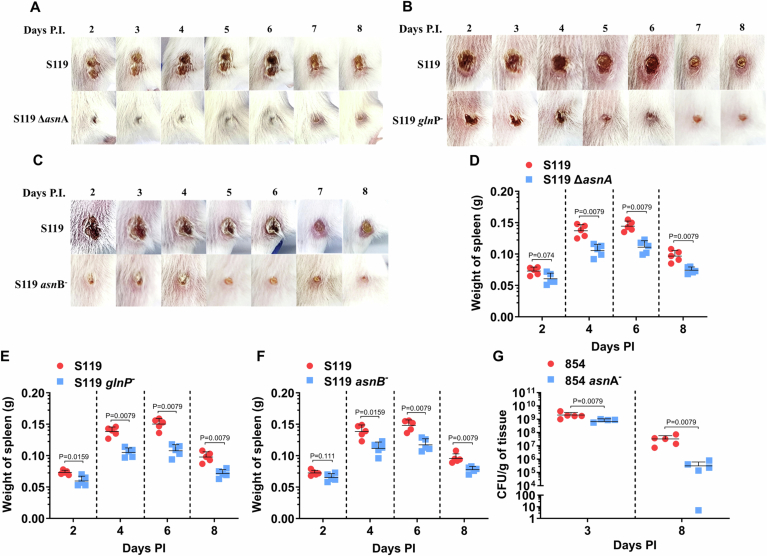
Group A Streptococcus (GAS) causes various human diseases linked to virulome expression predominantly regulated by the two-component system (TCS), CovR/S. Here, we demonstrate that asparagine (Asn) presence in a minimal chemically defined medium increases virulence gene expression in a CovR-dependent fashion. It also decreases the transcription of asparagine synthetase (AsnA), the ABC transporter responsible for Asn uptake (GlnPQ), and that of the hemolysin toxins responsible for scavenging Asn from the host. Metabolomics data show that Asn availability increases intracellular ADP/ATP ratio, which enhances phosphatase activity in structurally related CovS sensors and is probably responsible for the Asn-mediated decrease in CovR phosphorylation. Mutants deficient in AsnA, GlnPQ, asparaginase, (AsnB) activities are attenuated in a mouse model of human GAS invasive soft tissue infection. The similarity between the mechanisms of Asn-mediated regulation of GAS virulence and tumor growth suggests that, as in cancer, components maintaining Asn homeostasis could be targeted for anti-GAS treatments.

Keywords: Asparagine; Group A Streptococcus; Metabolism; Regulation Mechanism; Virulence.


Conflict of interest statement

Disclosure and competing interests statement. The authors declare no competing interests.

Figures

Figure 1
Figure 1. Asn affects GAS growth and transcription.
(A) The growth of the GAS strain S119 was determined in CDM in the absence or presence of Asn (0.5, 2, 10 µg ml−1). (B) The heatmap shows differential gene expression patterns based on RNA-seq data. Data illustrates the global differential expression of genes belonging to the indicated different functional categories. (C, D) Quantitative real-time PCR (qRT-PCR) validations of mRNA-seq data were performed. Upregulated (emm, scpA, scpC, ska, and hasA) (C) and downregulated genes (slo, sagA, glnP, and asnA) (D) are presented. The determinations were performed on the three RNA samples used for the RNAseq experiment. (EH) qRT-PCR determinations of Asn effect on the transcription of selected genes (emm, scpA, scpC, ska, hasA, hylA, nga) Set 1 (E, G), (slo, and sagA, asnA, glnP) Set 2 (F, H), in S119 and its derived ΔcovS (E, F) and covR (G, H) mutants in CDM without or with Asn (10 µg ml−1). In all qRT-PCR data, transcript abundance for each gene was normalized to that of gyrA in each sample, and fold change was calculated in comparison with the normalized transcript abundance of the S119 grown without Asn (CH). Data information: Three (A, CH) and four (B) biological replicates were used. The values shown represent the means ± SD. Statistical analysis was performed using an unpaired two-tailed t test (CH). Source data are available online for this figure.
Figure 2
Figure 2. asnA is essential for Asn-mediated gene regulation.
(A) The strains S119 and S119ΔasnA were grown in CDM in the absence or presence of Asn (10 µg ml−1) or dipeptide (Ala-Asn) (100 µg ml−1), and OD600 was determined at indicated time intervals. (B, C) qRT-PCR determinations of Set 1 (B) and Set 2 (C) of S119 and S119 ΔasnA genes were performed as in Fig. 1. (B, C) Data information: Three biological replicates were used (AC). The data shown represent the means ± SD. Statistical analysis was performed using an unpaired two-tailed t test (B, C). Source data are available online for this figure.
Figure 3
Figure 3. glnP and asnB are essential for Asn-mediated gene regulation.
(A) The growth of S119, S119 glnP and S119 glnP-pLZglnP in CDM in the absence or presence of Asn (10 and 100 µg ml−1) was determined at indicated time points. (B) S119 or its glnPderived mutant GAS was cultured in CDM without Asn to OD600 = 0.2, and then Asn was added. The Asn concentration in the medium was determined by LC-MS at 5, 30, and 60 min after Asn addition. (CF) qRT-PCR determinations were performed on Set 1 (C, E) and Set 2 of genes (D, F) comparing S119 and S119 glnP (C, D) and S119 and S119 asnB (E, F) grown in CDM without or with Asn. In all qRT-PCR data, transcript abundance for each gene was normalized to that of the GAS S119 strain without Asn (CF). Data information: Three (A, CF) and five (B) biological replicates were used. The values shown represent the means ± SD. Statistical analysis was performed using two-way ANOVA (B) unpaired two-tailed t test (CF). Source data are available online for this figure.
Figure 4
Figure 4. Asn reduces the phosphorylation of CovR.
(A, B) ScpC activity in culture media. Culture media of S119 (A), or its ΔcovS-derived mutant (B), were collected after growth in the absence or presence of Asn or/and LL-37 and then subjected to ScpC-mediated cleavage of recombinant human IL-8 followed by SDS-PAGE on Tris-tricine gels. The gels were visualized using Coomassie blue staining. (C, D) The determinations of IL‐8 residual content in the supernatants of the indicated strains cultured without or with Asn or/and LL-37 were conducted by ELISA. The IL‐8 residual content in all supernatants was normalized to that of the GAS S119 strain without Asn (C, D). (E, G) Asn reduced CovR phosphorylation. The indicated strains were grown in CDM without or with Asn or/and LL-37. Cell lysates (E, G) were separated by Phos-Tag SDS-PAGE, with unphosphorylated (lane 1, from left) and phosphorylated recombinant CovR protein (lane 2, from left) (E), CovR species were detected using an anti-CovR antibody and visualized using a fluorescently labeled secondary antibody (E, G). (F, H) The percentages of CovR-P of total CovR protein were calculated using ImageJ. Data information: Three (C, D, G, H) and two (E, F) biological replicates were used. The values shown represent the means ± SD. Statistical analysis was performed using an unpaired two-tailed t test (B, D, H). Source data are available online for this figure.
Figure 5
Figure 5. asnA, glnP, and asnB mutants are attenuated in the sublethal murine model of human NF.
(AC) BALB/c mice were injected with a sub-lethal dose of GAS through a subcutaneous (SC) route. CFU counts per gram of soft tissue derived from mice infected with S119 ΔasnA (A), S119 glnP (B), and S119 asnB (C) compared to the wild-type bacteria S119 were enumerated at indicated time points. (DF) CFU counts per gram of spleen derived from mice after subcutaneous infection with S119 ΔasnA (D), S119 glnP (E), and S119 asnB (F) compared to S119 were determined at indicated time points. (GI) Lesion areas of mice infected with S119 ΔasnA (G), S119 glnP (H), and S119 asnB (I) compared to S119 were determined at different time points post-infection. Data information: Five mice per group per data point were used (AI). The values shown represent the means ± SD. Statistical analysis was performed using the Mann–Whitney U test (AF) and two-way ANOVA (GI). Source data are available online for this figure.
Figure 6
Figure 6. Elucidation of the mechanism by which Asn metabolism controls GAS virulence.
(A, C) Intracellular metabolites: The relative amounts of intracellular Asn (A) and ATP (C) of the indicated strains grown in CDM or CDM supplemented with Asn were determined. (B) Determination of the intracellular intermediates along the glycolytic metabolic pathway: The measurements were conducted for the S119 strain grown in CDM or CDM-supplemented with Asn to OD600 = 0.35 or 0.7. (D) The indicated strains’ intracellular ADP/ATP ratio grown in CDM or CDM supplemented with Asn was determined. (E) Schematic representation of the mechanism controlling the regulation of CovR phosphorylation by modulating the intracellular ADP/ATP ratio in response to Asn in the WT S119 and its derived mutants. Data information: Five biological replicates were used (AD). The values shown represent the means ± SD. Statistical analysis was performed using an unpaired two-tailed t test (AD). Source data are available online for this figure.
Figure EV1
Figure EV1. Asn regulates GAS transcriptome.
(A) The heatmap represents the expression profile of genes, including virulence factors regulated by CovR/S directly or indirectly. (B, C) Visualization of mRNA-seq data. (B) A scatterplot matrix of the RNAseq data. Each dot represents a normalized mean value of the transcript number of the gene. (C) A Volcano plot of the same data set; each dot represents a gene with adjusted P < 0.05. as in Fig. 1. Data information: Four biological replicates were used (AC).
Figure EV2
Figure EV2. asnA is essential for Asn-mediated gene regulation.
(A) The growth curves of stains S119, S119ΔasnA, S119ΔasnA-pLZasnA, and S119ΔasnA-pLZasnA arg100lys. (B, C) qRT-PCR determinations for Set 1 (B) and Set 2 (C) were conducted as described in Fig. 2. (D) The growth of the GAS 854 strain and its asnAderived mutant was monitored in CDM at indicated times. (E, F) qRT-PCR determinations for genes of Set 1 (E) and genes of Set 2 (F) were determined as described in Fig. 1. (H, I) RocA is not involved in Asn-mediated effects. The growth (G) and qRT-PCR determinations for Set 1 (H) slo and sagA, and (I) for S119 and its ΔrocA-derived mutant were performed as described above. Data information: Three biological replicates were used (AI). The data shown represent the means ± SD. Statistical analysis was performed using an unpaired two-tailed t test (B, C, E, F, H, I). Source data are available online for this figure.
Figure EV3
Figure EV3. glnP and asnB are essential for Asn-mediated gene regulation.
(A) The growth of S119 and S119 glnP in the absence or presence of Asn was determined (see Fig. 3B for the experimental details). (B, C) qRT-PCR determinations were conducted on Set 1 (B) or Set 2 of genes (C) using the indicated strains in CDM without or with Asn. (D) The asnB transcript is unaffected by the presence or absence of Asn or by the deficiency of AsnA or GlnPQ activities. qRT-PCR determinations of asnB transcript abundance were conducted as in (B, C). (E) Asparaginase activity (AsnB) was determined in the cell pellets of the indicated strains grown in THY. The asparaginase activity of WT S119 was used as a control. (F) The growth of the indicated strains was monitored in CDM in the absence or presence of Asn (10 and 100 µg ml−1). (G and H) qRT-PCR determinations of Set 1 (G) and Set 2 (H), genes of the indicated strains grown in CDM without or with Asn. For all qRT-PCR data, fold change was calculated by comparing with normalized transcript abundance in the GAS S119 strain without Asn. (I) A graphical representation summarizes the orchestrated interplay between asnA, glnP, and asnB genes to maintain the balance of intracellular Asn in GAS. Data information: Three biological replicates were used (AH). The data shown represent the means ± SD. Statistical analysis was performed using an unpaired two-tailed t test (BE, G, H). Source data are available online for this figure.
Figure EV4
Figure EV4. Functional assays and in-vitro phosphorylation of CovR.
(A, B) Degradation of recombinant C5a by cultures supernatant containing the C5a-peptidase enzyme (ScpA). GAS was grown in CDM without or with Asn or/and LL-37. Supernatants of the indicated strains were incubated with recombinant human C5a, resolved on Tris-tricine gels, and visualized by Coomassie blue staining. M represents a marker, and an empty arrow is the cleaved C5a. The data are representative of two independent experiments. (C, D) Quantitation of IL-8 degradation by ScpC present in the supernatants of the indicated strains by ELISA. The IL‐8 residual content in all supernatants was normalized to that of the GAS 5448 (C) and 854 (D) strain without Asn. (E) Asn does not affect in-vitro CovR phosphorylation. Purified CovR was incubated in the absence (−) and presence (+) of acetyl phosphate (Ac-P) as a phosphate donor and the indicated concentrations of Asn (µg ml−1). The protein samples were resolved on Phos-tag SDS-PAGE gel and visualized. Data information: Three biological replicates were used (C, D). The data shown represent the means ± SD. Statistical analysis was performed using an unpaired two-tailed t test (C, D). Source data are available online for this figure.
Figure EV5
Figure EV5. asnA, glnP, and asnB mutants are attenuated in the sublethal murine model of human NF.
(AC) Mice were injected subcutaneously, and representative images of lesion progression at indicated time points after infection with S119 ΔasnA (A), S119 glnP (B), and S119 asnB (C), compared to WT S119 are shown. (DF) Spleen weight of mice infected subcutaneously with S119 ΔasnA (D), S119 glnP (E), and S119 asnB (F), in comparison to S119, was determined. (DG) The deletion of asnA produces an attenuated mutant in GAS strain 854. Mice were infected subcutaneously, and CFU counts per gram of soft tissue infected with 854 asnA compared to the wild-type, 854 were enumerated at indicated time intervals. Data information: Five mice per group per data point were used (DG). The values shown represent the means ± SD. Statistical analysis was performed using the Mann–Whitney U test (DG). Source data are available online for this figure.
Figure EV6
Figure EV6. Coupling of metabolism to virulence.
(A, B) The probabilistic principal component analyses (PCA) for the indicated pairs of strains grown in CDM or CDM supplemented with Asn to OD600 = 0.35 (A) or 0.7 (B). (C, D) Each circle represents one sample. Pink and yellow indicate S119 with and without Asn, respectively; blue and sky blue S119 glnP with and without Asn; and red and green S119 asnB with and without Asn. (C, D) Extracellular metabolite, Asn (C) content was determined for the indicated strains grown in CDM or CDM-supplemented with Asn to OD600 = 0.35 or 0.7. (D) The relative amount of glucose was determined for the indicated strains grown in CDM or CDM supplemented with Asn at OD600 = 0.35 or 0.7. (E) The relative amount of intracellular glucose was determined as above at OD600 = 0.35 or 0.7. Data information: Five biological replicates were used (AE). The values shown represent the means ± SD. Statistical analysis was performed using an unpaired two-tailed t test (CE). Source data are available online for this figure.

Similar articles

References

    1. Allaw F, Wehbe S, Kanj SS (2024) Necrotizing fasciitis: an update on epidemiology, diagnostic methods, and treatment. Curr Opin Infect Dis 37:105–111 - PubMed
    1. Allen U, Moore D (2010) Invasive group A streptococcal disease: management and chemoprophylaxis. Paediatr Child Health 15:295–302 - PMC - PubMed
    1. Anand A, Sharma A, Ravins M, Biswas D, Ambalavanan P, Lim KXZ, Tan RYM, Johri AK, Tirosh B, Hanski E (2021) Unfolded protein response inhibitors cure group A streptococcal necrotizing fasciitis by modulating host asparagine. Sci Transl Med 13:eabd7465 - PubMed
    1. Anaya DA, Dellinger EP (2007) Necrotizing soft-tissue infection: diagnosis and management. Clin Infect Dis 44:705–710 - PubMed
    1. Bagcchi S (2023) Surge of invasive group A streptococcus disease. Lancet Infect Dis 23:284 - PubMed

MeSH terms

LinkOut - more resources