. 2025 Jun;7(6):1223-1245.
doi: 10.1038/s42255-025-01267-0. Epub 2025 Apr 14.

Protein-responsive gut hormone tachykinin directs food choice and impacts lifespan

Affiliations

Protein-responsive gut hormone tachykinin directs food choice and impacts lifespan

Nadja Ahrentløv et al. Nat Metab. 2025 Jun.

Abstract

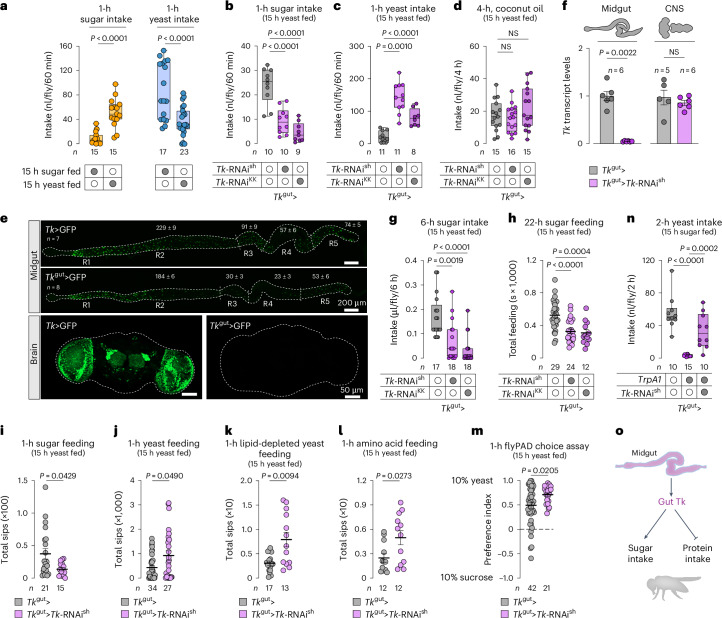
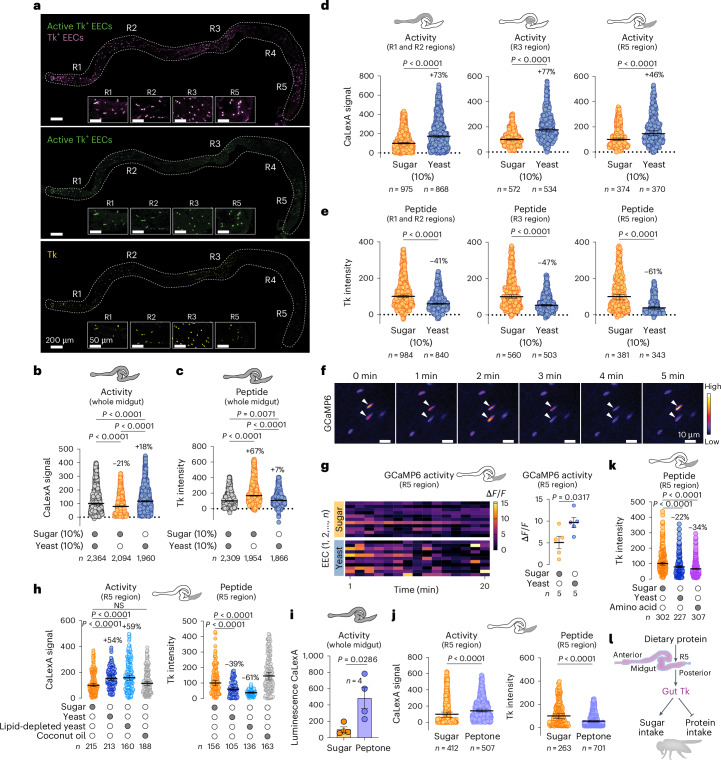
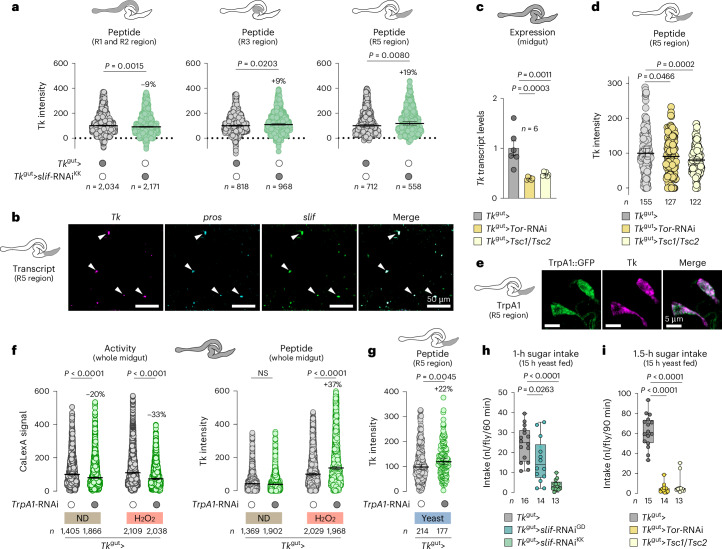
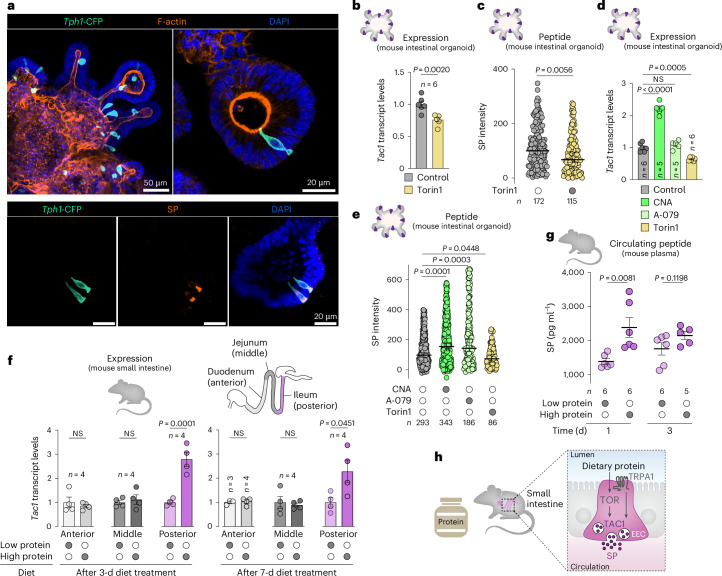
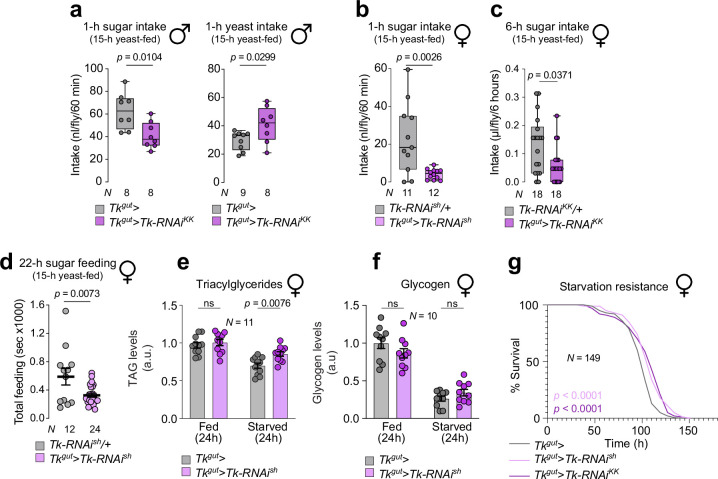
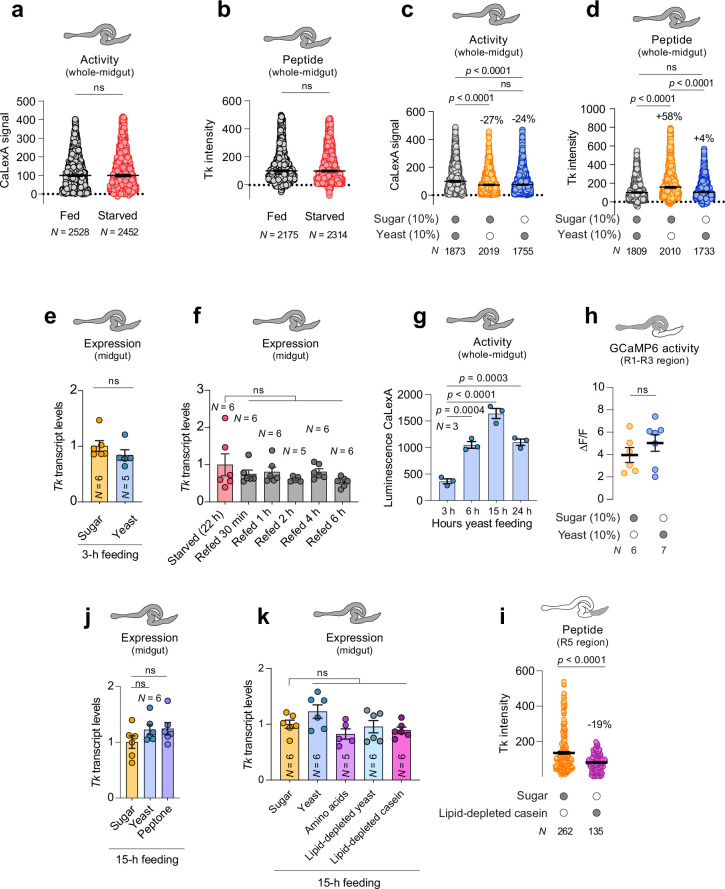
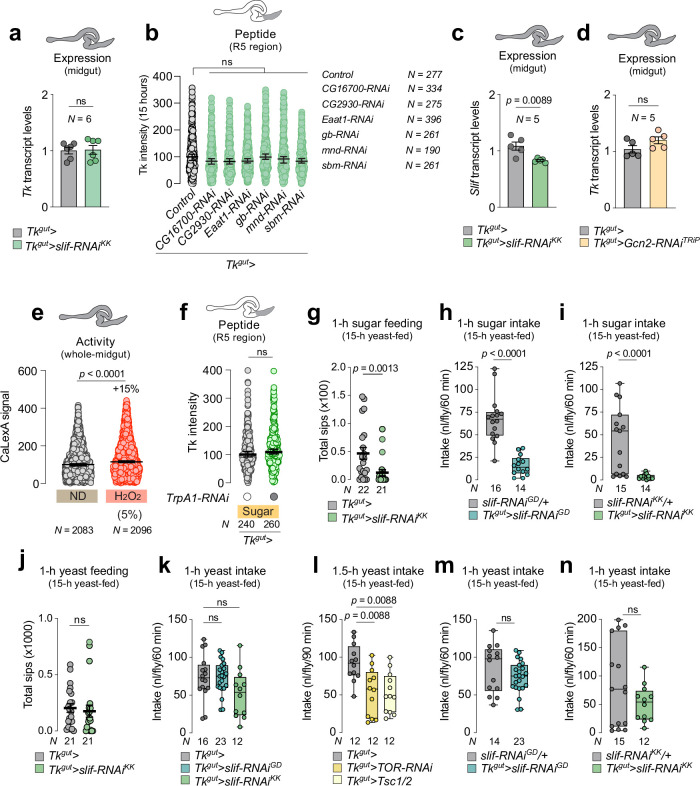
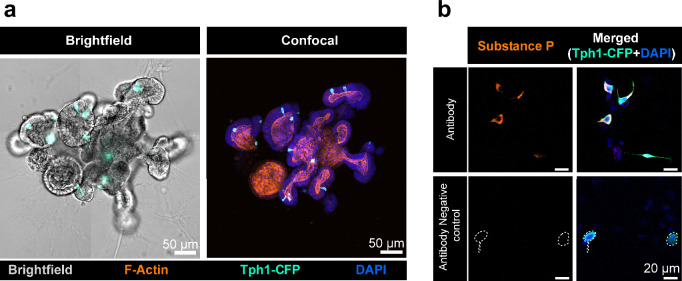
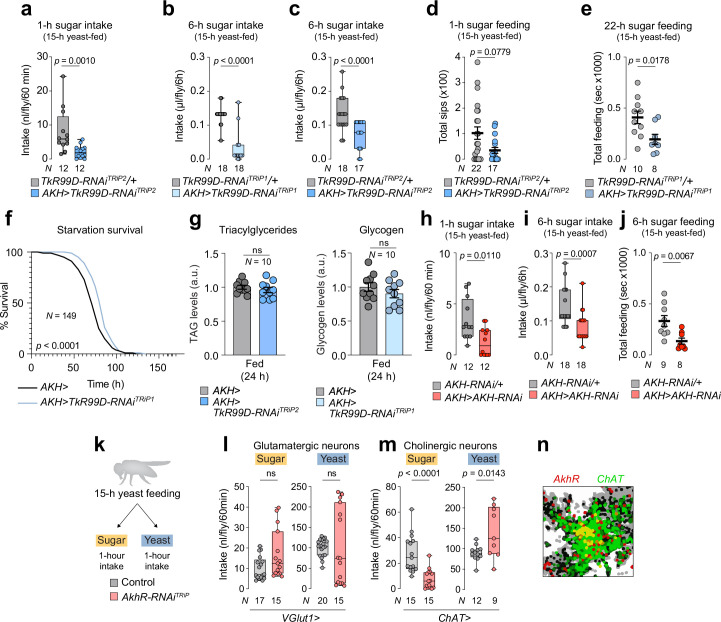
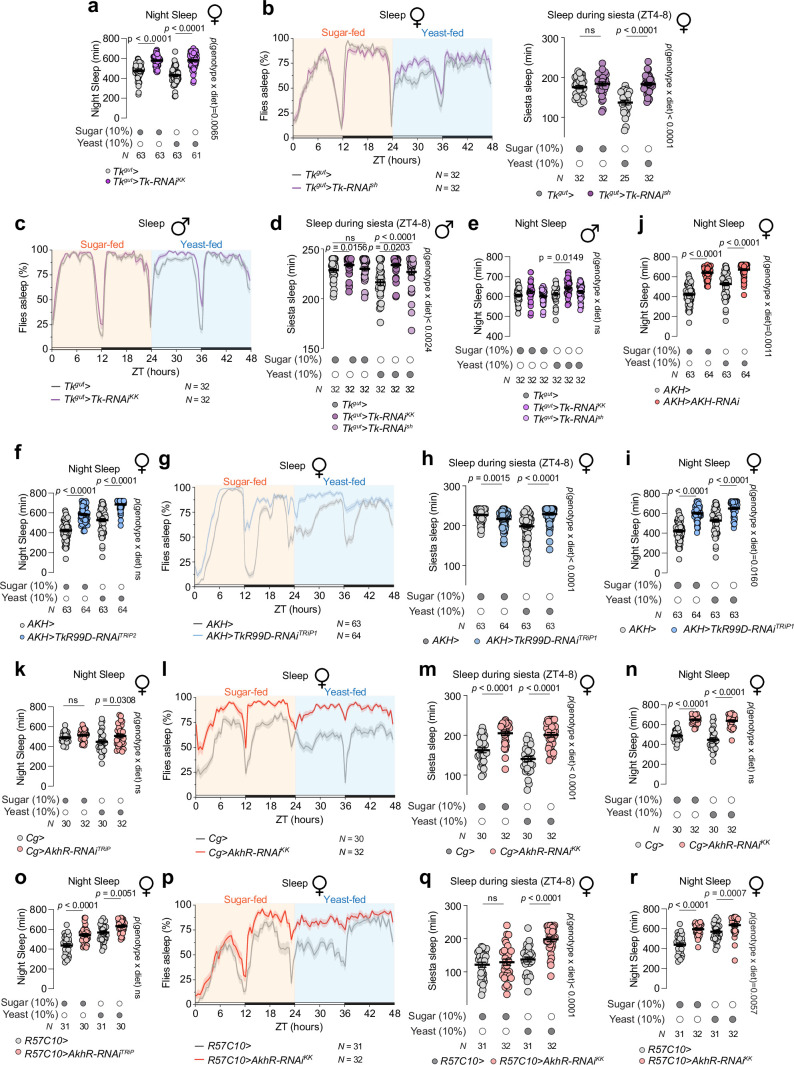
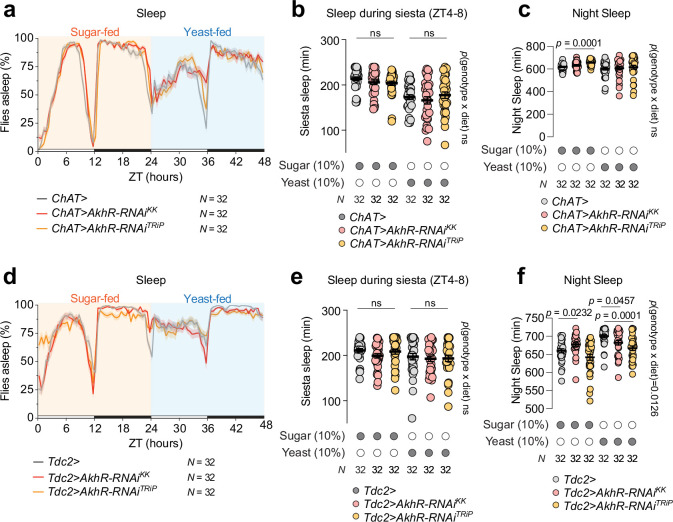
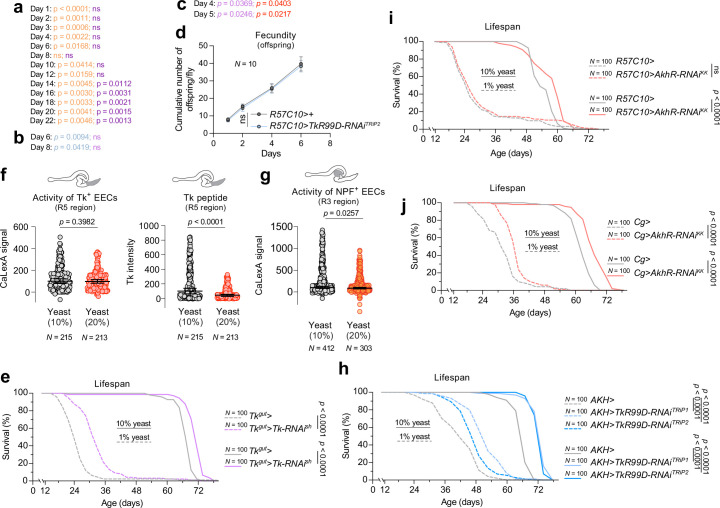
Animals select food based on hungers that reflect dynamic macronutrient needs, but the hormonal mechanisms underlying nutrient-specific appetite regulation remain poorly defined. Here, we identify tachykinin (Tk) as a protein-responsive gut hormone in Drosophila and female mice, regulated by conserved environmental and nutrient-sensing mechanisms. Protein intake activates Tk-expressing enteroendocrine cells (EECs), driving the release of gut Tk through mechanisms involving target of rapamycin (TOR) and transient receptor potential A1 (TrpA1). In flies, we delineate a pathway by which gut Tk controls selective appetite and sleep after protein ingestion, mediated by glucagon-like adipokinetic hormone (AKH) signalling to neurons and adipose tissue. This mechanism suppresses protein appetite, promotes sugar hunger and modulates wakefulness to align behaviour with nutritional needs. Inhibiting protein-responsive gut Tk prolongs lifespan through AKH, revealing a role for nutrient-dependent gut hormone signalling in longevity. Our results provide a framework for understanding EEC-derived nutrient-specific satiety signals and the role of gut hormones in regulating food choice, sleep and lifespan.


Conflict of interest statement

Competing interests: The authors declare no competing interests.

Figures

Fig. 1
Fig. 1. Gut-derived Tk affects selective appetite by increasing sugar intake and suppressing protein consumption in mated female flies.
a, Intake of sugar and yeast over a 1-h dye-feeding assay for flies previously fed a sugar or yeast diet for 15 h (two-tailed unpaired Student’s t-test). bd, Dye-feeding intake of sugar (b, 1 h), yeast (c, 1 h) and coconut oil (d, 4 h) after 15 h of yeast feeding (Kruskal–Wallis with Dunnett’s test). Sh, short-hairpin RNAi collection; KK, long-hairpin phiC31 RNAi collection, both from the Vienna Drosophila Resource Center. e, Representative confocal images of UAS-mCD8::GFP (GFP) expression in the midgut and brain driven by Tk::2A::GAL4 either alone (Tk>) or in combination with the pan-neuronal GAL4 inhibitor R57C10-GAL80 (thus Tkgut>). The mean number of GFP+ cells ±s.e.m. in each region (R1 + R2. R4, R4 and R5) is noted (n = 7–8 guts). Scale bars, 200 µm (midgut) and 50 µm (brain). f, Tk transcripts in dissected midguts and the central nervous systems (CNS) of Tkgut> and Tkgut>Tk-RNAi flies (two-tailed unpaired Student’s t-test). g, Six-hour CAFÉ assay for sugar intake in Tkgut>TkRNAi animals (Kruskal–Wallis with Dunn’s test). h, Twenty-two-hour FLIC assay for sugar-feeding behaviour of Tkgut>TkRNAi flies (one-way ANOVA with Dunnett’s test). il, Total ‘sips’ from sugar (i), yeast (j), lipid-depleted yeast (k) and mixed amino acid (l) media measured by the 1-h flyPAD assay (two-tailed Mann–Whitney U-tests). m, Preference index for yeast over sugar in the two-choice flyPAD assay following 15 h of being fed a yeast diet (two-tailed Mann–Whitney U-test). n, Two-hour yeast intake in a dye assay with TrpA1 activation of Tk+ EECs, with and without simultaneous Tk-RNAi (one-way ANOVA with Dunnett’s test). o, Model summarizing gut-derived Tk regulation of sugar and protein intake. Sample sizes (n) and P values are indicated in each plot. In ad,gn, n represents animals per group. In f, n represents central nervous system or midgut samples. Behavioural experiments were performed following 15 h of yeast feeding unless otherwise stated. Box plots show the median, the bounds of the box (25th and 75th percentiles) and whiskers representing minimum and maximum values. Dot plots in f,h include mean ± s.e.m., whereas plots in im indicate the median and 95% confidence interval. NS, not significant (P > 0.05). Source data
Fig. 2
Fig. 2. Macronutrient consumption modulates Tk+ EEC activity and Tk peptide release in mated female flies.
a, Representative images of Tk+ EECs expressing the activity reporter CaLexA from flies fed adult-optimized food. Top, Tk+ EECs (Tkgut>tdTomato, magenta) and active cells (Tkgut>CaLexA-induced GFP, green). Middle, active Tk+ EECs (GFP). Bottom, anti-Tk staining. Insets, regions R1–R5. Scale bars, 200 µm (whole midgut) and 50 µm (insets). Similar expression patterns were observed in five independent gut samples. b,c, Calcium-dependent activity (GFP/tdTomato ratio) in Tk+ EECs across the midgut (b) and anti-Tk staining intensity (c) in flies fed for 18 h with sugar, yeast or both (Kruskal–Wallis with Dunn’s test). d,e, Region-specific CaLexA analysis of Tk+ EECs (d) and Tk peptide-staining intensity (e) in midgut regions R1 + R2, R3 and R5 following 15 h of feeding on sugar or yeast (two-tailed Mann–Whitney U-tests). f,g, GCaMP6s activity in Tk+ EECs of R5 over 20 min after sugar or yeast ingestion. f, Representative GCaMP fluorescence images of Tk+ EECs. Scale bars, 10 µm. g, Left, heatmap of GCaMP signal (ΔF/F0) of single Tk+ EECs over time. g, Right, calcium indicator activity (ΔF/F0) in R5 Tk+ EECs after sugar or yeast feeding (two-tailed unpaired Student’s t-test). h, Tk+ EEC calcium activity and Tk peptide staining in R5 of flies fed for 15 h with sugar, yeast, lipid-depleted yeast or coconut oil (Kruskal–Wallis with Dunn’s test). i, Calcium activity in Tk+ EECs across the midgut after 15 h of sugar or peptone feeding (CaLexA luciferase reporter, two-tailed Mann–Whitney U-tests). j, Calcium activity (GFP/tdTomato) and anti-Tk staining in R5 Tk+ EECs after 15 h of sugar or peptone feeding (two-tailed Mann–Whitney U-tests). k, Anti-Tk staining in R5 EECs after 15 h of sugar, yeast or amino acid feeding (Kruskal–Wallis with Dunn’s test). l, A data-supported model. Sample sizes (n) and P values are indicated in each plot. In be,h,j,k, n represents EECs. In g, n represents midguts, and, in i, n represents midgut samples. Plots in be,h,j,k indicate the median and 95% confidence interval, and plots in g,i show mean ± s.e.m. NS, P > 0.05. Source data
Fig. 3
Fig. 3. TOR and TrpA1-mediated nutrient and ROS sensing regulate gut Tk release in mated female flies.
a, Tk peptide-staining intensity in midgut regions of Tk> controls and Tk>slif-RNAi animals fed for 18 h with yeast (two-tailed Mann–Whitney U-tests). b, Representative in situ hybridisation images localizing Tk, pros and slif transcripts in R5 EECs. Scale bar, 50 µm. Z projection of confocal substacks. Similar localisation patterns were observed in five independent gut samples from different animals. c,d, Expression of Tk in midguts (c) and anti-Tk staining in R5 (d) of controls and animals with reduced TOR signalling (Tor-RNAi or Tsc1 and Tsc2 overexpression) in Tk+ EECs fed for 15 h with yeast (c, one-way ANOVA with Dunnett’s test; d, Kruskal–Wallis with Dunn’s test). e, Representative images of Tk immunostaining and TrpA1::GFP (anti-GFP) coexpression in R5. Scale bars, 5 µm. Similar coexpression patterns were observed in five independent gut samples. In R5, 140 of 143 Tk+ EECs across three midguts coexpressed detectable TrpA1::GFP. f, Calcium activity (GFP/tdTomato ratio) and anti-Tk staining in Tk+ EECs throughout the midgut on a normal adult-optimized diet (ND) and medium supplemented with 5% H2O2 for 18 h, in controls and in animals with RNAi against the TrpA1 transcript in Tk+ EECs (two-tailed Mann–Whitney U-tests). g, Anti-Tk staining intensity in R5 in animals fed for 15 h on a yeast diet, with and without TrpA1 knockdown in Tk+ EECs (two-tailed Mann–Whitney U-test). h, One-hour dye-feeding assay for sugar consumption for controls and slif knockdown in Tk+ EECs, following 15 h of yeast feeding (Kruskal–Wallis with Dunn’s test). GD, long-hairpin RNAi P-element collection from Vienna Drosophila Resource Center. i, Sugar consumption over a 90-min dye-feeding assay of controls and animals with reduced TOR signalling Tk+ EECs, following 15 h of yeast feeding (Kruskal–Wallis, Dunn’s test). Sample sizes (n) and P values are indicated in each plot. In a,d,f,g, n represents EECs. In c, n represents midgut samples, and, in h,i, n represents animals per group. Plots in a,d,f,g show median and 95% confidence interval, and plots in c show mean ± s.e.m. Box plots show the median, the bounds of the box (25th and 75th percentiles) and whiskers representing minimum and maximum values. NS, P > 0.05. Source data
Fig. 4
Fig. 4. Tk in mice is regulated by nutrient and environmental sensors TOR and TRPA1.
a, Representative confocal images of mouse intestinal organoids derived from Tph1-CFP transgenic mice. Top, overview images illustrating organoid morphology along with CFP-expressing ECs (teal), F-actin (orange) and nuclei (blue). Scale bars, 50 µm (left) and 20 µm (right). Bottom, colocalization of CFP (teal) and SP (orange); nuclei (blue). Scale bar, 20 µm. Similar results were observed in five independent organoid samples. DAPI, 4,6-diamidino-2-phenylindole. b, Tac1 expression in organoids treated with the mechanistic TOR (mTOR) inhibitor Torin1 (two-tailed unpaired Student’s t-test). c, Anti-SP staining intensity within organoid EC cells (two-tailed Mann–Whitney U-test). d, Tac1 expression in organoids treated with the TRPA1 antagonist A-967079 (A-079), the TRPA1 agonist cinnamaldehyde (CNA) or the mTOR inhibitor Torin1 (one-way ANOVA with Dunnett’s test). e, Anti-SP staining intensity in EC cells treated with A-967079, CNA or Torin1 (Kruskal–Wallis with Dunn’s test). f, Region-specific Tac1 expression in the small intestine of animals fed a low- or high-protein diet for 3 d (left) or 7 d (right) (two-tailed unpaired Student’s t-tests). g, Plasma SP levels of mice fed a low- or high-protein diet for 1 or 3 d, measured by enzyme-linked immunosorbent assay (two-tailed unpaired Student’s t-tests). h, Schematic of Tac1 and SP regulation in mouse EC cells. Plots in b,d,f,g include mean ± s.e.m., and plots in c,e indicate the median and 95% confidence interval. Sample sizes (n) and P values are indicated in each plot. In b,d, n represents organoid samples. In c,e, n represents EC cells. In f, n represents guts. In g, n represents plasma samples. NS, P > 0.05. Source data
Fig. 5
Fig. 5. Gut-derived Tk regulates glucagon-like AKH signalling in mated female flies.
a, Confocal-microscopy image of a single preparation containing the brain and the ventral nerve cord, the gut and ovaries, stained for a Tk receptor reporter (TkR99D>GFP, yellow), AKH peptide (red), filamentous actin (phalloidin (phal), magenta) and DAPI (marking nuclei, blue). APCs are indicated and enlarged in the inset. Scale bars, 100 µm (main image) and 20 µm (inset). Similar expression and localisation patterns were observed in five independent samples. be, Anti-AKH staining intensity within APCs and whole-body Akh transcript levels. Scale bars 20 μm. b,c, AKH staining intensity (b) and Akh expression (c) in controls and flies with RNAi against TkR99D in APCs using Akh-GAL4 (Akh>), following 15 h of feeding on sugar or yeast medium (Kruskal–Wallis with Dunn’s test). TRiP, RNAi collection from the Harvard Transgenic RNAi Project. d, AKH staining intensity in controls and flies with knockdown of Tk in EECs (Tkgut>Tk-RNAi) after 15 h of sugar or yeast feeding (one-way ANOVA with Tukey’s test). e, AKH staining in controls and animals with RNAi against slif in Tk+ EECs (Tkgut>slif-RNAi) after 15 h of yeast feeding (two-tailed Mann–Whitney U-test). f, AKH staining in controls and animals with attenuated TOR signalling in Tk+ EECs, following 15 h of yeast feeding (Kruskal–Wallis with Dunn’s test). Sample sizes (n) and P values are indicated in each plot. In b,df, n represents APCs. In c, n represents APC tissue samples. Indicated central tendencies in b,c,e,f are the median and 95% confidence interval and in d are mean ± s.e.m. NS, P > 0.05. Source data
Fig. 6
Fig. 6. Tk modulates dietary choice through the glucagon-like AKH signalling pathway in mated female flies.
a,b, Dye-consumption assays for sugar (a) and yeast (b) in controls and animals with RNAi against TkR99D in APCs (a, one-way ANOVA with Dunnett’s test; b, Kruskal–Wallis with Dunn’s test). c,d, Longer-term feeding behaviour of similar animals: 6-h CAFÉ assay for sugar (Kruskal–Wallis with Dunn’s test) (c) and sugar-feeding behavioural data recorded for 22 h using the FLIC system (one-way ANOVA with Dunnett’s test) (d). e, Sugar sips in a 1-h flyPAD assay for controls and animals with APC-specific TkR99D knockdown (two-tailed Mann–Whitney U-test). f,g, Short-term dye-consumption nutrient-intake assays for sugar (f) and yeast (g) in controls and animals expressing APC-specific Akh RNAi (two-tailed Mann–Whitney U-test (f), two-tailed unpaired Student’s t-test (g)). h,i, Six-hour sugar intake in the CAFÉ assay (h) and 22-h sugar-feeding (i) behaviour (FLIC) of controls and animals expressing Akh knockdown in APCs (two-tailed Mann–Whitney U-test). j, Dye-consumption assay for sugar in animals with EEC-specific Tk-RNAi, in an Akh-loss-of-function background (two-tailed Mann–Whitney U-test). k, Schematic for ln showing 1-h dye assays for sugar and yeast intake. l,m, Pan-neuronal (l) or fat body (m) knockdown of AkhR (two-tailed Mann–Whitney U-tests). n, AkhR knockdown in subsets of neurons targeted by their respective GAL4 drivers: interoceptive sensory neurons (ISNs) (R34G02-GAL4); insulin-producing cells (IPCs; Ilp2>); major neurosecretory cells (dimm>); neurons of the central circadian clock (tim>); and octopaminergic (Tdc2>), dopaminergic (Tyrosine hydroxylase, TH>), glutamatergic (Vesicular glutamate transporter 1, VGlut1>) and cholinergic (ChAT>) neuronal populations (two-tailed unpaired Student’s t-test). o, Feeding behaviour toward sugar measured over 22 h in the FLIC apparatus in controls and animals with RNAi against AkhR in the cholinergic cell population (Kruskal–Wallis with Dunn’s test). p, Model that is consistent with these data. Sample sizes (n) and P values are indicated in each plot. n represents animals per group. Behavioural experiments were performed following 15 h of yeast feeding. Box plots show the median, the bounds of the box (25th and 75th percentiles) and whiskers representing minimum and maximum values. Plots in d,g indicate mean ± s.e.m., and plots in e,i,o indicate the median and 95% confidence intervals. NS, P > 0.05. Source data
Fig. 7
Fig. 7. Dietary effects on sleep and activity patterns are influenced by gut Tk signalling and AKH pathways in mated female flies.
a, Left, sleep profile graphs showing the percentage of flies asleep over time for controls and gut-specific Tk-knockdown animals consuming sugar and yeast diets. The shaded area represents s.e.m. Right, quantification of sleep during the midday ‘siesta’ from Zeitgeber time (ZT) 4 to 8 h when flies normally exhibit high sleep, in animals with Tk knockdown in the gut on sugar and yeast diets (two-tailed Mann–Whitney U-tests). b,c, Left, sleep profiles of controls and animals with RNAi against TkR99D (b) or Akh (c) in APCs. Right, quantification of midday sleep in these animals (two-tailed Mann–Whitney U-tests). d,e, Left, sleep profiles of controls and animals with RNAi against AkhR in the fat body (d) or pan-neuronally (e). Right, quantification of midday sleep in these animals (two-tailed Mann–Whitney U-tests). f, A model of Tk function consistent with these data. Sample sizes (n) and P values are indicated in each plot. n represents animals per group. Dot plots indicate the median and 95% confidence interval. NS, P > 0.05. Source data
Fig. 8
Fig. 8. Impact of gut-derived Tk and AKH modulation on fecundity and lifespan in mated female flies.
a, Cumulative number of offspring measured over a 22-d period for controls (Tkgut>) and females with EEC-specific RNAi against Tk (Tkgut > Tk-RNAi; two-way ANOVA for genotype × day, followed by Fisher’s least significant difference test; for clarity, only P ranges are indicated here, with numerical values given in Extended Data Fig. 8a). b, Cumulative offspring count over 8 d for control females and animals undergoing TrpA1-mediated exogenous activation of Tk+ EECs, with and without simultaneous knockdown of Tk (two-way ANOVA for genotype × day with Dunnett’s test; numerical P values are given in Extended Data Fig. 8b). c, Fecundity assessment of female flies with knockdown of TkR99D or Akh in APCs (two-way ANOVA for genotype × day with Fisher’s least significant difference test; numerical P values are given in Extended Data Fig. 8c). dg, Survival curves for female flies under the given dietary conditions. d, Lifespan of controls, animals with EEC-specific Tk knockdown and animals with TrpA1 activation of Tk+ EECs (with and without simultaneous Tk knockdown) on 10% and 20% yeast diets. e,f, Lifespan of animals with APC-specific knockdown of TkR99D (e) or Akh (f) on different dietary yeast concentrations. g, Longevity comparison between controls and gut-specific Tk-knockdown animals, both in an Akh-null background, on 20% and 10% yeast diets. h, Lifespan of animals with AkhR knockdown in all neurons (left, driven by R57C10-GAL4) or in fat tissue (right, with cg>), compared with their respective controls. i, A comprehensive model for Tk–SP regulation and function in mice and flies. ac indicate mean ± s.e.m. Pairwise P values in dh were obtained using log-rank (Mantel–Cox) tests. Sample sizes (n) and P values are indicated in each plot. In ac, n represents independent groups of animals. dh, n represents animals per group. NS, P > 0.05; *P ≤ 0.05; **P ≤ 0.01; ***P ≤ 0.001. Source data
Extended Data Fig. 1
Extended Data Fig. 1. Effects of gut-specific Tk knockdown on feeding behavior and metabolic homeostasis in males and mated female flies.
Comparing controls (Tkgut>) and gut-specific Tk knockdowns (Tkgut > Tk-RNAi). a, One-hour dye-feeding intake of sugar (left) and yeast (right) by male flies fed on a yeast diet for 15 h (two-tailed unpaired Student’s t test). b, One-hour dye-feeding sugar intake for UAS-Tk-RNAish alone (two-tailed Mann-Whitney U). c, Six-hour CAFÉ assay for sugar intake for UAS-Tk-RNAiKK alone (two-tailed Mann-Whitney U test). d, FLIC observation of sugar-directed feeding behavior over 22 h for UAS-Tk-RNAish alone (two-tailed unpaired Student’s t test). e and f, Whole-body triacylglyceride (e) and glycogen (f) levels measured under fed and 24-hour-starved conditions for controls and animals expressing EEC-specific RNAi against Tk (one-way ANOVA/Dunnett’s). g, Starvation-survival curves for controls and animals expressing EEC-specific RNAi targeting Tk (log-rank Mantel-Cox tests). Sample sizes (N) and p values are indicated in each plot. In ad and g, N = animals per group. In e and b, N = whole-body samples. Box plots show the median, the bounds of the box (25th and 75th percentiles), and whiskers representing the minimum and maximum values. Panels d, e, and f indicate the mean ± SEM. ns, non-significant (p > 0.05). Source data
Extended Data Fig. 2
Extended Data Fig. 2. Midgut Tk+ EEC activity, Tk peptide levels, and transcripts under different nutritional conditions in mated female flies.
a-b, Assessment of calcium-signaling activity measured by CaLexA in Tk+ EECs (a; GFP normalized to tdTomato) and Tk peptide intensity (b) in the whole midgut of mated females fed standard adult-optimized diet (9% sugar and 8% yeast) or starved on 1% agarose for four hours (two-tailed Mann-Whitney U tests). c-d, Effects on calcium signaling (c) and anti-Tk staining intensity (d) of a 3-hour period of refeeding with 10% sugar alone, 10% yeast alone, or both, following 25-hour starvation (Kruskal-Wallis/Dunn’s). e-f, Midgut Tk transcript levels in mated females: (e) animals were starved for 25 h and then refed for 3 h with 10% sugar or 10% yeast, and (f) animals were starved for 22 h and then refed with sugar+yeast medium for a range of time periods before dissection [two-tailed unpaired Student’s t test (e) and one-way ANOVA with Dunnett’s test (f)]. g, Tk+ EEC activity in dissected midguts, reflected in calcium-LexA-driven Luciferase, measured over a range of yeast-feeding durations following normal feeding on adult diet (one-way ANOVA/Dunnett’s). h, Quantification of GCaMP6s signal (ΔF/F₀) averaged across the R1-R3 Tk+ EECs in sugar- and yeast-fed conditions (two-tailed Mann-Whitney U). i, Anti-Tk staining intensity in R5 EECs of animals fed for 15 h on media containing 10% of either (naturally lipid-free) sugar or lipid-depleted casein (two-tailed Mann-Whitney U). j, Tk transcript levels in dissected midguts of animals fed for 15 h on either sugar, yeast, or the peptide mixture peptone (one-way ANOVA/Dunnett’s). k, Tk transcript levels in midguts of animals fed for 15 h on media containing either sugar, yeast, a mixture of amino acids, lipid-depleted yeast, or lipid-depleted casein (one-way ANOVA/Dunnett’s). Sample sizes (N) and p values are indicated in each plot. In ab and i, N = EECs. In eh, j, and k, N = midgut samples. Panels a, b, c, d, h, and i indicate medians and 95%-confidence intervals, and panels e, f, g, j, and k indicate means ± SEM. ns, non-significant (p > 0.05). Source data
Extended Data Fig. 3
Extended Data Fig. 3. Nutrient-intake regulation, metabolic consequences, and sleep effects of TkR99D deficiency in the APCs and loss of AKH signaling in mated female flies.
a-d, Analysis of midgut Tk peptide and transcript (a, b, d), and slif (c) transcript levels in flies expressing Tk+-EEC-specific RNAi against slif (a, c), a range of other amino-acid transporters (b), or the central regulatory gene Gcn2 (d) in animals fed 15 h with yeast. (two-tailed unpaired Student’s t tests in a, c, d; one-way ANOVA/Dunnett’s in b.) e, Calcium activity (CaLexA>GFP normalized to tdTomato) in all Tk+ midgut EECs of animals fed for 3 h on normal adult optimized diet (ND) or on medium containing hydrogen peroxide (two-tailed Mann-Whitney U). f, anti-Tk staining intensity of R5 EECs in 15 h sugar-fed controls and animals expressing RNAi against TrpA1 in Tk+ EECs (two-tailed Mann-Whitney U). g, 1-hour FlyPAD assay of sugar-directed feeding behavior for animals expressing RNAi against slif in the Tk+ EECs (two-tailed Mann-Whitney U). h-i, 1-hour dye-feeding assay for sugar consumption for UAS-slif-RNAi alone (two-tailed Mann-Whitney U tests). j-k, FlyPAD feeding behavior (j) and dye-feeding consumption (k) of yeast in controls and animals expressing RNAi against slif in the Tk+ EECs [two-tailed Mann-Whitney U (j) and Kruskal-Wallis/Dunn’s (k)]. l, Dye-feeding consumption of yeast in animals exhibiting attenuated TOR signaling in the Tk+ EECs (Kruskal-Wallis/Dunn’s). m-n, One-hour dye-feeding assay for yeast intake for UAS-slif-RNAi alone (two-tailed Mann-Whitney U tests). Behavioral experiments were performed following 15 h of yeast feeding. Sample sizes (N) and p values are indicated in each plot. In a, c, and d, N = midgut samples. In b, e, and f, N = EECs. In gn, N = animals per group. Box plots show the median, the bounds of the box (25th and 75th percentiles), and whiskers representing the minimum and maximum values. Dot plots in a-d include mean ± SEM, and in e, f, g, and j indicate the median and 95%-confidence interval. ns, non-significant (p > 0.05). Source data
Extended Data Fig. 4
Extended Data Fig. 4. Controls for organoid stains.
a, bright-field (left) and confocal (right) images of a single entire mouse-intestinal organoid. Serotonin/Substance-P-expressing enterochromaffin cells are marked with CFP expressed under the Tph1 promoter (cyan); rich actin staining with phalloidin to stain F-actin marks the luminal surface of the organoid (orange), and nuclei are marked with DAPI (blue). Scale bars span 50 µm. Similar results were observed in five independent organoid samples. b, Antibody negative control for SP staining. Top row: tissue stained with anti-SP primary (left, orange), also visualized with Tph1-CFP and DAPI for context; bottom row: tissues processed similarly except for the omission of anti-SP. Scale bar indicates 20 µm. Similar results were observed in five independent organoid samples.
Extended Data Fig. 5
Extended Data Fig. 5. Tk-mediated regulation of the AKH system regulates aspects of physiology and behavior in mated female flies.
a-c, One-hour dye-feeding assay (a) or 6-hour CAFÉ assays (b and c) for sugar in animals expressing RNAi against TkR99D in the APCs, compared to UAS-TkR99D-RNAi alone (two-tailed Mann-Whitney U tests). d and e, one-hour FlyPAD assay (d) and 22-hour FLIC assay (e) for sugar-feeding behavior comparing APC-specific TkR99D knockdowns to UAS-TkR99D-RNAi alone (two-tailed Mann-Whitney U tests). f, Starvation-survival curves for controls and animals expressing RNAi against TkR99D in the APCs [log-rank (Mantel-Cox) test]. g, Whole-body triacylglyceride (left) and glycogen (right) levels in controls and animals expressing RNAi against TkR99D in the APCs (two-tailed unpaired Student’s t tests). h and i, One-hour dye-consumption assay (h) and six-hour CAFE assay (i) for sugar intake in animals carrying UAS-Akh-RNAi alone (two-tailed Mann-Whitney U tests). j, Six-hour FLIC assay for sugar-directed feeding behavior in animals carrying UAS-Akh-RNAi alone (two-tailed Mann-Whitney U). k, a schematic of the experimental setup underlying panels l-m: controls and animals expressing RNAi against AkhR in the indicated pattern were fed yeast medium for 15 h prior to a one-hour dye assay with sugar or yeast. l and m, intake testing for AkhR-knockdown effects in the glutamatergic (VGlut1>) and cholinergic (ChAT>) neuronal populations. (two-tailed Mann-Whitney U tests, except for yeast feeding in cholinergic neurons, where two-tailed unpaired Student’s t test was used). n, Single-cell RNAseq data from fly heads indicates co-expression of AkhR and ChAT. Data from FlyCellAtlas was visualized using the SCope viewer105. Behavioral experiments were performed following 15 h of yeast feeding. Sample sizes (N) and p values are indicated in each plot. In ae, f, and hm, N = animals per group. In g, N = whole-body samples. Box plots show the median, the bounds of the box (25th and 75th percentiles), and whiskers representing the minimum and maximum values. Panels d, e, and j indicate median with 95%-confidence intervals. Panel g indicates means with SEM. ns, not significant (p > 0.05). Source data
Extended Data Fig. 6
Extended Data Fig. 6. Dietary effects on sleep are mediated by signaling via gut-derived Tk and AKH signaling in males and mated female flies.
Sleep profiles and summed minutes of sleep during the mid-day ‘siesta’ (ZT 4-8) are shown, along with total nighttime (ZT 12-24) sleep. Animals had access to sugar-only food on day 1 and yeast-only food on day 2. a, Nighttime sleep in female controls and flies expressing RNAi against Tk in the Tk+ EECs (two-tailed Mann-Whitney U tests). b, Sleep profile (left) and sleep during the midday ‘siesta’ for female controls and animals expressing RNAi against Tk in the Tk+ EECs (two-tailed Mann-Whitney U tests). c-e, Sleep profile (c) midday sleep (d), and nighttime sleep (e) for males expressing RNAi targeting Tk in the midgut EECs (Kruskal-Wallis/Dunn’s). f, Nighttime sleep for female controls and animals expressing RNAi against TkR99D in the APCs (two-tailed Mann-Whitney U tests). g-i, Sleep profile (g), midday sleep (h), and nighttime sleep (i) for female controls and animals expressing RNAi against TkR99D in the APCs (two-tailed Mann-Whitney U tests). j, Nighttime sleep in female controls and animals expressing RNAi against Akh in the APCs (two-tailed Mann-Whitney U tests). k, Nighttime sleep for female controls and animals expressing RNAi against AkhR in the fat body (two-tailed Mann-Whitney U tests). l-n, Sleep profile (l), midday sleep (m), and nighttime sleep (n) for female controls and animals expressing RNAi against AkhR in the fat body (two-tailed Mann-Whitney U tests). o, Nighttime sleep for female controls and animals expressing RNAi against AkhR in all neurons (two-tailed Mann-Whitney U tests). p-r, Sleep profile (p), midday sleep (q), and nighttime sleep (r) for female controls and animals expressing RNAi against AkhR in all neurons (two-tailed Mann-Whitney U tests). Shaded areas in sleep profiles indicate SEM. Sample sizes (N) and p values are indicated in each plot. In all panels, N = animals per group. Data in dot plots are presented with medians and 95%-confidence intervals. Two-way ANOVA was used to determine interaction between genotype and diet. ns, non-significant (p > 0.05). Source data
Extended Data Fig. 7
Extended Data Fig. 7. AKH signaling in cholinergic and octopaminergic neurons does not mediate dietary effects on sleep in mated female flies.
Sleep profiles and summed minutes of sleep during the mid-day ‘siesta’ (ZT 4-8) and total nighttime sleep are shown. During the first day of the assay, animals had access to sugar-only medium within the sleep-monitoring apparatus, and on the second day, the animals had access to yeast-only food. a-c, Sleep profile (a), midday sleep (b), and nighttime sleep (c) for female controls and animals expressing RNAi targeting AkhR in the cholinergic fraction of the nervous system using ChAT > (Kruskal-Wallis/Dunn’s). d-f, Sleep profile (d), midday sleep (e), and nighttime sleep (f) for female controls and animals expressing RNAi against AkhR in the octopaminergic neuronal population using Tdc2 > (Kruskal-Wallis/Dunn’s). Shaded areas in sleep profiles indicate SEM. Sample sizes (N) and p values are indicated in each plot. In all panels, N = animals per group. Data in dot plots are presented with medians and 95%-confidence intervals. Two-way ANOVA was used to determine interaction between genotype and diet. ns, non-significant (p > 0.05). Source data
Extended Data Fig. 8
Extended Data Fig. 8. Offspring number and lifespan in mated females flies with pan-neuronal TkR99D knockdown and significance p values related to Fig. 8a-c.
a-c, p values (a) p values for Fig. 8a, (b) p values for Fig. 8b, and (c) p values for Fig. 8c (one-way ANOVA/Dunnett’s). d, Analysis of fecundity in mated females expressing pan-neuronal TkR99D knockdown under the control of R57C10 > [two-way ANOVA (genotype × days) with Dunnett’s multiple-comparisons test]. e, Lifespan of animals with and without EEC-specific Tk knockdown, on media containing 10% or 1% yeast. Pairwise p-values derived by log-rank Mantel-Cox tests. f, Quantification of calcium-dependent activity (Tk>CaLexA), as indicated by the GFP:tdTomato ratio, in Tk+ EECs of R5, along with the intensity of anti-Tk staining, in flies fed on diets containing 10% sugar and either 10% or 20% yeast for 15 h (two-tailed Mann-Whitney U tests). g, Quantification of calcium-dependent activity, as indicated by the GFP:tdTomato ratio (driven by NPF-GAL4), in the middle midgut (R3) of flies assayed as in panel f (two-tailed Mann-Whitney U). h-j, Lifespan of female flies kept on medium containing either 10% or 1% yeast (with 10% sugar in both cases). h, controls and animals expressing RNAi targeting TkR99D in the APCs; i, flies expressing RNAi against AkhR pan-neuronally with R57C10> vs. controls; and j, animals with or without knockdown of AkhR in the fat body. Pairwise p-values in h-j determined by log-rank Mantel-Cox survival tests. Sample sizes (N) and p values are indicated. In d, N = independent groups of animals. In e, i, and j, N = animals per group. In f, N = EECs. Panel d indicates means ± SEM, whereas panels f and g indicate median and 95%-confidence intervals. ns, non-significant (p > 0.05). Source data

Similar articles

References

    1. Carreiro, A. L. et al. The macronutrients, appetite, and energy intake. Annu. Rev. Nutr.36, 73–103 (2016). - PMC - PubMed
    1. Small, C. J. & Bloom, S. R. Gut hormones and the control of appetite. Trends Endocrinol. Metab.15, 259–263 (2004). - PubMed
    1. Woods, S. C. & D’Alessio, D. A. Central control of body weight and appetite. J. Clin. Endocrinol. Metab.93, S37–S50 (2008). - PMC - PubMed
    1. Murphy, K. G. & Bloom, S. R. Gut hormones in the control of appetite. Exp. Physiol.89, 507–516 (2004). - PubMed
    1. Munch, D., Ezra-Nevo, G., Francisco, A. P., Tastekin, I. & Ribeiro, C. Nutrient homeostasis — translating internal states to behavior. Curr. Opin. Neurobiol.60, 67–75 (2020). - PubMed

LinkOut - more resources