Meta-Analysis
. 2025 May;57(5):1107-1118.
doi: 10.1038/s41588-025-02156-8. Epub 2025 Apr 14.

Genome-wide analyses identify 25 infertility loci and relationships with reproductive traits across the allele frequency spectrum

Samvida S Venkatesh  1   2 Laura B L Wittemans  3   4 Duncan S Palmer  5   6 Nikolas A Baya  5   7 Teresa Ferreira  5 Barney Hill  5   6 Frederik Heymann Lassen  5   7 Melody J Parker  5   8 Saskia Reibe  5   6 Ahmed Elhakeem  9   10 Karina Banasik  11   12 Mie T Bruun  13 Christian Erikstrup  14   15 Bitten Aagard Jensen  16 Anders Juul  17   18 Christina Mikkelsen  19   20 Henriette S Nielsen  17   21 Sisse R Ostrowski  17   19 Ole B Pedersen  17   22 Palle Duun Rohde  23 Erik Sørensen  19 Henrik Ullum  24 David Westergaard  11   12 Asgeir Haraldsson  25   26 Hilma Holm  27 Ingileif Jonsdottir  25   27 Isleifur Olafsson  28 Thora Steingrimsdottir  25   29 Valgerdur Steinthorsdottir  27 Gudmar Thorleifsson  27 Jessica Figueredo  30 Minna K Karjalainen  31   32   33 Anu Pasanen  34 Benjamin M Jacobs  35 Georgios Kalantzis  36 Nikki Hubers  37   38   39 Genes & Health Research TeamEstonian Biobank Research TeamEstonian Health Informatics Research TeamDBDS Genomic ConsortiumFinnGenMargaret Lippincott  40   41 Abigail Fraser  9   10 Deborah A Lawlor  9   10 Nicholas J Timpson  9   10 Mette Nyegaard  23   24 Kari Stefansson  25   27 Reedik Magi  30 Hannele Laivuori  31   42   43   44 David A van Heel  45 Dorret I Boomsma  38   39 Ravikumar Balasubramanian  40   41 Stephanie B Seminara  40   41 Yee-Ming Chan  41   46 Triin Laisk  30 Cecilia M Lindgren  47   48   49   50
Collaborators, Affiliations
Meta-Analysis

Genome-wide analyses identify 25 infertility loci and relationships with reproductive traits across the allele frequency spectrum

Samvida S Venkatesh et al. Nat Genet. 2025 May.

Abstract

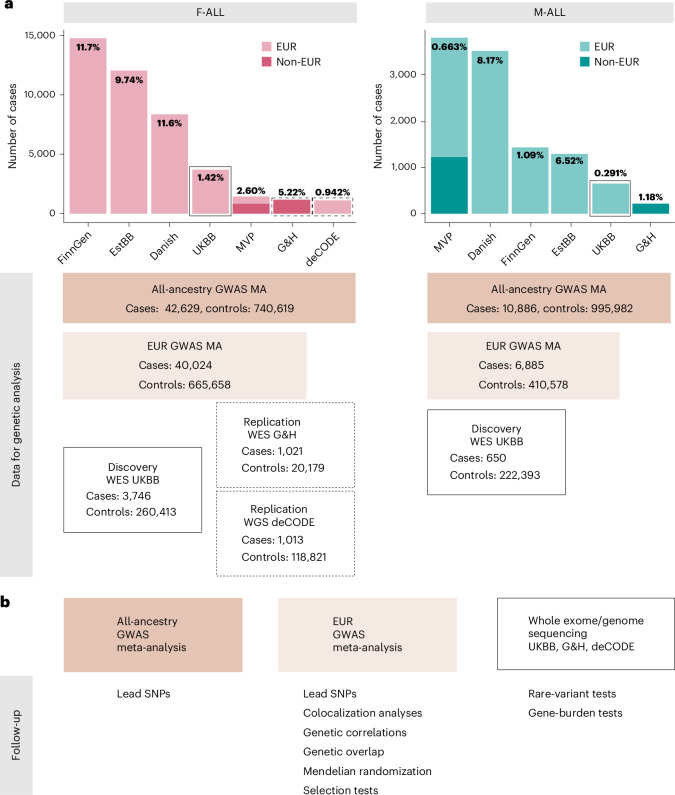
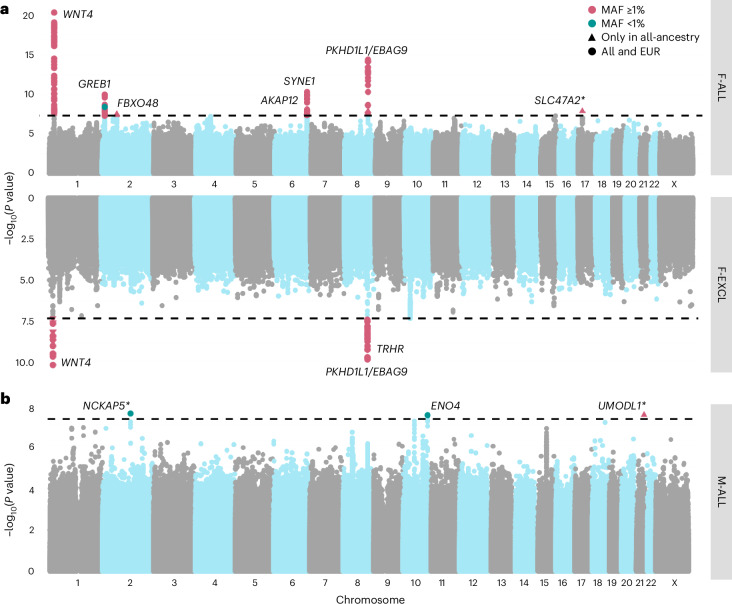
Genome-wide association studies (GWASs) may help inform the etiology of infertility. Here, we perform GWAS meta-analyses across seven cohorts in up to 42,629 cases and 740,619 controls and identify 25 genetic risk loci for male and female infertility. We additionally identify up to 269 genetic loci associated with follicle-stimulating hormone, luteinizing hormone, estradiol and testosterone through sex-specific GWAS meta-analyses (n = 6,095-246,862). Exome sequencing analyses reveal that women carrying testosterone-lowering rare variants in some genes are at risk of infertility. However, we find no local or genome-wide genetic correlation between female infertility and reproductive hormones. While infertility is genetically correlated with endometriosis and polycystic ovary syndrome, we find limited genetic overlap between infertility and obesity. Finally, we show that the evolutionary persistence of infertility-risk alleles may be explained by directional selection. Taken together, we provide a comprehensive view of the genetic determinants of infertility across multiple diagnostic criteria.


Conflict of interest statement

Competing interests: L.B.L.W. is currently employed by Novo Nordisk Research Centre Oxford but, while she conducted the research described in this manuscript, was only affiliated to the University of Oxford. V.S., G.T., H.H., I.J. and K.S. are employees of deCODE genetics, a subsidiary of Amgen. C.M.L. is a part-time employee of Population Health Partners, owns equity in Population Health Partners and its subsidiaries, reports grants from Bayer AG and Novo Nordisk and has a partner who works at Vertex. The other authors declare no competing interests.

Figures

Fig. 1
Fig. 1. Overview of study cohorts and analyses for infertility genetic association studies.
a, The case numbers in each cohort contributing to GWAS meta-analyses (MA) for female (left) and male (right) infertility. The prevalence of all-cause infertility in each cohort (%) is noted on the bar plots. Danish, Danish Blood Donor Study/Copenhagen Hospital Biobank. Total case and control counts for each type of genetic analysis: all-ancestry GWAS meta-analysis, EUR-only GWAS meta-analysis and WES analyses (discovery, UKBB and replication, G&H and deCODE) are displayed. Male infertility in deCODE, with <100 cases, was excluded from GWAS meta-analysis. Note the different y-axis scales in each subplot. b, Downstream analyses performed for each type of genetic analysis: lead variants were identified via distance-based pruning for all-ancestry and EUR-only GWAS meta-analyses; colocalization, genetic correlations (genome wide and local), genetic overlap and selection analyses were only performed for EUR meta-analyses due to the need for ancestry-matched LD information; rare-variant and gene-burden discovery tests were performed with WES data for the UKBB EUR-ancestry subset and replicated in individuals with WES data in G&H and whole-genome sequencing (WGS) data in deCODE.
Fig. 2
Fig. 2. Miami and Manhattan plots for selected infertility meta-analyses.
a, Genetic variants associated with F-ALL (top) and idiopathic infertility (unknown causes) defined by exclusion of known causes such as anatomical or anovulatory causes, PCOS, endometriosis and uterine leiomyomas (bottom). b, Genetic variants associated with M-ALL. Each point depicts a single SNP. The triangles represent SNPs that only reach genome-wide significance in all-ancestry GWAS meta-analyses. SNPs are annotated with the mapped gene. *The lead variant is reported in only one cohort. Summary statistics from whole-genome regression analyses were meta-analyzed using fixed-effect inverse-variance weighting in the METAL software to produce the displayed P values. The dashed line represents the multiple testing-corrected P value threshold of P < 5 × 10−8, accounting for ~1 million independent variants in the genome.
Fig. 3
Fig. 3. Genetic correlations between female infertility and other phenotypes.
SNP-based genetic correlations (rg) between significantly heritable phenotypes (Z > 4) were estimated using LD-score regression, performed using the LDSC software on a subset of 1 million HapMap3 SNPs. The points are colored by rg estimate, scaled by significance (−log10(P)), and labeled with the associated rg estimate if nominally significant without correction for multiple testing (P < 0.05). a, Genetic correlations among three definitions of female infertility (F-ALL, F-ANOV and F-INCL). b, Genetic correlations between female infertility traits and reproductive hormones testosterone, FSH and AMH (publicly available summary statistics) in female-specific analyses and TSH (publicly available summary statistics) from sex-combined analysis. c, Genetic correlations between female infertility traits and female reproductive conditions, with summary statistics generated from the largest available EUR-ancestry studies for each trait (Methods). d, Genetic correlations between female infertility traits and selected heritable phenotypes (Z > 4) in the UKBB, as generated by the Neale laboratory. Correlations with all heritable phenotypes can be found in Supplementary Table 12.
Fig. 4
Fig. 4. Local genetic correlations and polygenic overlap between female infertility and other phenotypes.
a, Local genetic correlations, estimated using LAVA, at 2,495 blocks across the genome. Each point represents a local bivariate genetic correlation between an infertility trait (F-ALL, F-ANOV or F-INCL) and reproductive hormone, reproductive condition or obesity-related trait. The dashed lines indicate significance (sig.) thresholds. The dashed line represents FDR-adjusted or Bonferroni-adjusted P values of 0.05. b, MiXeR estimates of polygenic overlap. The Venn diagrams indicate the estimated number (s.e.m.) of causal variants (in thousands) that explain 90% SNP heritability per component. The circle size reflects the degree of polygenicity. The bars outline the genome-wide genetic correlation (rG) and correlation in the shared polygenic component (rho). The colored portion of the bar is sized by the proportion of causal variants in the shared polygenic component as compared with all causal variants involved and colored by rho. Comp., comparative.
Fig. 5
Fig. 5. Directional selection scores at infertility-associated EBAG9 locus.
Recent directional selection, as measured by trait-aligned SDSs (tSDSs) at the EBAG9 locus. The window of ±10 kb around the lead variant associated with F-ALL is displayed, along with the location of nearest gene TSSs. The tSDSs are aligned to the infertility risk-increasing allele, wherein a positive tSDS indicates positive selection for infertility risk-increasing allele at the locus. The dashed lines indicate 2.5th percentile (%ile) and 97.5th %ile of SDSs. Left: a locus plot depicting genomic position on the x axis and tSDS on the y axis. The lead variant rs1964514 (open circle) is not present in the tSDS dataset and thus is assigned a score of 0. Right: a scatter plot depicting relationship between −log10 of the GWAS P value for the variant association with F-ALL on the x axis and tSDS on the y axis.
Fig. 6
Fig. 6. Rare variants associated with testosterone and infertility in UKBB WES analyses.
a, The mean effect size versus allele frequency of genetic variants associated with total testosterone estimated using regression analyses. Variants discovered at genome-wide significance (P < 5 × 10−8) in GWAS meta-analyses (nfemale = 235,579, nmale = 235,096) and exome-wide significance (P < 1 × 10−7) in the UKBB WES analyses (nfemale = 197,038, nmale = 197,340) are plotted. The effect sizes are aligned to the minor allele, plotted against MAF on the log x axis. b, The effects of testosterone-associated rare variants (chr:pos:minor allele:major allele) on infertility in females (left: n cases/controls for F-ALL = 3,746/260,413; n cases/controls for F-EXCL = 3,012/261,147) and males (right: n cases/controls for M-ALL = 650/222,393) estimated using regression analyses. The effect sizes are aligned to the minor allele. Per gene, the variant with the lowest P value of all variants that reach exome-wide significance in UKBB WES analyses for testosterone is displayed, for all variants with nominally significant effects on infertility. Effect sizes (β and 95% CIs) for the variant effect on testosterone are to the left of each plot and effect sizes (ORs and 95% CIs) for the variant effect on infertility are to the right of each plot.

Update of

  • Genome-wide analyses identify 21 infertility loci and over 400 reproductive hormone loci across the allele frequency spectrum.
    Venkatesh SS, Wittemans LBL, Palmer DS, Baya NA, Ferreira T, Hill B, Lassen FH, Parker MJ, Reibe S, Elhakeem A, Banasik K, Bruun MT, Erikstrup C, Jensen BA, Juul A, Mikkelsen C, Nielsen HS, Ostrowski SR, Pedersen OB, Rohde PD, Sorensen E, Ullum H, Westergaard D, Haraldsson A, Holm H, Jonsdottir I, Olafsson I, Steingrimsdottir T, Steinthorsdottir V, Thorleifsson G, Figueredo J, Karjalainen MK, Pasanen A, Jacobs BM, Hubers N; Genes & Health Research Team; Estonian Biobank Research Team; Estonian Health Informatics Research Team; DBDS Genomic Consortium; FinnGen; Lippincott M, Fraser A, Lawlor DA, Timpson NJ, Nyegaard M, Stefansson K, Magi R, Laivuori H, van Heel DA, Boomsma DI, Balasubramanian R, Seminara SB, Chan YM, Laisk T, Lindgren CM. Venkatesh SS, et al. medRxiv [Preprint]. 2024 Mar 20:2024.03.19.24304530. doi: 10.1101/2024.03.19.24304530. medRxiv. 2024. Update in: Nat Genet. 2025 May;57(5):1107-1118. doi: 10.1038/s41588-025-02156-8. PMID: 38562841 Free PMC article. Updated. Preprint.

References

    1. Infertility Prevalence Estimates, 1990–2021 (World Health Organization, 2023); https://www.who.int/publications/i/item/978920068315
    1. Matzuk, M. M. & Lamb, D. J. The biology of infertility: research advances and clinical challenges. Nat. Med.14, 1197–1213 (2008). - PMC - PubMed
    1. Bonavina, G. & Taylor, H. S. Endometriosis-associated infertility: from pathophysiology to tailored treatment. Front. Endocrinol.13, 1020827 (2022). - PMC - PubMed
    1. Hoeger, K. M., Dokras, A. & Piltonen, T. Update on PCOS: consequences, challenges, and guiding treatment. J. Clin. Endocrinol. Metab.106, e1071–e1083 (2021). - PubMed
    1. Vannuccini, S. et al. Infertility and reproductive disorders: impact of hormonal and inflammatory mechanisms on pregnancy outcome. Hum. Reprod. Update22, 104–115 (2016). - PMC - PubMed

Publication types

Substances

LinkOut - more resources