

Development of a clinical-molecular prediction model for central lymph node metastasis in cN0 stage papillary thyroid microcarcinoma: a retrospective study
- PMID: 40229698
- PMCID: PMC11998336
- DOI: 10.1186/s12885-025-14112-0
Development of a clinical-molecular prediction model for central lymph node metastasis in cN0 stage papillary thyroid microcarcinoma: a retrospective study
Abstract
Background: Identifying occult central lymph node metastasis (CLNM) is essential for guiding prophylactic lymph node dissection (PLND) in patients with cN0 stage papillary thyroid microcarcinoma (PTMC). This study aimed to identify molecular prognostic biomarkers associated with PTMC and develop a clinical-molecular prediction model for CLNM.
Methods: Differentially expressed genes (DEGs) in PTMC were identified through bioinformatics analysis of the TCGA database. Prognostic DEGs were selected using Cox and LASSO regression analyses, and a risk-scoring model was constructed based on these genes. The prognostic value of the model was validated using Kaplan-Meier survival analysis and ROC curves. DEG expression levels were compared between patients with CLNM and those without (NCLNM). Clinical data and surgical specimens were collected from 404 patients with cN0 stage PTMC treated at the First Affiliated Hospital of Ningbo University in 2022. The cohort was randomly divided into a derivation cohort (n = 323) and a validation cohort (n = 81). DEG expression was quantified using RT-qPCR. Univariate and multivariate logistic regression analyses were conducted in the derivation cohort to identify predictors of CLNM and develop a predictive model. The model's performance was evaluated using the Hosmer-Lemeshow test, ROC curves, calibration curves, and decision curve analysis (DCA).
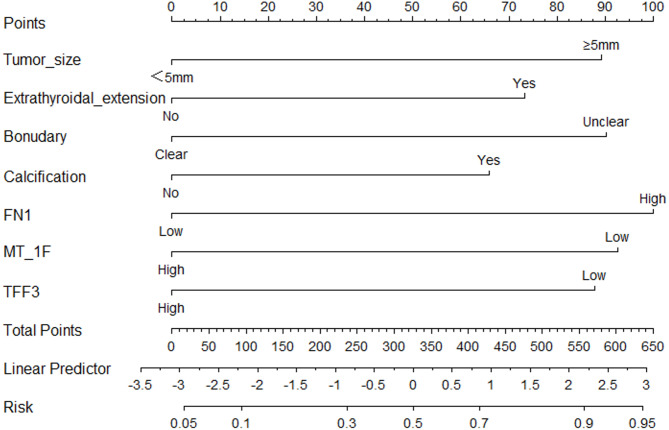
Results: In the TCGA database, FN1, MT-1 F, and TFF3 were identified as prognostic biomarkers. Risk scores based on these genes achieved AUCs of 0.789 (5 years) and 0.674 (10 years) for predicting disease-free survival. Furthermore, FN1, MT-1 F, and TFF3 expression levels were significantly higher in the CLNM group compared to the NCLNM group. Among the 404 PTMC patients, the incidence of CLNM was 42.6% (n = 172). RT-qPCR analysis demonstrated significantly elevated expression of FN1 in both PTMC tissues compared to normal tissues and in the CLNM group relative to the NCLNM group, while MT-1 F and TFF3 exhibited markedly reduced expression levels. In the derivation cohort, FN1, MT-1 F, TFF3, tumor size ≥5 mm, calcification, multifocality, and extrathyroidal extension were independent predictors of CLNM. The prediction model based on these factors showed AUCs of 0.736 (derivation cohort) and 0.813 (validation cohort). Moreover, calibration curves, the Hosmer-Lemeshow test (χ² = 2.411, P = 0.966), and DCA confirmed the model's robust performance and clinical utility.
Conclusion: FN1, MT-1 F, and TFF3 are valuable prognostic biomarkers for PTMC. The clinical-molecular prediction model incorporating these genes provides a basis for personalized PLND decision-making in cN0 stage PTMC patients.
Trial registration number: Not applicable.
Keywords: Lymph node metastasis; Molecular markers; Papillary thyroid microcarcinoma; Prediction model.
© 2025. The Author(s).
Conflict of interest statement
Declarations. Ethics approval and consent to participate: This study was conducted in accordance with the Declaration of Helsinki and was approved by the Ethics Committee of the First Affiliated Hospital of Ningbo University (Approval No. 2021-R140). All TCGA data used in this study are publicly available through the National Cancer Institute’s Genomic Data Commons portal ( https://portal.gdc.cancer.gov/ ). Written informed consent was obtained from all participants involved in the study. Consent for publication: Not applicable. Competing interests: The authors declare no competing interests.
Figures


References
MeSH terms
Substances
Supplementary concepts
Grants and funding
LinkOut - more resources
Full Text Sources
Medical
Miscellaneous
