. 2025 Apr 15;30(1):279.
doi: 10.1186/s40001-025-02484-9.

Integrated bioinformatics analysis reveals that OPRK1 inhibits ferroptosis and induces enzalutamide resistance in prostate cancer

Affiliations

Integrated bioinformatics analysis reveals that OPRK1 inhibits ferroptosis and induces enzalutamide resistance in prostate cancer

Liangrong Zhang et al. Eur J Med Res. .

Abstract

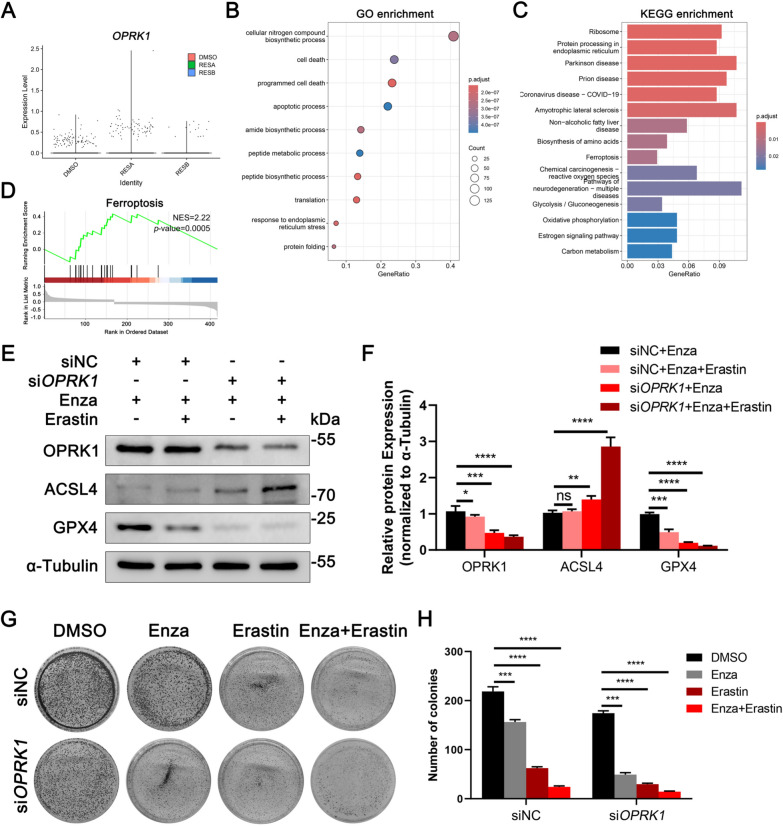
Enzalutamide (Enz) is employed in the management of castration-resistant prostate cancer (CRPC). However, a substantial subset of patients may develop resistance to Enz, thereby reducing its therapeutic effectiveness. The underlying mechanisms contributing to the development of Enz resistance in PCa, whether arising from androgen deprivation or the burden of Enz treatment, remain inadequately understood. OPRK1 plays a key role in Enz resistance through ferroptosis inhibition, which is detected by the analysis of Gene Expression Omnibus (GEO) databases. Silencing OPRK1 via small interfering RNA (siRNA) resulted in the activation of ferroptosis signaling in LNCaP cells. These findings indicate that OPRK1 significantly contributes to Enz resistance in PCa and may serve as a promising therapeutic target for resistant patients.

Keywords: Enzalutamide; Ferroptosis; OPRK1; Prostate cancer.


Conflict of interest statement

Declarations. Ethics approval and consent to participate: All procedures performed in this study were in accordance with the ethical standards of the Ethics Committee of The First Hospital of Shanxi Medical University (NO. DWYJ-2023-094) and with the 1964 Helsinki Declaration and its later amendments or comparable ethical standards. Competing interests: The authors declare no competing interests.

Figures

Fig. 1
Fig. 1
Identification and functional enrichment of key Enz resistance-related DEGs from the GEO database A Volcano plots illustrating the DEGs in dataset GSE51872, with red dots representing upregulated genes and blue dots representing downregulated genes. B Volcano plots illustrating the DEGs in dataset GSE56829, with red dots representing upregulated genes and blue dots representing downregulated genes. C Volcano plots illustrating the DEGs in dataset GSE69249, with red dots representing upregulated genes and blue dots representing downregulated genes. D Heatmap depicting the DEGs across various samples in dataset GSE51872. E Heatmap depicting the DEGs across various samples in dataset GSE56829. F Heatmap illustrating DEGs across various samples in dataset GSE69249. G GO pathway enrichment analysis of DEGs in dataset GSE51872. (H) GO pathway enrichment analysis of DEGs in dataset GSE56829. I GO pathway enrichment analysis of DEGs in dataset GSE69249. J KEGG pathway enrichment analysis of DEGs in dataset GSE51872. K KEGG pathway enrichment analysis of DEGs in dataset GSE56829. L KEGG pathway enrichment analysis of DEGs in dataset GSE69249
Fig. 2
Fig. 2
Enz resistance gene co-expression networks revealed by WGCNA A WGCNA was performed on Enz response samples from dataset GSE51872. The resulting dendrogram illustrated the clustering of DEGs according to various metrics. Each branch corresponded to an individual gene, while the colors beneath the branches denoted distinct co-expression modules. B Similarly, WGCNA was conducted on Enz resistance samples from dataset GSE56829. The dendrogram depicted the clustering of DEGs based on different metrics, with each branch representing a single gene and each color beneath the branches indicating a specific co-expression module. C WGCNA was conducted on Enz resistance samples in dataset GSE69249. The resulting dendrogram illustrated the clustering of DEGs according to various metrics. Each branch of the dendrogram corresponded to an individual gene, while the colors beneath the branches indicated distinct co-expression modules. D The heatmap depicted the correlation between gene modules and the response to Enz treatment. The correlation coefficients within each cell of the heatmap represented the strength of the association between gene modules and specific traits, with the intensity of the correlation decreasing from red to blue. E The heatmap illustrated the correlation between gene modules and the progression of CRPC. The correlation coefficient within each cell denoted the strength of the association between gene modules and traits, with values decreasing from red to blue. F Similarly, the heatmap depicted the correlation between gene modules and the response to Enz. The correlation coefficient within each cell represented the relationship between gene modules and traits, with values decreasing from red to blue. G The Venn diagram visualized the common hub genes shared between DEGs and those derived from WGCNA based on the GSE51872 dataset. H The common hub genes identified between DEGs and WGCNA from the GSE56829 dataset were visualized using a Venn diagram. I Similarly, the common hub genes identified between DEGs and WGCNA from the GSE69249 dataset were visualized using a Venn diagram. J The top enriched GO pathways among the common hub genes from the GSE51872 dataset were analyzed, with the horizontal axis representing the p-value of GO terms on Metascape. K The top enriched GO pathways among the common hub genes from the GSE56829 dataset were analyzed, with the horizontal axis representing the p-value of GO terms on Metascape. L The top enriched GO pathways among common hub genes from the GSE69249. The horizontal axis represented the p-value of GO terms on Metascape
Fig. 3
Fig. 3
Hub genes in PCa and their expression and prognosis A The common hub genes shared among the three GEO datasets were visualized using a Venn diagram. B The expression levels of four selected genes were analyzed in the TCGA database, comparing PCa samples (red) and normal samples (gray). C Kaplan–Meier curves were generated to assess disease-free survival (DFS) in PCa patients, stratified by high versus low expression of the four selected genes in the TCGA dataset. D The expression levels of hub genes were estimated in the GSE51872 dataset. E The expression levels of hub genes were estimated in the GSE56829 dataset. F The expression levels of hub genes were estimated in the GSE69249 dataset. *p < 0.05
Fig. 4
Fig. 4
Signaling pathways downstream of OPRK1 identified by scRNA-seq A The UMAP technique was employed to categorize cells into 11 distinct clusters, each represented by a unique color corresponding to its designated phenotype. B The heatmap illustrates the expression levels of the top five DEGs across each cell cluster. C The cell–cell communication signaling network among the 11 clusters was analyzed using CellChat. The right panel depicts the spatial distribution of cell clusters based on the number of their significant incoming (Y-axis) and outgoing (X-axis) signaling interactions. D Heatmap illustrating the CellChat signaling within each cluster. The left panel depicts the outgoing signaling patterns, represented by the expression weight values of signaling molecules, while the right panel illustrates the incoming signaling patterns, indicated by the expression weight values of signaling receptors. The gradient from white to dark green signifies a range from low to high expression weight values in the heatmap. E The inferred network of the MIF signaling pathway. F The heatmap illustrates the enrichment of various pathways across 11 distinct cell clusters as determined by GSVA. Each column corresponds to a specific group or subpopulation of cells, while each row represents an individual pathway. The intensity of red coloration indicates higher scores, whereas blue coloration signifies lower scores. G Feature plots depict the spatial distribution of BTG2, OPRK1, PTGER2, and TSPAN3 across the 11 cell clusters
Fig. 5
Fig. 5
OPRK1 plays a role in PCa Enz response in vitro A Violin plots illustrating the expression levels of the OPRK1 gene across 11 distinct cell clusters in four scRNA-seq samples. B The most significantly enriched GO pathways among DEGs in OPRK1-positive (OPRK1+) and OPRK1-negative (OPRK1) cells were identified and depicted graphically. C The most significantly enriched KEGG pathways among DEGs in OPRK1+ and OPRK1 cells were identified and depicted graphically. D The ferroptosis pathway was identified and graphically represented using GSEA. E Western blot analysis of OPRK1 and ferroptosis-related protein levels in LNCaP cell lines. F Quantitative analysis of the Western blotting results was conducted using ImageJ software. G Colony formation assay of LNCaP cells was performed following a 14 day treatment with 10 μM Enz or 5 μM erastin. H Quantitative analysis of the colony formation assay was also performed using ImageJ software. Error bars represent the standard deviation (± SD). Statistical significance is indicated as follows: *p < 0.05, **p < 0.01, ***p < 0.001, ****p < 0.0001, ns indicates non-significant differences

Similar articles

References

    1. Siegel RL, Giaquinto AN, Jemal A. Cancer statistics, 2024. CA Cancer J Clin. 2024;74:12–49. - PubMed
    1. Qiu H, Cao S, Xu R. Cancer incidence, mortality, and burden in China: a time-trend analysis and comparison with the United States and United Kingdom based on the global epidemiological data released in 2020. Cancer Commun (Lond). 2021;41:1037–48. - PMC - PubMed
    1. Wang M, Dai B, Liu Q, Zhang X. Prognostic and immunological implications of heterogeneous cell death patterns in prostate cancer. Cancer Cell Int. 2024;24:297. - PMC - PubMed
    1. Huang Q, Mitchell C, Theodoulou E, Lee ACK, Brown J. Implementation of fracture risk assessment in men with prostate cancer requiring long-term androgen deprivation therapy: a systematic scoping review using the i-PARIHS implementation framework. J Cancer Surviv. 2024;71(3):209. - PubMed
    1. Akkus E, Arslan Ç, Ürün Y. Advancements in platinum chemotherapy for metastatic castration-resistant prostate cancer: insights and perspectives. Cancer Treat Rev. 2024;130: 102818. - PubMed

MeSH terms

LinkOut - more resources