. 2025 Apr 14;26(1):95.
doi: 10.1186/s13059-025-03566-x.

Extracellular vesicle-derived miRNA-mediated cell-cell communication inference for single-cell transcriptomic data with miRTalk

Affiliations

Extracellular vesicle-derived miRNA-mediated cell-cell communication inference for single-cell transcriptomic data with miRTalk

Xin Shao et al. Genome Biol. .

Abstract

MicroRNAs are released from cells in extracellular vesicles (EVs), representing an essential mode of cell-cell communication (CCC) via a regulatory effect on gene expression. Single-cell RNA-sequencing technologies have ushered in an era of elucidating CCC at single-cell resolution. Herein, we present miRTalk, a pioneering approach for inferring CCC mediated by EV-derived miRNA-target interactions (MiTIs). The benchmarking against simulated and real-world datasets demonstrates the superior performance of miRTalk, and the application to four disease scenarios reveals the in-depth MiTI-mediated CCC mechanisms. Collectively, miRTalk can infer EV-derived MiTI-mediated CCC with scRNA-seq data, providing new insights into the intercellular dynamics of biological processes.

Keywords: Cell–cell communication; Extracellular vesicle; MiRNA; ScRNA-seq; Spatial transcriptomics.


Conflict of interest statement

Declarations. Ethics approval and consent to participate: Not applicable. Consent for publication: Not applicable. Competing interests: The authors declare that they have no competing interests.

Figures
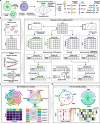
Fig. 1
Fig. 1
Schematic representation of the miRTalk workflow and visualization. a Construction of the miRTalkDB based on the EV-derived miRNA databases including ExoCarta, Vesiclepedia, EVmiRNA, and primary literature, and experimentally verified data on MiTIs from miRTarBase and TarBase. Statistics of the miRTalkDB including the number of EV-derived miRNAs, MiTIs, and functional annotation for EV-derived miRNAs of humans, mice, and rats. b Input data of miRTalk including a scRNA-seq data matrix and corresponding cell type annotation for each cell. Detailed diagram of the miRTalk algorithmic process: for a given sender-receiver pair, the widely expressed miRNAs and highly variable target genes were identified based on expression levels. Based on the potential of producing EVs and the expression of miRNAs in senders as well as the activation of miRNA processing machinery and the expression of target genes in receivers, significant MiTIs with negative or positive regulation were enriched. Output data of miRTalk encompassing an enrichment of EV-derived miRNAs and associated MiTIs between sender and receiver cell types. c Analysis of MiTI-mediated CCC using chord, circle, Sankey, and heatmap visualizations, which illustrate the quantity and score of MiTIs from sender cells to receiver cells. d Visualizations of MiTIs and specificity analysis from sender cell types to receiver cell types, represented by chord, circle, bubble, and heatmap plots. EVBS, extracellular vesicle biogenesis and secretion; RISC, RNA-induced silencing complex; RITAC, RNA-induced transcriptional activation complex
Fig. 2
Fig. 2
Performance evaluation on simulated benchmarking datasets. a Simulated datasets containing true samples with the high score of EVBS and the high expression of miRNA in senders as well as the high score of RISC and the low expression of target gene in receivers for the inference of MiTIs with negative regulation. b Simulated datasets containing true samples with the high score of EVBS and the high expression of miRNA in senders as well as the high score of RISC and the high expression of target gene in receivers for the inference of MiTIs with positive regulation. c AUROC and AUPRC of benchmarked methods on the simulated datasets with miRTalk@P and miRTalk@R representing Pearson correlation and random approaches of miRTalk, respectively
Fig. 3
Fig. 3
Performance comparison on simulated benchmarking datasets. a Simulated datasets containing true samples with highly expressed miRNA genes in sender cells and lowly expressed target genes in receiver cells for negatively regulated MiTIs. Boxplots displayed the distribution of AUROC and AUPRC across simulated datasets for each method. For the boxplots showing the minima, 25 th percentile, median, 75 th percentile, and maxima, the number of data points for each method is 20 with the median value shown beside each box. b Simulated datasets for the inference of autocrine communications mediated by MiTIs. Point plots displayed Pearson correlation coefficients and corresponding P values of inferred MiTIs by miRTalk on the simulated dataset containing 1000 cells and 1000 gens with 50% miRNA/target coverage with an example of inferred MiTI, namely miRNA346-target180 interaction. c The Pearson correlation coefficients between the gene expression of miRNAs and their targets on the simulated datasets and the ratio of significant MiTIs with negative regulation inferred by miRTalk and CSmiR. For the boxplots showing the minima, 25 th percentile, median, 75 th percentile, and maxima, the numbers of data points from left to right are 500, 709, 486, 722, 478, 722, 490, 750, 460, 728, 484, 772, 488, 755, 482, 729, 503, 675, 466, 707, 500, 709, 326, 475, 180, 262, 77, 110, 18, 31, 500, 709, 324, 463, 185, 263, 77, 128, 14, and 30 respectively. AUROC, area under the receiver operating characteristic curve. AUPRC, area under the precision-recall curve
Fig. 4
Fig. 4
Prediction of miRTalk consistent with the literature evidence on real datasets. a RNA-seq and miRNA-seq data involving human colorectal cancer cells and their secreted EVs. b Comparison of the miRNA and MiTI score inferred by miRTalk from the RNA-seq data of cells and real levels of miRNAs inside EVs measured by miRNA-seq data, with r and P representing the Pearson correlation coefficient and significant difference. For the boxplots showing the minima, 25 th percentile, median, 75 th percentile, and maxima, the numbers of data points involving the macrovesicle from left to right are 46, 46, 248,076, and 197,747 respectively, while the numbers of data points involving the exosome from left to right are 46, 46, 244,284, and 201,539 respectively. Significant differences between the two groups were calculated with the one-sided (greater) T-test. c The hypothesis regarding the expression and score of onco-miR- 24 - 3p in BLCA tumor samples is expected to surpass that in normal samples, while the expression and score of TS-miR- 29a- 3p are expected to be lower than that in normal samples. The number of data points in each group is 19. d Inferred CCC among CC, fibroblasts, myofibroblasts, and Endo mediated by the miR- 24 - 3p and miR- 29a- 3p derived from CC. e Difference comparison of miRNA scores of miR- 24 - 3p and miR- 29a- 3p inferred by miRTalk between BLCA tumor and normal samples. The number of data points in each group is 19. f Hypothesis regarding that the expression and MiTI score of onco-miR- 24 - 3p in CHOL tumor samples is expected to surpass that in normal samples, while the expression and communication score of TS-miR- 142 - 3p in tumor samples is expected to be lower than that in normal samples. The numbers of data points in normal and tumor groups are 9 and 18, respectively. g Inferred CCC from CC to T cells mediated by the miR- 24 - 3p and from MPs to CC mediated by miR- 142 - 3p. h Difference comparison of MiTI scores of miR- 24 - 3p and miR- 29a- 3p inferred by miRTalk between CHOL tumor and normal samples. For each miRNA, the MiTI with the most significant negative correlation between the expression of miRNA and its target gene was selected to perform the comparison. The numbers of data points in normal and tumor groups are 9 and 18, respectively. i Hypothesis regarding that the expression and score of onco-miR- 24 - 3p in OV tumor samples is expected to be lower than that in treated samples. The number of data points in each group is 18, and the outliers were identified. j Inferred CCC among CC, stromal cells, and immune cells mediated by the miR- 24 - 3p in treatment-naïve and post-treatment samples. k Difference comparison of miRNA scores of miR- 24 - 3p inferred by miRTalk between OV treatment-naïve and post-treatment samples. The number of data points in each group is 5. l Correlation between the miRNA scores of onco-miR- 24 - 3p and the clinical tumor biomarker CA125 in OV patients. Significant differences between the two groups were calculated with the one-sided (less) T-test for miR- 24 - 3p. One-sided (greater) T-test for miR- 29a- 3p and miR- 142 - 3p as well as miR- 24 - 3p in (k). MP, macrophage; CA125, carbohydrate antigen 125; CC, cancer cell; Endo, endothelial cell; BLCA, bladder cancer; CHOL, cholangiocarcinoma; OV, ovarian cancer
Fig. 5
Fig. 5
Oncogenic modulation ofglioblastoma cells on the TME sensed by nonmalignant cells. a The human glioblastoma (GBM) scRNA-seq dataset comprising 3533 cells, encompassing malignant cells, astrocytes (Astro), oligodendrocytes (Oligo), endothelial cells (Endo), neurons, macrophages (MP), oligodendrocyte precursor cells (OPC). b EV-derived miRNA-mediated CCC inferred by miRTalk, delineating the number of MiTIs between pairwise cell types in GBM. c Heatmap displaying the miRNA score of inferred EV-derived miRNAs among senders, i.e., Astro, malignant cells, MP, neurons, Oligo, and OPC. d Relevance of the inferred MiTIs with the OS and DFS with the Log-rank test using the EV-derived MiTI score for separating the high-risk and low-risk GBM patients. e Difference analysis of EV-derived MiTI scores between MiTIs with and without significant survival relevance. NS, not significant. The numbers of data points from left to right are 452, 4072, 816, and 3708, respectively. Significant differences between the two groups were calculated with the one-sided (greater) T-test. f Potential onco- and TS-MiTIs with OS or DFS relevance using the expression level of the miRNA or their target gene alone for separating high-risk and low-risk GBM patients. The number of data points in each group is 301. g Analysis of the onco-MiTI between miR- 125 - 5p and its target gene PABPC1. h Expression of MIR125B1 that encodes the miR- 125b- 5p and its target gene PABPC1 shown in the UMAP plot. i Related metabolic pathways of miR- 125b- 5p and Spearman correlation (rho) between the scaled module scores of miR- 125b- 5p-related metabolic pathway signatures and the scaled expression of the target gene PABPC1 of miR- 125b- 5p. j Analysis of the onco-MiTI between miR- 222 - 3p and its target gene TP53BP2. k Expression of MIR106B that encode the miR- 106b- 3p and its target gene FN1. l Related pathways of miR- 106b- 3p and its target gene FN1. m Analysis of the onco-MiTI between miR- 106b- 3p and its target gene FN1 with positive regulation. For the survival analysis, the Log-rank test was used to evaluate the significant difference between two curves based on the Kaplan–Meier analysis and the median value was used to separate patients. The Spearman coefficient (rho) was applied to test the significance of the correlation between the scaled expression of a given miRNA and its target gene. TCGA, the cancer genome atlas. The bar plot showed the mean ± SEM. Significant differences between the two groups (5 normal samples and 8 tumor samples) were calculated with the one-sided (less) T-test in (f, g, j)
Fig. 6
Fig. 6
Characterization of signal transmissions forming the fibrogenic niche in the kidney. a The mouse scRNA-seq dataset of the fibrotic kidney comprises vascular smooth muscle cells (VSMCs), injured VSMCs, mesangial cells, pericytes, parietal epithelial cells (PECs), and myofibroblasts. UUO, unilateral ureteral obstruction. b EV-derived MiTI-mediated CCC inferred by miRTalk, displaying the number of MiTIs between pairwise cell types in normal and fibrotic kidneys. c Heatmap showing the miRNA scores of inferred miRNAs derived from different senders. d Gene expression of inferred miRNAs in the sender cell types of uninjured and injured kidneys with the scRNA-seq data. The number of data points in uninjured and injured groups involving the VSMC are 273 and 250, respectively. The number of data points in uninjured and injured groups involving the pericyte are 75 and 121, respectively. e Gene expression of inferred miRNAs in the uninjured and injured kidneys with the bulk miRNA-seq data. f Inferred MiTIs from injured VSMCs to myofibroblasts. g UMAP plot showing the gene expression of Mir132 and its target gene Btg2 among kidney cells. h Functional annotations of miR- 132 - 3p and its target gene Btg2. i Specificity for all miRNAs in senders regarding target genes in PECs. j UMAP plot showing the gene expression of Mir27a and its target gene Epha4 among kidney cells. k Functional annotations of miR- 132 - 3p and its target gene Btg2. l Correlation between the scaled module scores of the negative regulation of EMT signatures and the scaled expression of the target gene Epha4 of miR- 125b- 5p. Spearman coefficient (rho) was used. m Single-cell trajectory analysis with the monocle3 for the construction of the pseudotime trajectory. n GSVA score for the EMT hallmark collected from the MSigDB. The bar plot showed the mean ± SEM. Significant differences between the two groups were calculated with the one-sided (less) Wilcoxon test for scRNA-seq data and the T-test for bulk miRNA-seq data
Fig. 7
Fig. 7
Identification of the granulocyte-hepatocyte communication discriminating between normal and fatty liver transplantation. a The rat scRNA-seq dataset of the normal and high-fat diet transplanted livers including granulocytes, MPs, monocytes, DCs, hepatocytes, NK cells, Kupffer cells, T cells, Endo, and B cells. b EV-derived MiTI-mediated CCC inferred by miRTalk, displaying the number of MiTIs between pairwise cell types in normal and high-fat diet livers. c Heatmap showing the miRNA scores of inferred miRNAs derived from different senders. The receivers include B cells, DCs, endos, hepatocytes, Kupffer cells, T cells, monocytes, and NK cells in normal and fatty livers and granulocytes in normal liver. d Gene expression of inferred miRNAs in the sender cell types of normal and fatty transplanted livers with the scRNA-seq data. The numbers of data points in normal and high-fat groups involving the granulocyte are 3874 and 4245, respectively. The numbers of data points in normal and high-fat groups involving the hepatocyte are 1736 and 2449, respectively. Significant differences between the two groups for Mir223 and Mir290 were calculated with the one-sided (greater) Wilcoxon test. One-sided (less) Wilcoxon test for Mir21. (e) Fold change (FC) of gene expression of inferred miRNAs in the liver under the conditions of pre-LT and post-LT. f Specificity for all miRNAs in senders regarding target genes in hepatocytes of high-fat transplanted livers. g Functional annotation of hsa-miR- 223 - 3p and its target gene Vim. h Expression of Col1a1 and module score of the TGF-beta pathway signatures in hepatocytes of normal and high-fat transplanted livers. Significant differences between the two groups were calculated with the one-sided (less) Wilcoxon test. i Gene set enrichment analysis (GSEA) with gene sets from MSigDB by comparing the differentially expressed genes (DEGs) of hepatocytes of normal and fatty transplanted livers. Significant differences between the two groups were calculated with the one-sided (less) Wilcoxon test. j Expression of Mir223 and its target gene Vim among hepatic non-parenchymal cells of transplanted livers. k Functional annotation of hsa-miR- 223 - 3p and its target gene Vim. l Expression of Vim and module score of apoptosis in hepatocytes of normal and high-fat transplanted livers. The number of data points in normal and high-fat groups involving the hepatocyte are 865 and 355, respectively. m The survival rate of BRL- 3 A after OGD/R treatment and expression of Vim evaluated by RT‐qPCR. The number of data points in each group is 3. Significant differences between the two groups for the survival rate were calculated with the one-sided (less) T-test. One-sided (greater) T-test for the Vim level. n Predicted duplex structures for rno-miR- 223 - 3p and its target gene Vim by miRanda. MP, macrophage; DC, dendritic cell; NK, natural killer; Endo, endothelial cell. LT, liver transplantation. OGD/R, oxygen–glucose deprivation/reperfusion. The bar plot showed the mean ± SEM
Fig. 8
Fig. 8
Inference of spatially resolved pro-generative communication in the mouse skeletal muscle injury. a The mouse scRNA-seq dataset of the skeletal muscles under the uninjured and post-injury day 2, 5, and 7 conditions induced by notexin, involving the uninjured myofiber, injured locus, and border. b Heatmap showing the number of MiTIs between pairwise cell types in uninjured and injured muscles as well as the miRNA scores of inferred miRNAs derived from different regions at the post-injury days 2, 5, and 7. c Gene expression of inferred miRNAs in the uninjured and injured regions with the scRNA-seq data. Significant differences between the two groups were calculated with the one-sided (less) Wilcoxon test. d Gene expression of inferred miRNAs in the uninjured and injured muscles with the bulk miRNA-seq data. e Gene expression of Mir142a and its target gene Nmrk2 among the skeletal muscles at different time points. f Comparison of gene expression of Mir142a and its target gene Nmrk2 among the different regions of skeletal muscles at the post-injury day 2. Significant differences between the two groups for the miRNA gene were calculated with the one-sided (less) Wilcoxon test. One-sided (greater) Wilcoxon test for the target gene. g Functional annotations of miR- 142a- 5p and its target gene Nmrk2. h Gene expression of Mir145a and its target gene Ms4a6c among the skeletal muscles at different time points. i Comparison of gene expression of Mir145a and its target gene Ms4a6c among the different regions of skeletal muscles at the post-injury day 2. j Functional annotations of miR- 145a- 5p and its target gene Ms4a6c. Significant differences between the two groups for the miRNA gene were calculated with the one-sided (less) Wilcoxon test. One-sided (greater) Wilcoxon test for the target gene. k Correlation between the scaled module scores of the skeletal muscle tissue development and skeletal muscle cell different signatures and the scaled expression of the target gene Ms4a6c of miR- 145a- 5p. Spearman coefficient (rho) was used. The bar plot showed the mean ± SEM. The number of data points in the uninjured group involving the myofiber is 1045. The number of data points in day 2 groups involving the myofiber, injury border, and injury locus are 272, 197, and 561, respectively

Similar articles

References

    1. Garcia-Martin R, Wang G, Brandao BB, Zanotto TM, Shah S, Kumar Patel S, Schilling B, Kahn CR. MicroRNA sequence codes for small extracellular vesicle release and cellular retention. Nature. 2022;601:446–51. - PMC - PubMed
    1. Makarova J, Turchinovich A, Shkurnikov M, Tonevitsky A. Extracellular miRNAs and cell-cell communication: problems and prospects. Trends Biochem Sci. 2021;46:640–51. - PubMed
    1. Mori MA, Ludwig RG, Garcia-Martin R, Brandao BB, Kahn CR. Extracellular miRNAs: from biomarkers to mediators of physiology and disease. Cell Metab. 2019;30:656–73. - PMC - PubMed
    1. Isaac R, Reis FCG, Ying W, Olefsky JM. Exosomes as mediators of intercellular crosstalk in metabolism. Cell Metab. 2021;33:1744–62. - PMC - PubMed
    1. Wang J, Li L, Zhang Z, Zhang X, Zhu Y, Zhang C, Bi Y. Extracellular vesicles mediate the communication of adipose tissue with brain and promote cognitive impairment associated with insulin resistance. Cell Metab. 2022;34(1264–1279): e1268. - PubMed

LinkOut - more resources